


The Zilliqa (ZIL) price has been consolidating above a long-term support area at $0.027 since breaking out at the end of November.
Despite this, lower time-frames have begun to turn bearish, suggesting that Zilliqa will drop back support levels.
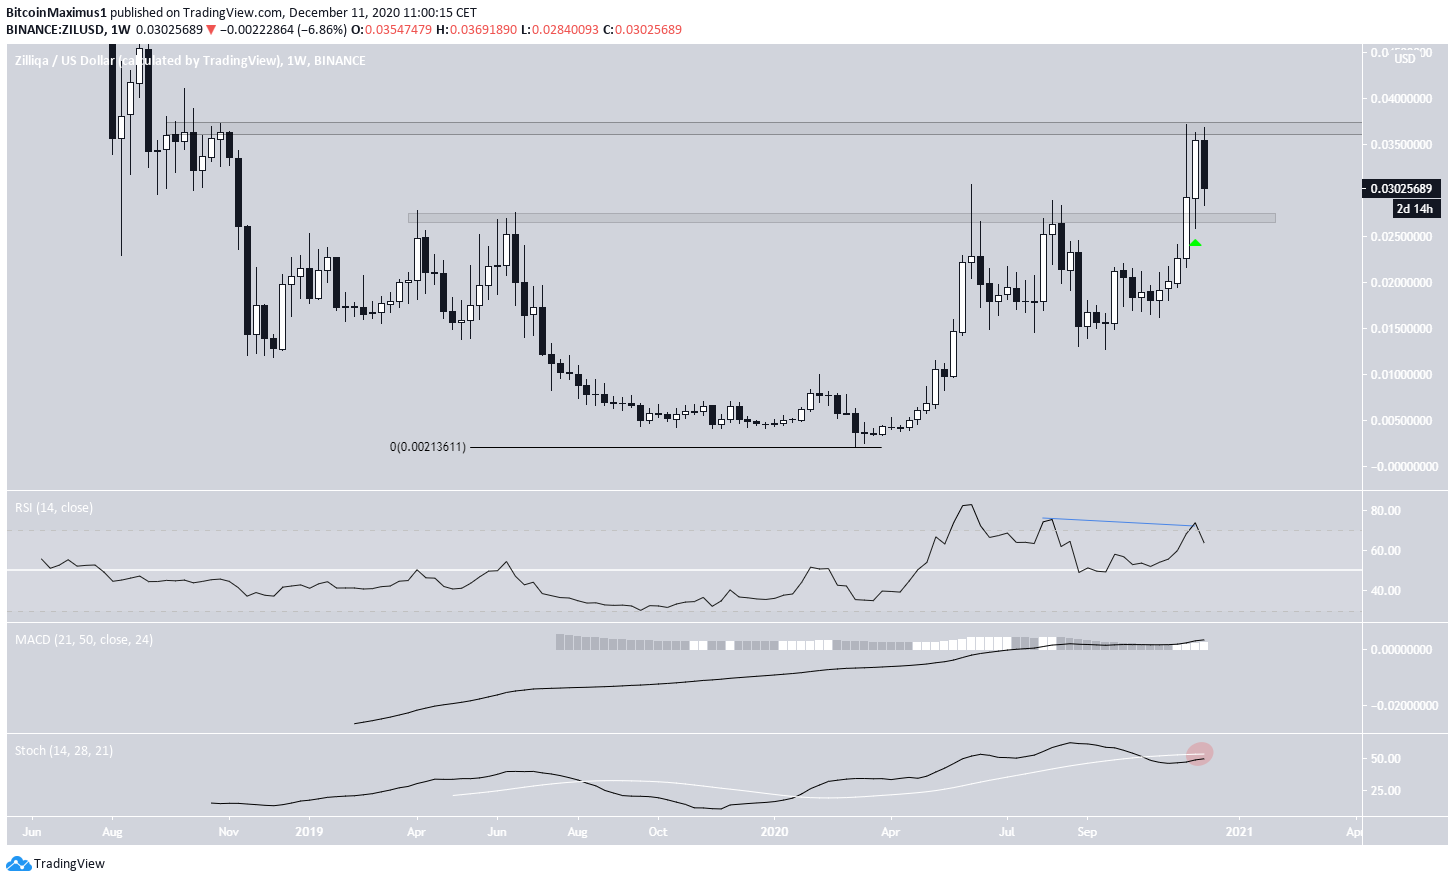
ZIL Long-Term Levels
The ZIL price is currently trading between two major levels at $0.027 and $0.037. The former is acting as support and the latter as resistance.
ZIL broke out above $0.027 on Nov. 26, returned to validate it as support, and began another upward move towards $0.037. However, on Dec.7, ZIL was rejected and began the current downward price action.
Technical indicators are mixed. While the RSI has generated a bearish divergence and fallen below 70, the MACD is moving upwards. The Stochastic oscillator is moving upwards but has not yet made a bullish cross.
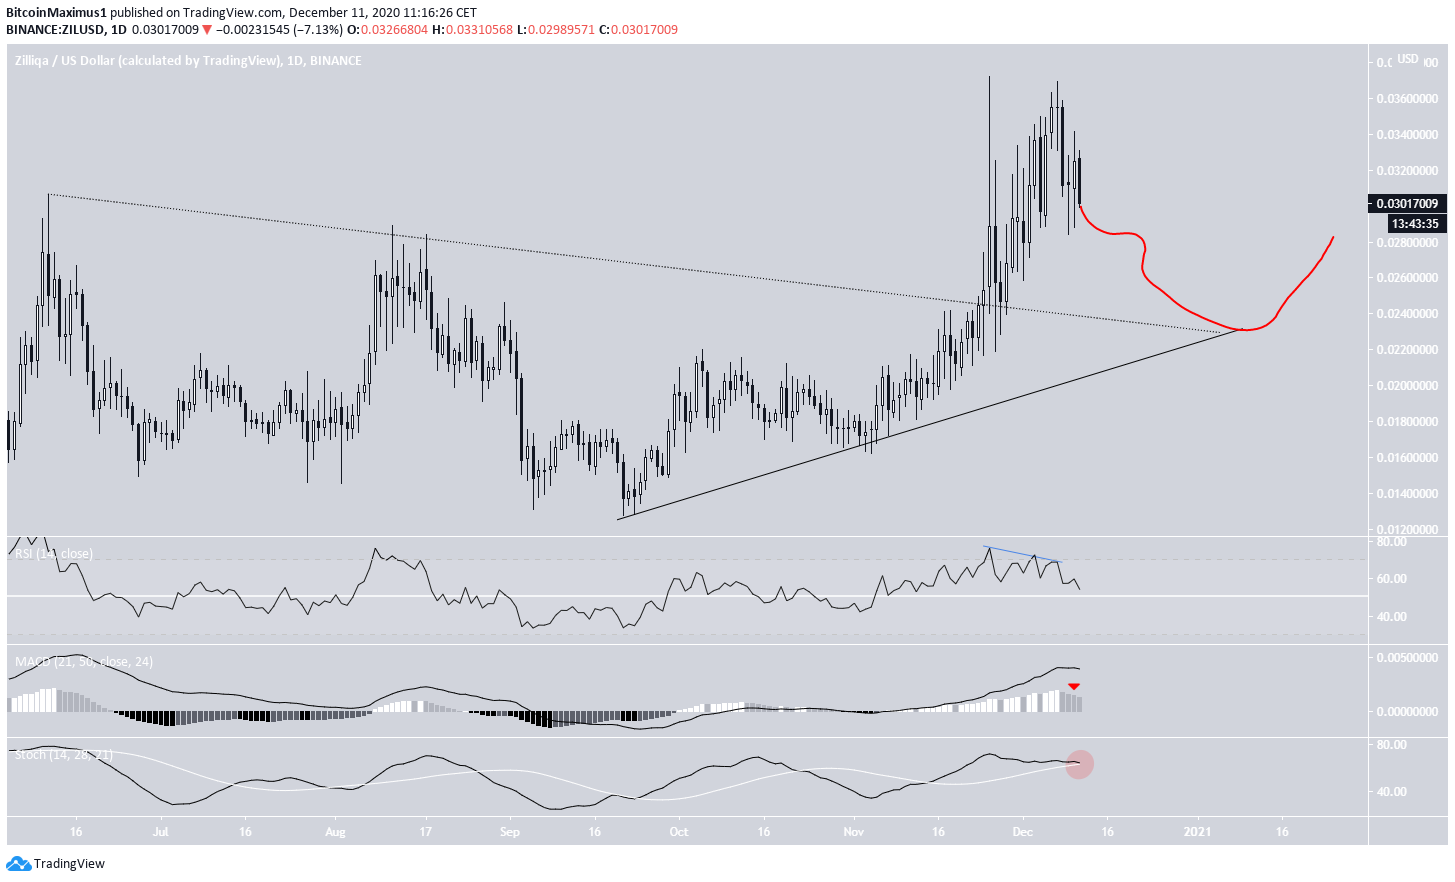
Bearish Scenario
The daily chart suggests that a downward move for ZIL is most likely.
After breaking out from a descending resistance line (dotted) ZIL continued to increase but could not sustain the highs and created a long upper wick. The ensuing upward move generated considerable bearish divergence in the RSI. In addition, the MACD is decreasing and the Stochastic oscillator is very close to making a bearish cross.
If ZIL continues to drop, it may find support a the point of confluence between the descending resistance line and the current ascending support line (solid). This confluence gives us a target near $0.024 for ZIL to reach a low.
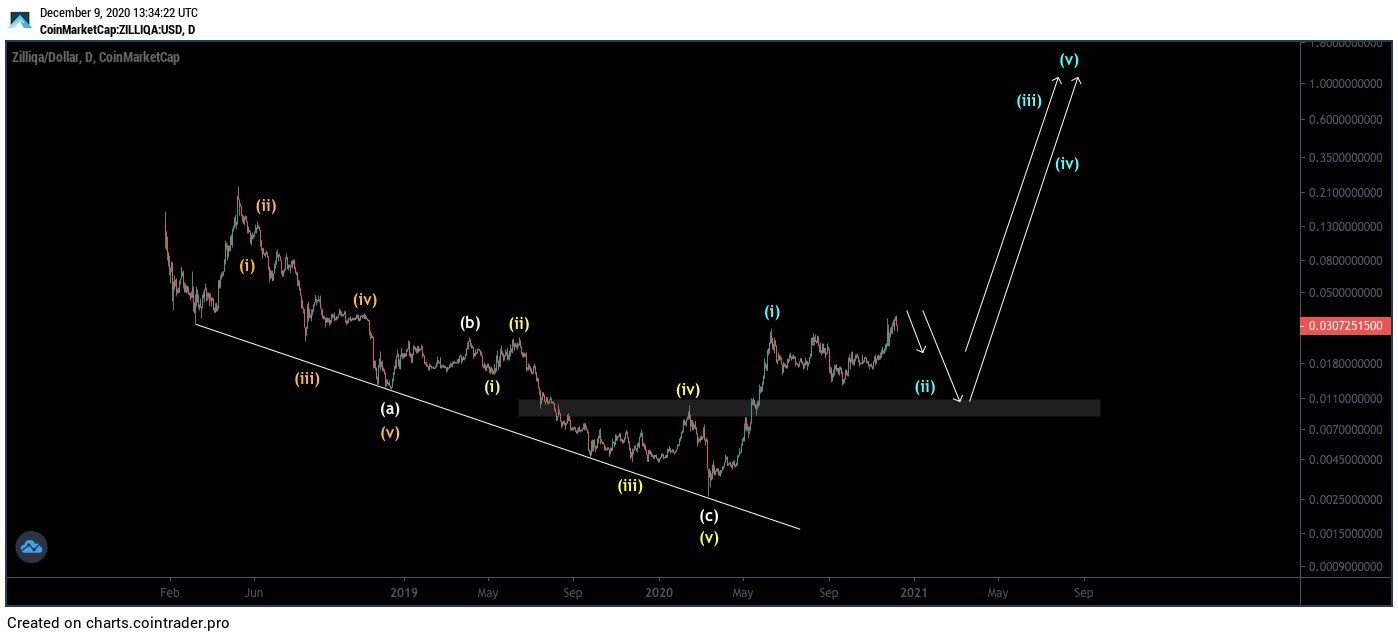
Cryptocurrency trader @CryptoTony_ outlined a ZIL chart, stating that it will likely undergo a major decrease towards $0.01 before moving any higher.
While this is possible, there are several support levels above the area that are likely to offer support.
Conclusion
ZIL is expected to decrease towards the ascending support line at $0.024. A breakdown from the support line could trigger an extended move to the downside.
For BeInCrypto’s latest BNB analysis, click here!
Disclaimer: Cryptocurrency trading carries a high level of risk and may not be suitable for all investors. The views expressed in this article do not reflect those of BeInCrypto.


