


Ziliqa (ZIL) has broken down from its Jan. 2021 lows, but is trading in a bullish pattern and is showing signs of a potential bullish reversal.
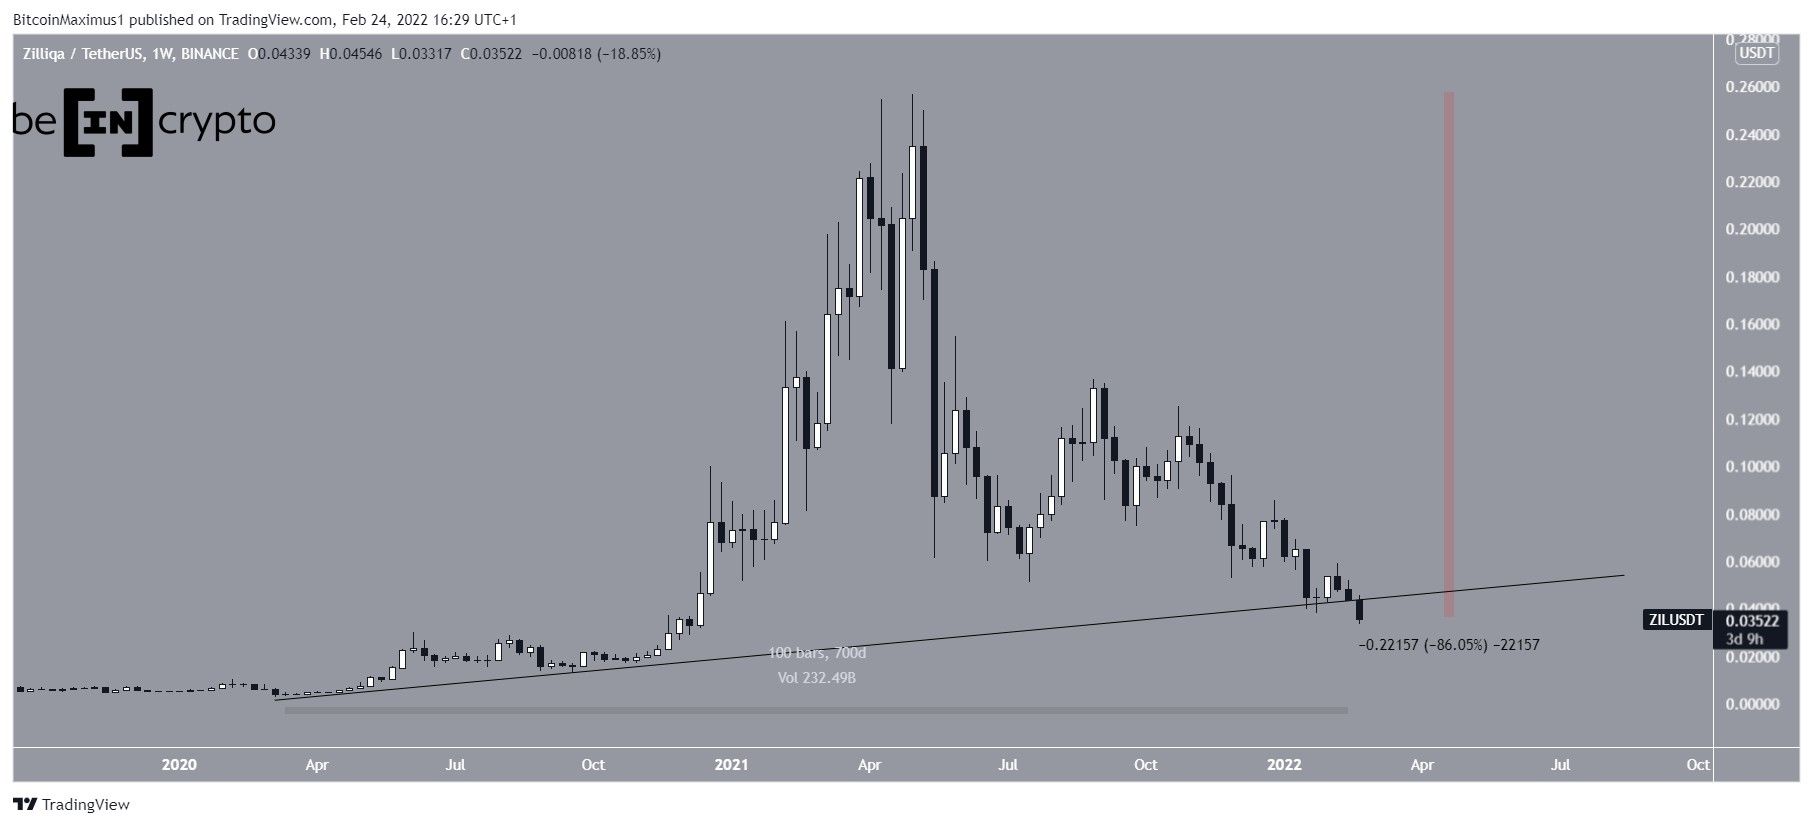
ZIL has been decreasing since reaching an all-time high price of $0.257 on May 6. The downward movement has led to a low of $0.033 on Feb. 24. This amounted to a decrease of 86% since the aforementioned all-time high price.
While there are three more days left until the weekly close, a significant price increase would be required in order for the support line to remain intact.
ZIL trades in bullish pattern
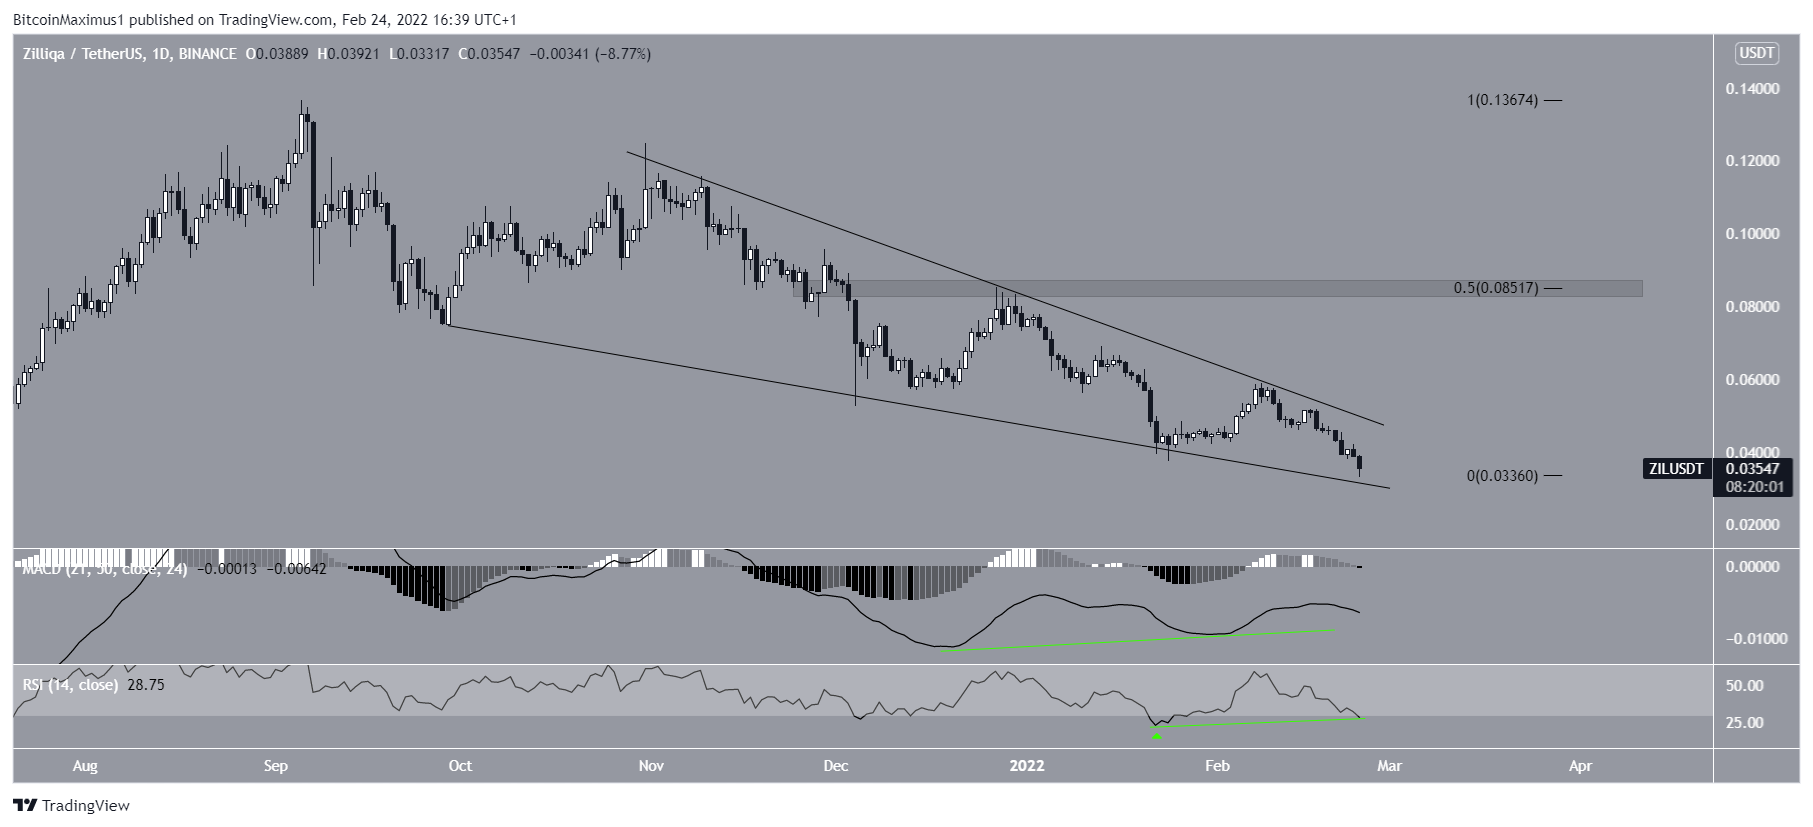
Despite the ongoing decrease, the daily chart shows that ZIL has been trading inside a descending wedge since Sept. 2021. The wedge is considered a bullish pattern. Therefore, a breakout from it would be the most likely scenario.
The breakout is supported by significant bullish divergences in both the RSI and MACD.
In the case of the RSI, this occurred after the indicator bounced from its lowest levels since 2019 on Jan. 24 (green icon). Such pronounced bullish divergences often precede a trend reversal.
If a breakout transpires, the closest resistance area would be at $0.086. This is the 0.5 Fib retracement resistance level and a horizontal resistance area.
Wave count analysis
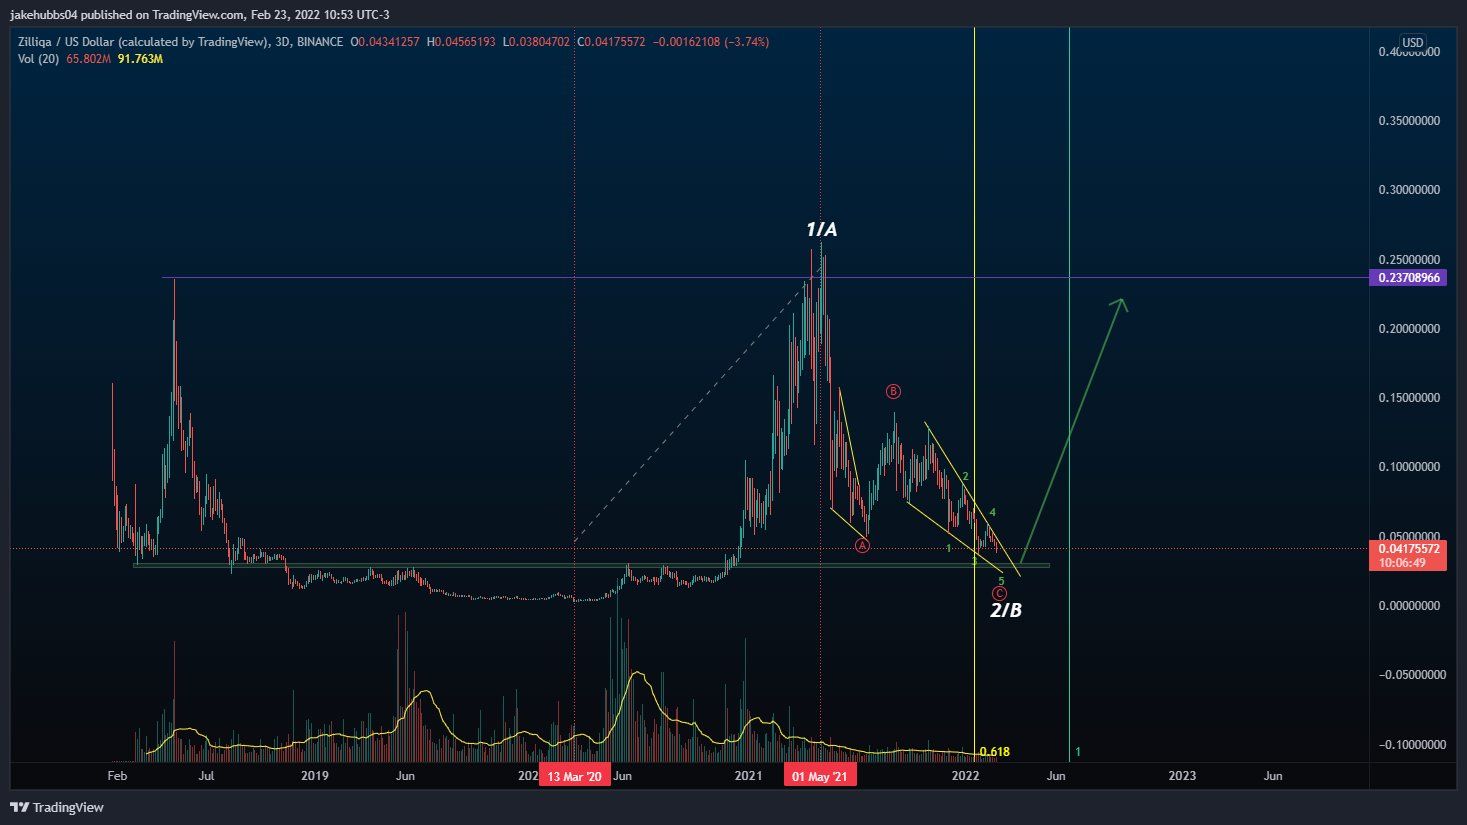
Cryptocurrency trader @Thetradinghubb tweeted a chart of ZIL, stating that the correction could be done near $0.03.
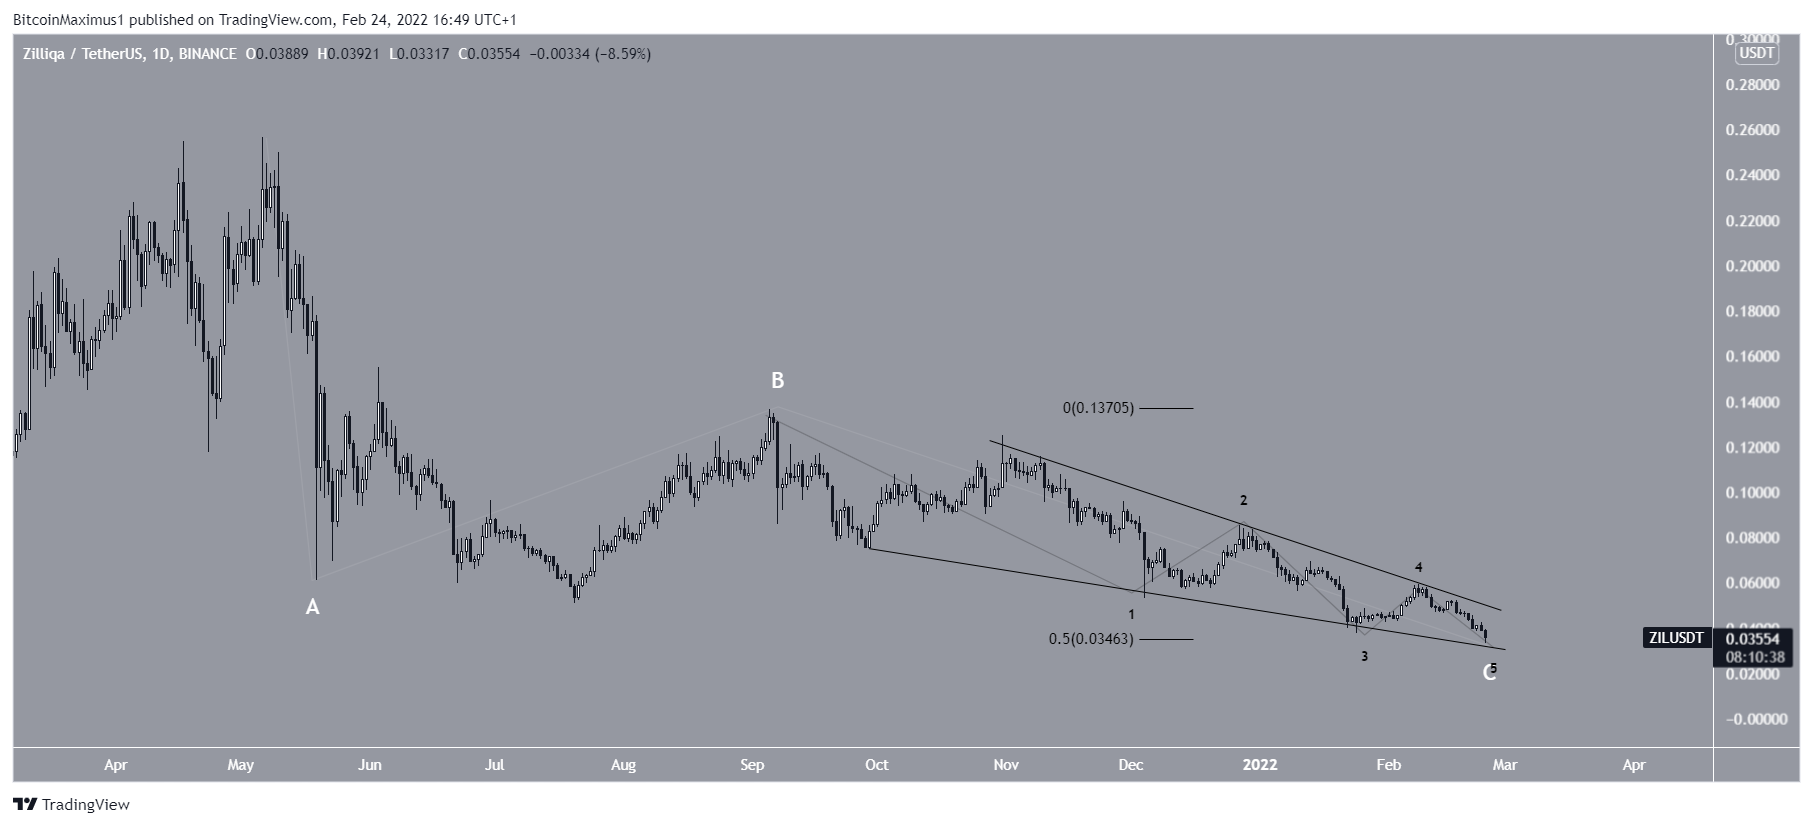
The most likely wave count suggests that ZIL is in the C wave of an A-B-C corrective structure (white). The sub-wave count is given in black.
So far, waves A:C have had a 1:0.5 ratio, and the latter has developed into an ending diagonal. Such patterns are usually followed by a significant movement in the other direction.
When combined with the bullish divergences, this indicates that an eventual breakout from the wedge is likely.
For BeInCrypto’s latest Bitcoin (BTC) analysis, click here.
What do you think about this subject? Write to us and tell us!


