


Ziliqa (ZIL) has been moving upwards since Feb 24. The March 12 breakout might have signaled that the entire correction since last May has come to an end.
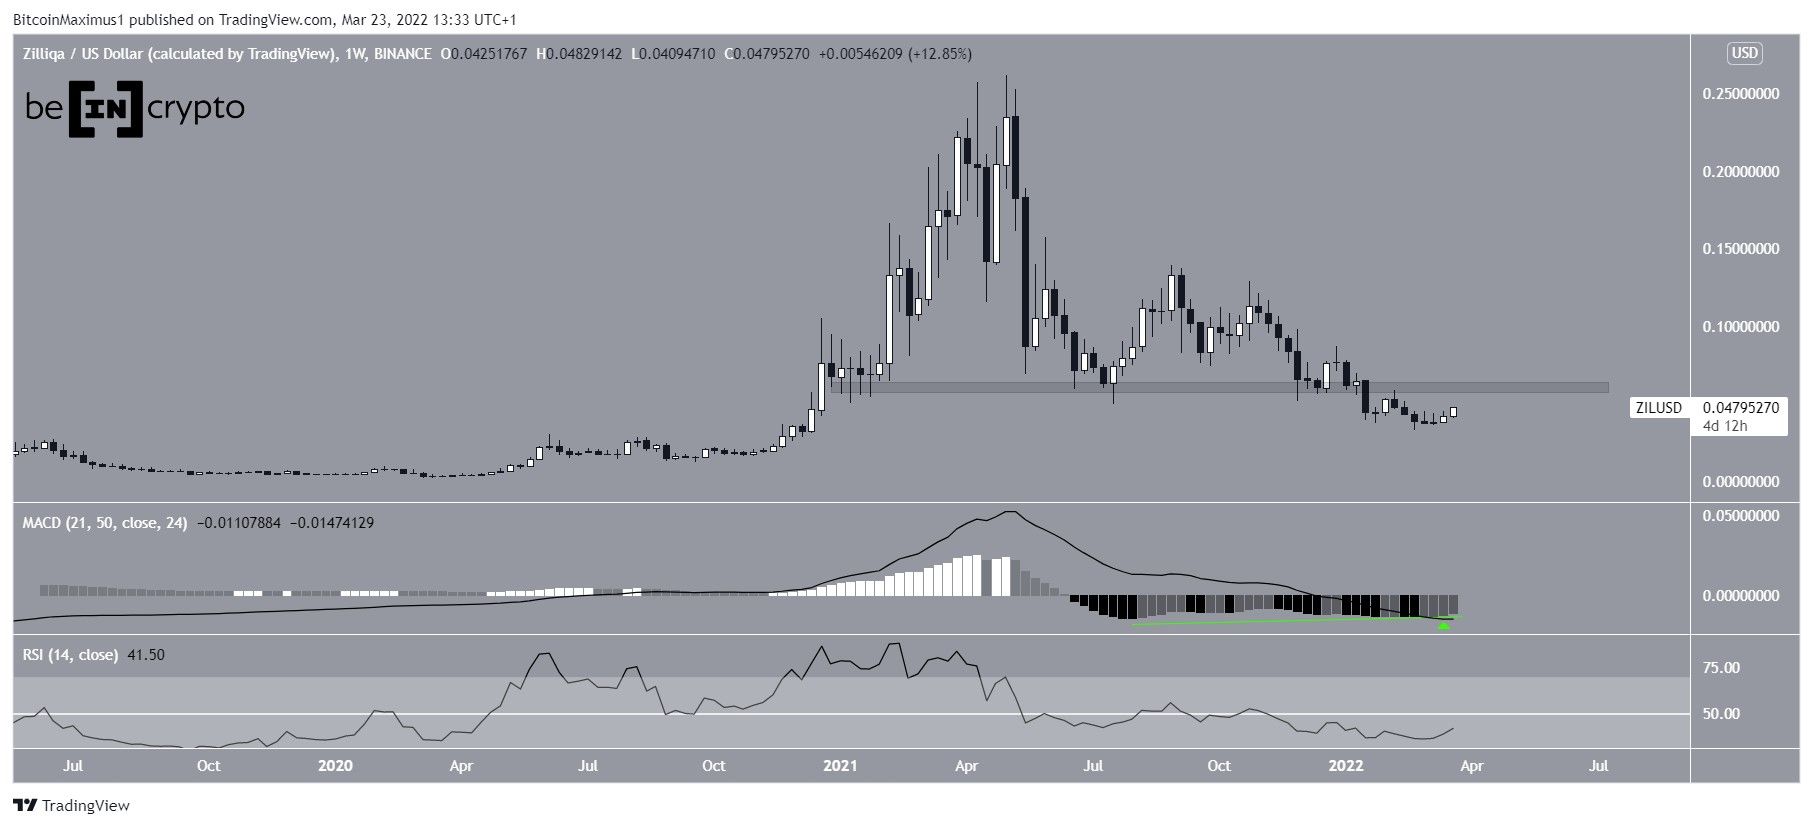
ZIL has been decreasing since reaching a high of $0.262 on May 6.
In the weekly time-frame, technical indicators are still bearish though they are showing signs of a potential bullish reversal. This is especially visible in the bullish divergence of the MACD histogram (green line) and the consecutive higher momentum bars (green icon).
However, the RSI has not yet begun to move upwards and it is still below 50. A movement above this line would be required in order for the trend to be considered bullish.
In order for this to occur, ZIL would also have to break out above the $0.062 resistance area.
Future ZIL movement
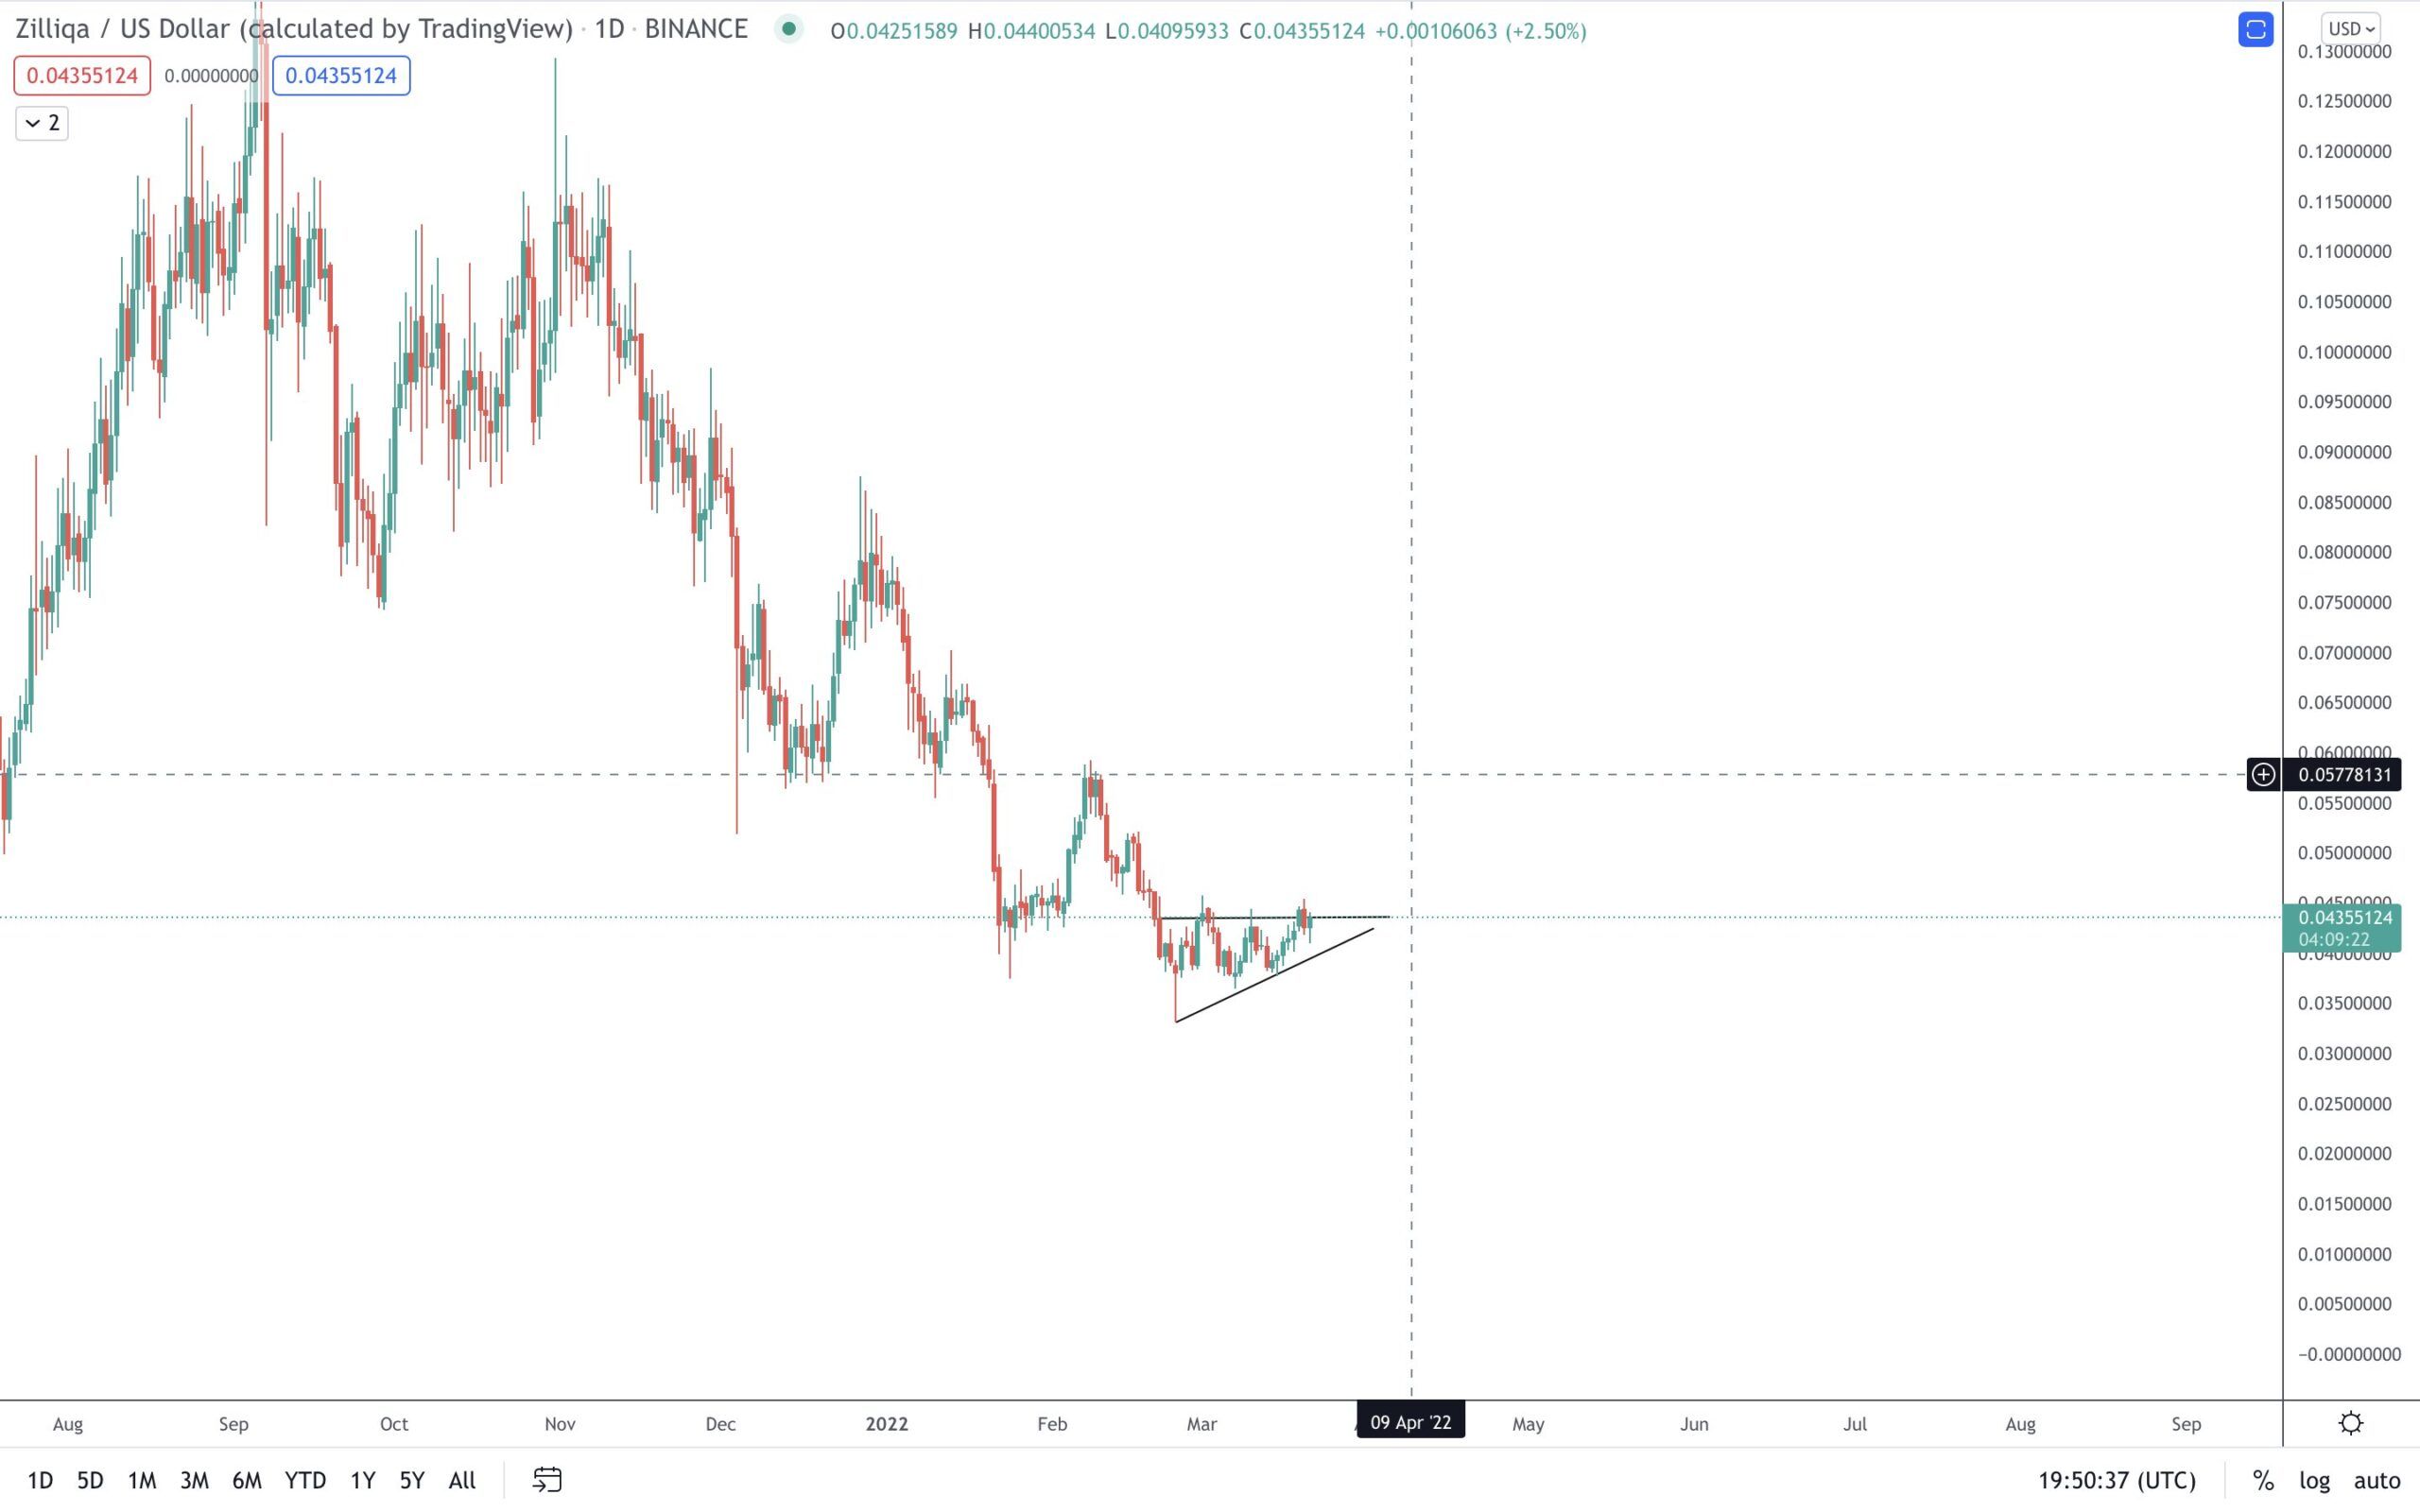
Cryptocurrency trader @Thecryptomist tweeted a chart of ZIL, stating that the price could increase all the way to $0.057.
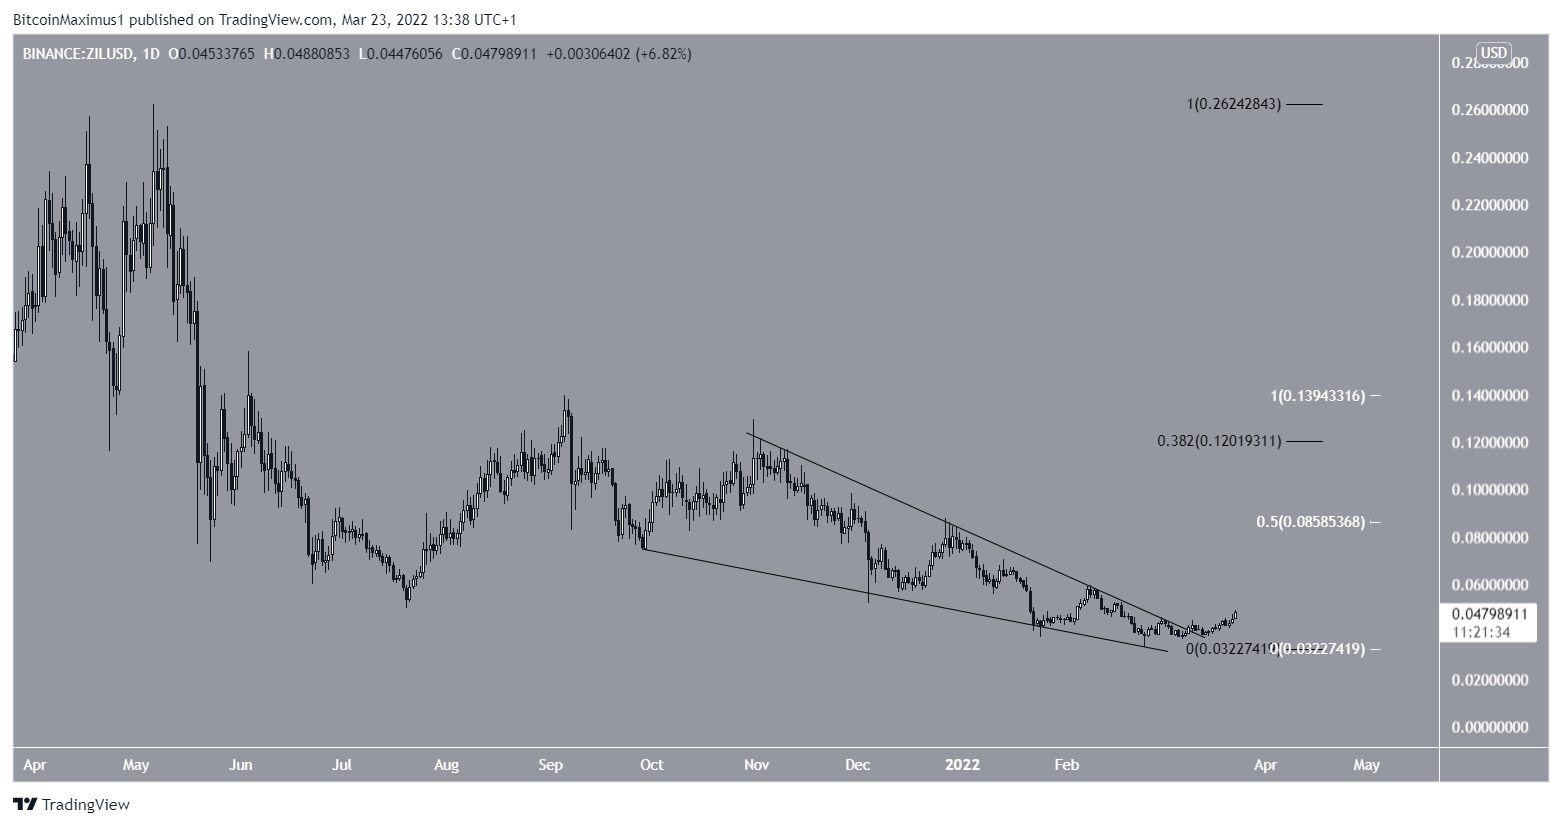
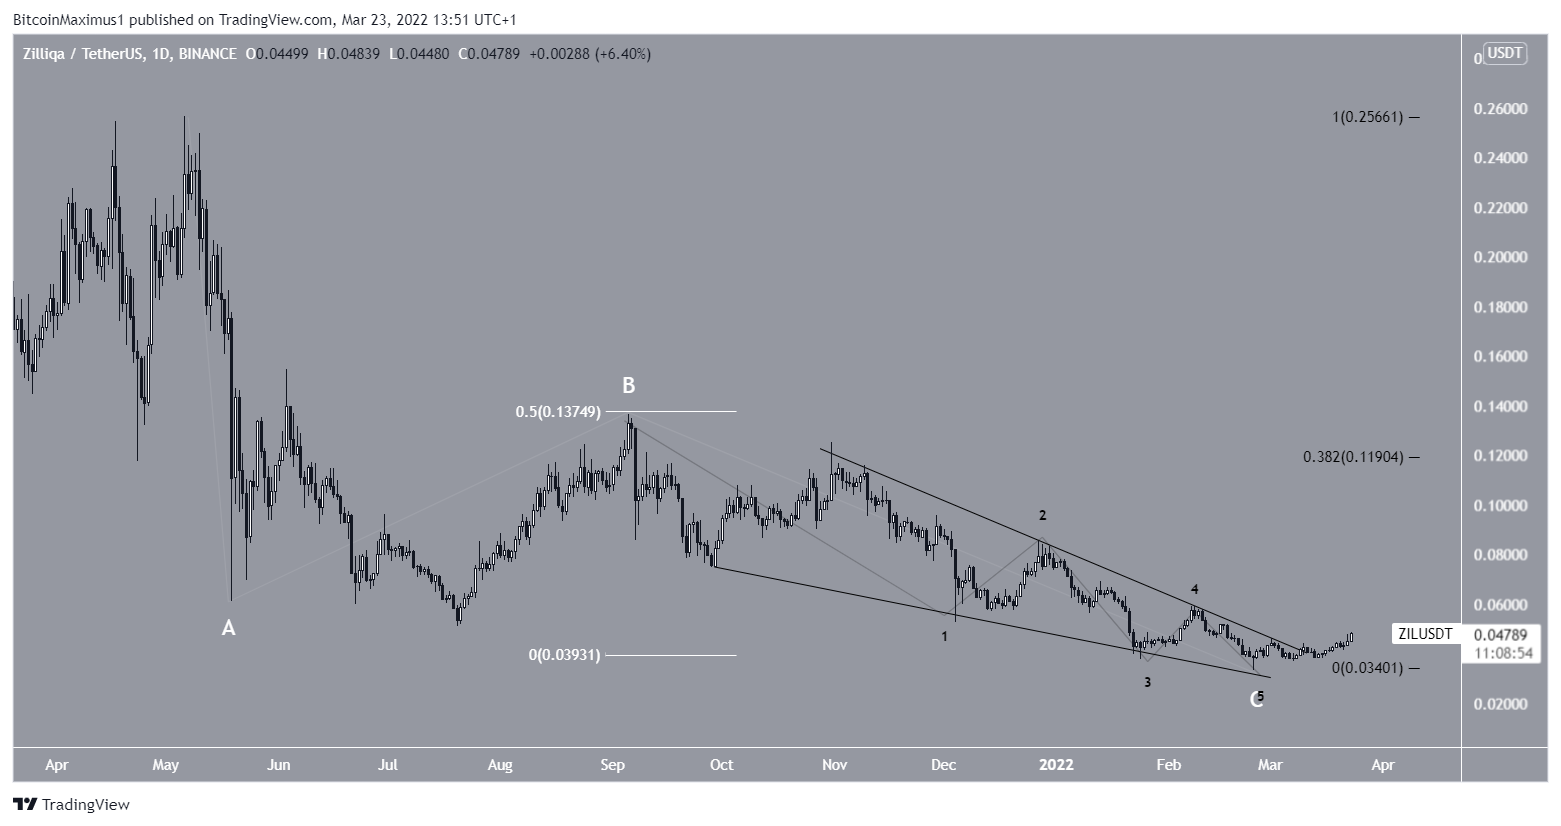
The daily time-frame supports the continuation of the upward movement, since it shows that ZIL has broken out from a descending wedge. The descending wedge is considered a bullish pattern, meaning that it leads to breakout the majority of the time.
If the ZIL upward movement continues, the two closest resistance areas are at $0.086 and $0.012. The former is the 0.5 fib retracement level (white) of the most recent portion of the drop. It is also a horizontal resistance area. The latter is the 0.382 fib retracement level of the entire decrease since the May 2021 highs. It also coincides with the beginning of the descending wedge.
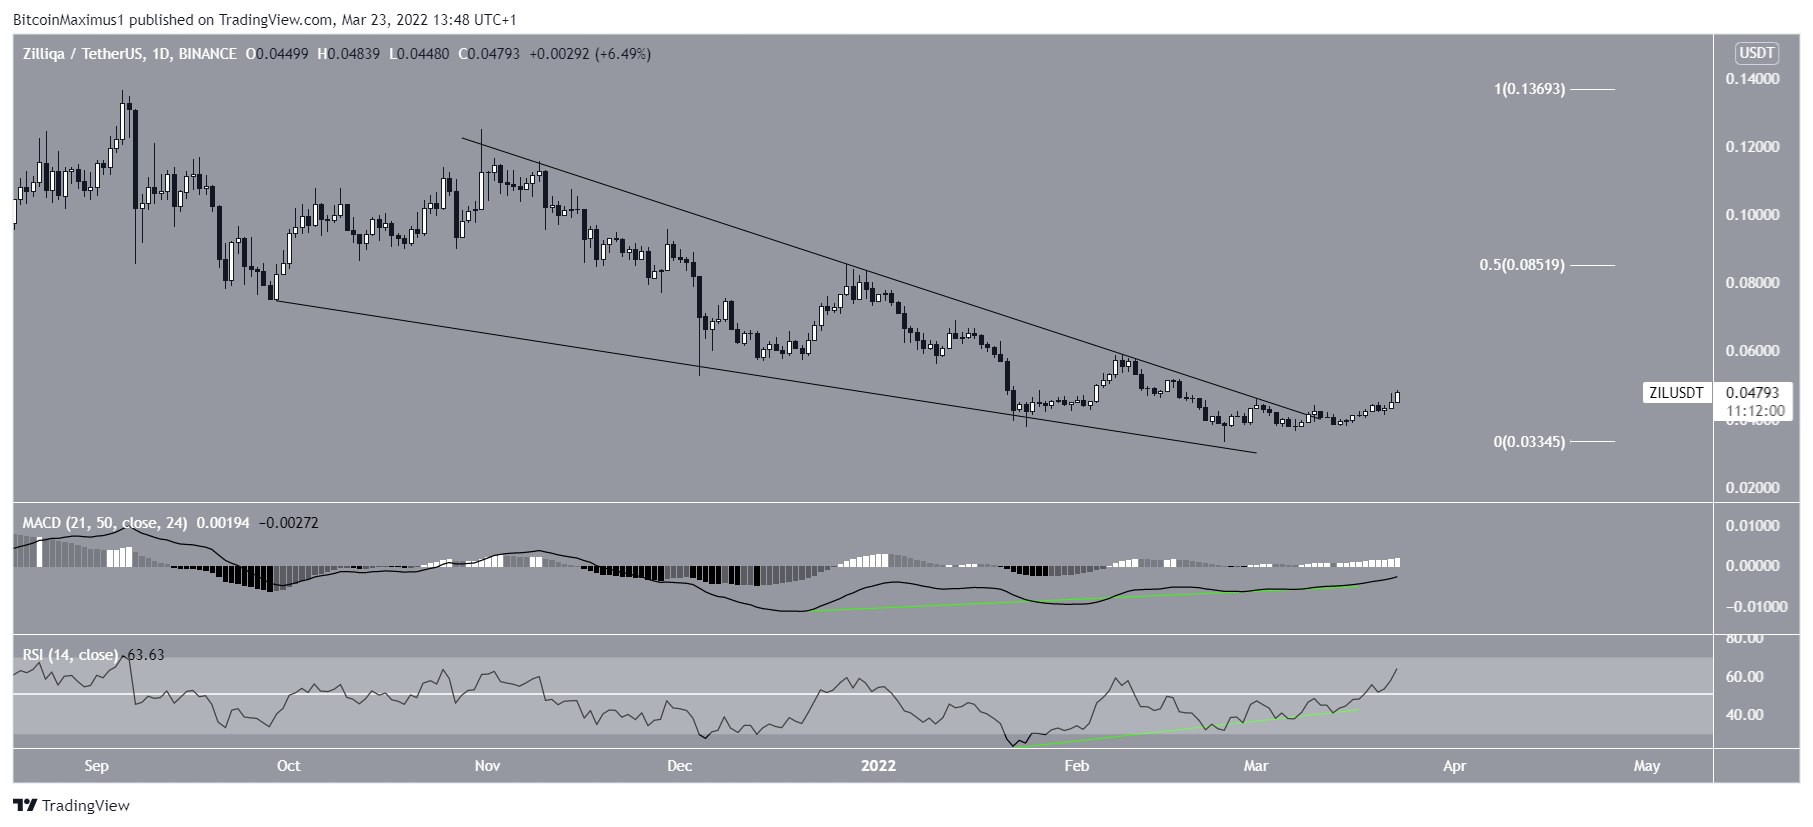
The upward movement is also supported by technical indicator readings. This is visible by the bullish divergences that have developed in both the RSI and MACD (green lines). Furthermore, the RSI has moved above 50 and above the high between the divergences, successfully completing a failure swing top. This is a bullish sign that is associated with upward trends.
Therefore, the daily time-frame readings for ZIL suggest that the upward movement is expected to continue.
Wave count analysis
The most likely wave count suggests that ZIL has completed an A-B-C corrective structure (white) when measuring from the aforementioned May high.
In it, waves A:C have had an exactly 1:0.5 ratio, which is relatively common in such structures.
Wave C developed into an ending diagonal, as evidenced by the wedge shape. Such formations are usually retraced swiftly.
Therefore, if the count is correct, an increase towards at least $0.12 would be expected.
For BeInCrypto’s latest Bitcoin (BTC) analysis, click here


