


The Zilliqa (ZIL) price has been moving downwards since reaching a high of $0.10 on Dec. 27, 2020, its highest price in more than two years.
Both the ZIL/USD and ZIL/BTC pairs should break out from their current resistance areas and move towards the targets given below.
Long-Term Resistance
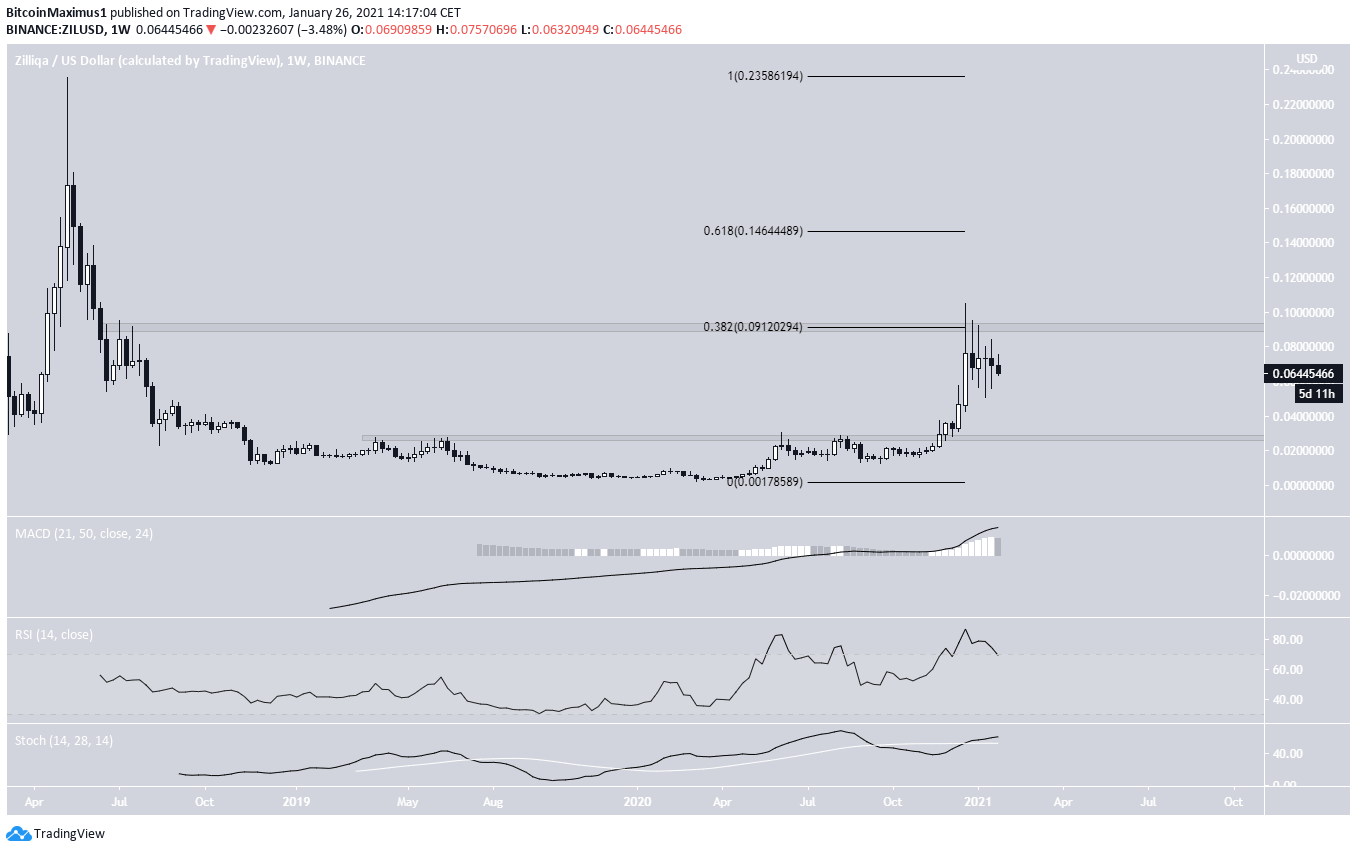
In November 2020, ZIL managed to break out from the $0.0275 resistance area, which had been in place since April of the same year.
Afterward, it moved upwards at an accelerated rate and reached a high of $0.10 on Dec. 27. However, it was rejected and has been declining since. The rejection occurred right at the 0.382 Fib retracement level of the entire downward move measuring from the all-time high.
Despite this rejection, technical indicators on the weekly time-frame are still bullish, making it likely that ZIL is still in a long-term upward trend. If it breaks out, the next resistance area would be near $0.145, the 0.618 Fib retracement of the same downward move.
Future Movement
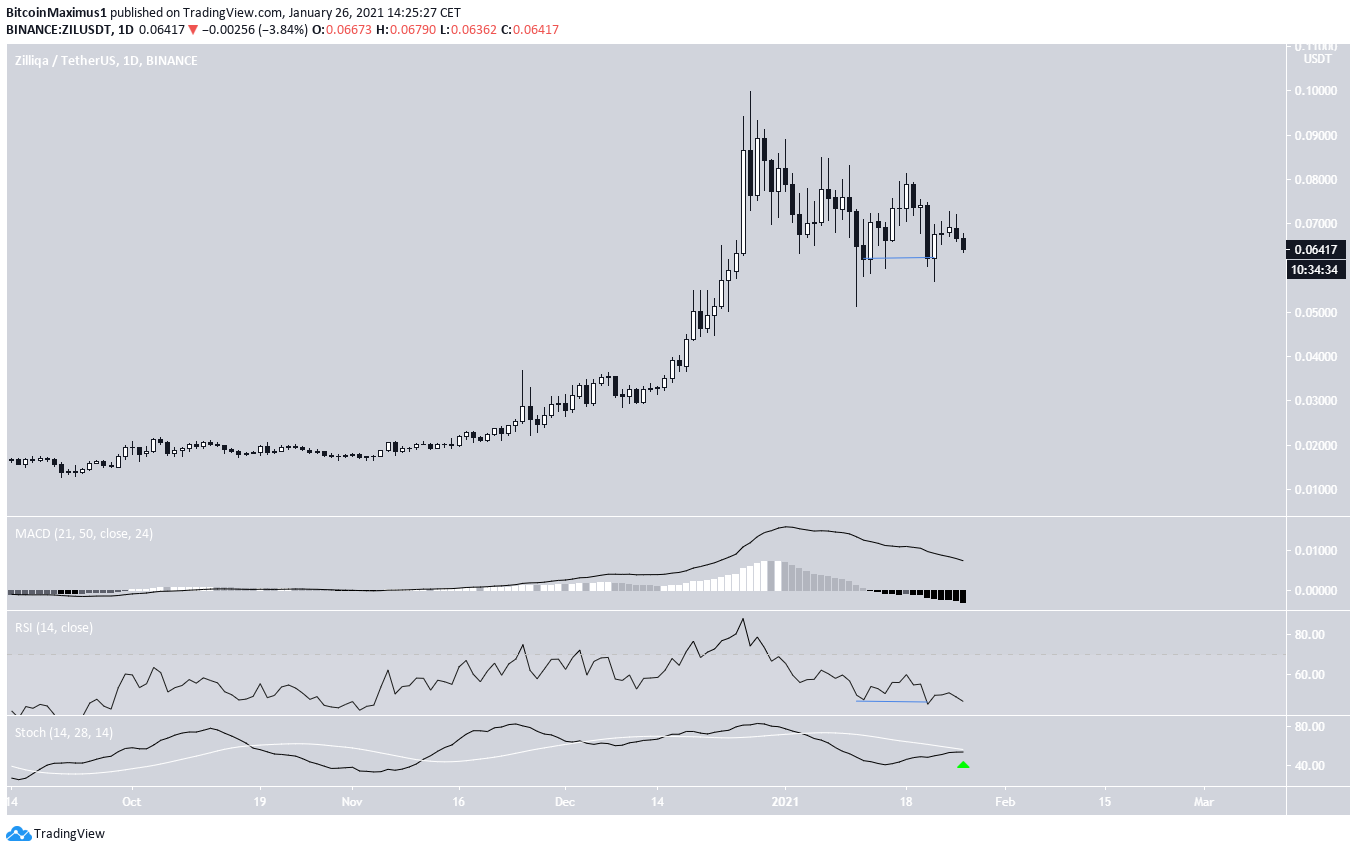
The daily chart shows that ZIL has made what resembles a double bottom pattern. There is also a hidden bullish divergence in the RSI. However, there is no clear support below the current price since the rally nearly turned parabolic before this.
While the MACD is bearish, the Stochastic Oscillator has just made a bullish cross, providing ambiguous signs.
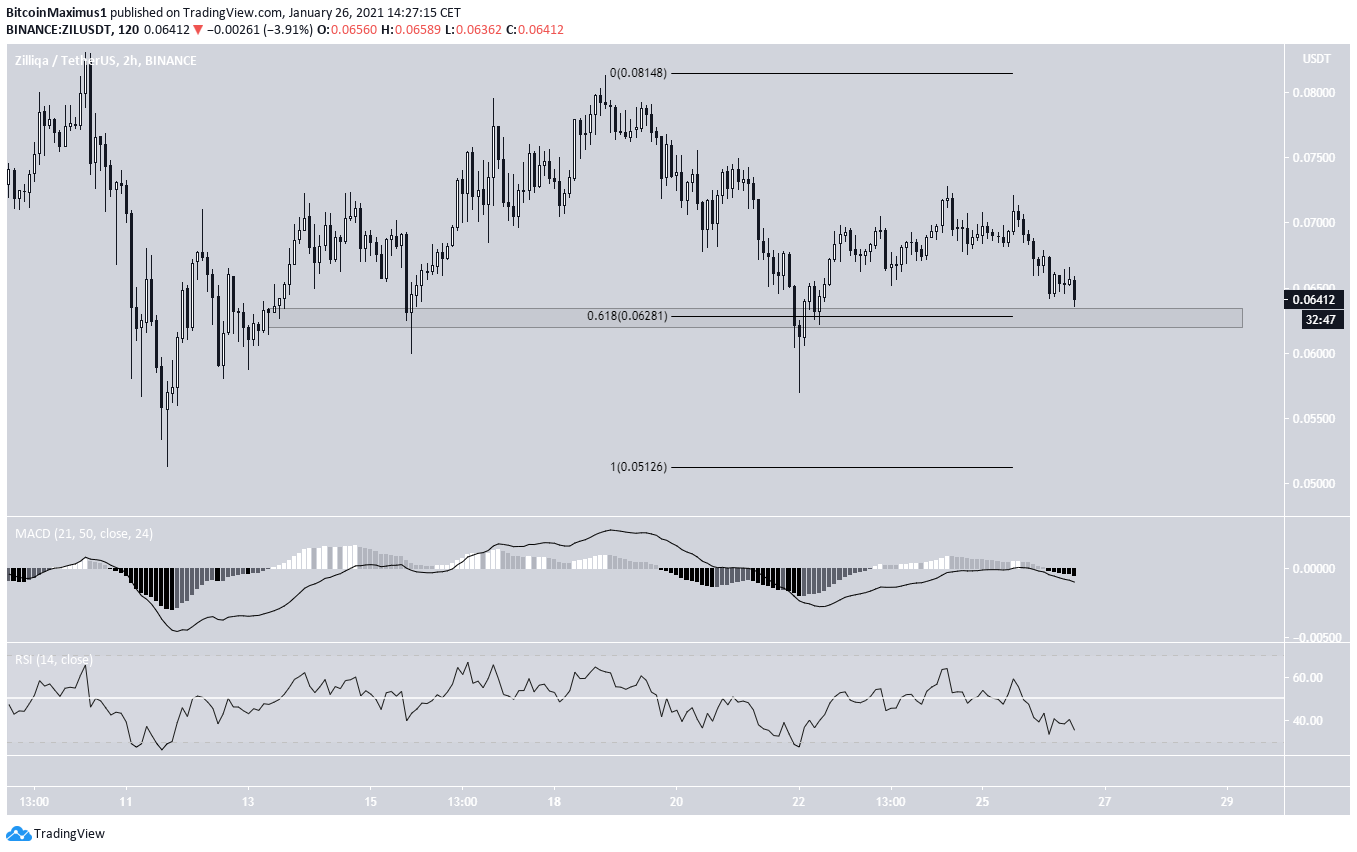
The shorter-term two-hour chart shows that ZIL has nearly reached the 0.618 Fib retracement support at $0.062, which could initiate a trend reversal. However, technical indicators do not yet show any bullish reversal signs.
Nevertheless, if ZIL manages to hold on above this area, an upward move would likely occur due to the hidden bullish divergence on the daily time-frame.
ZIL/ BTC
Cryptocurrency trader @altsq outlined a ZIL chart, stating that it’s likely to attempt a breakout above the current resistance area.
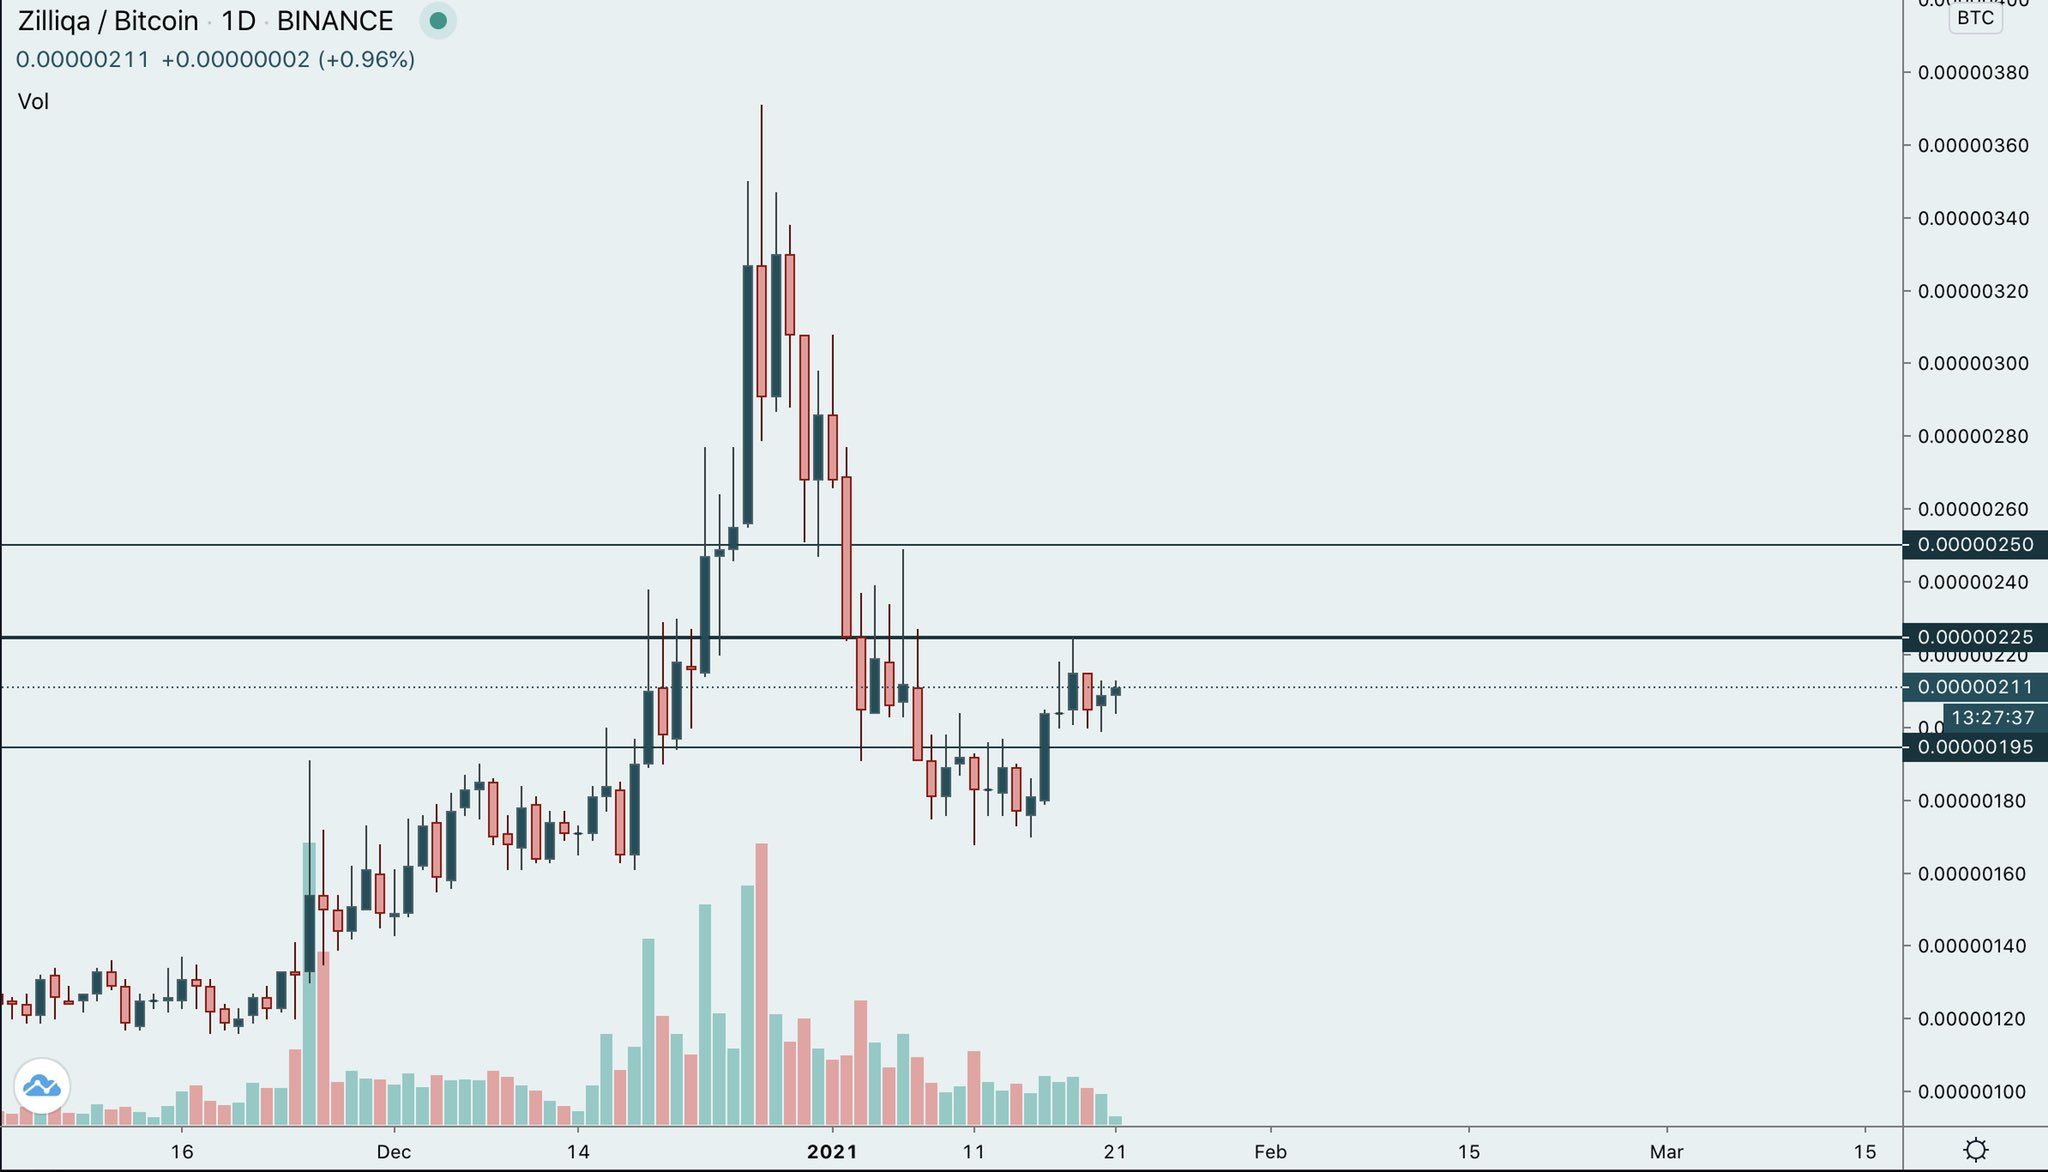
The previous resistance area is at 222 satoshis, and ZIL has been rejected since this tweet.
Nonetheless, it is following an ascending support line and technical indicators are also bullish, so a breakout is likely.
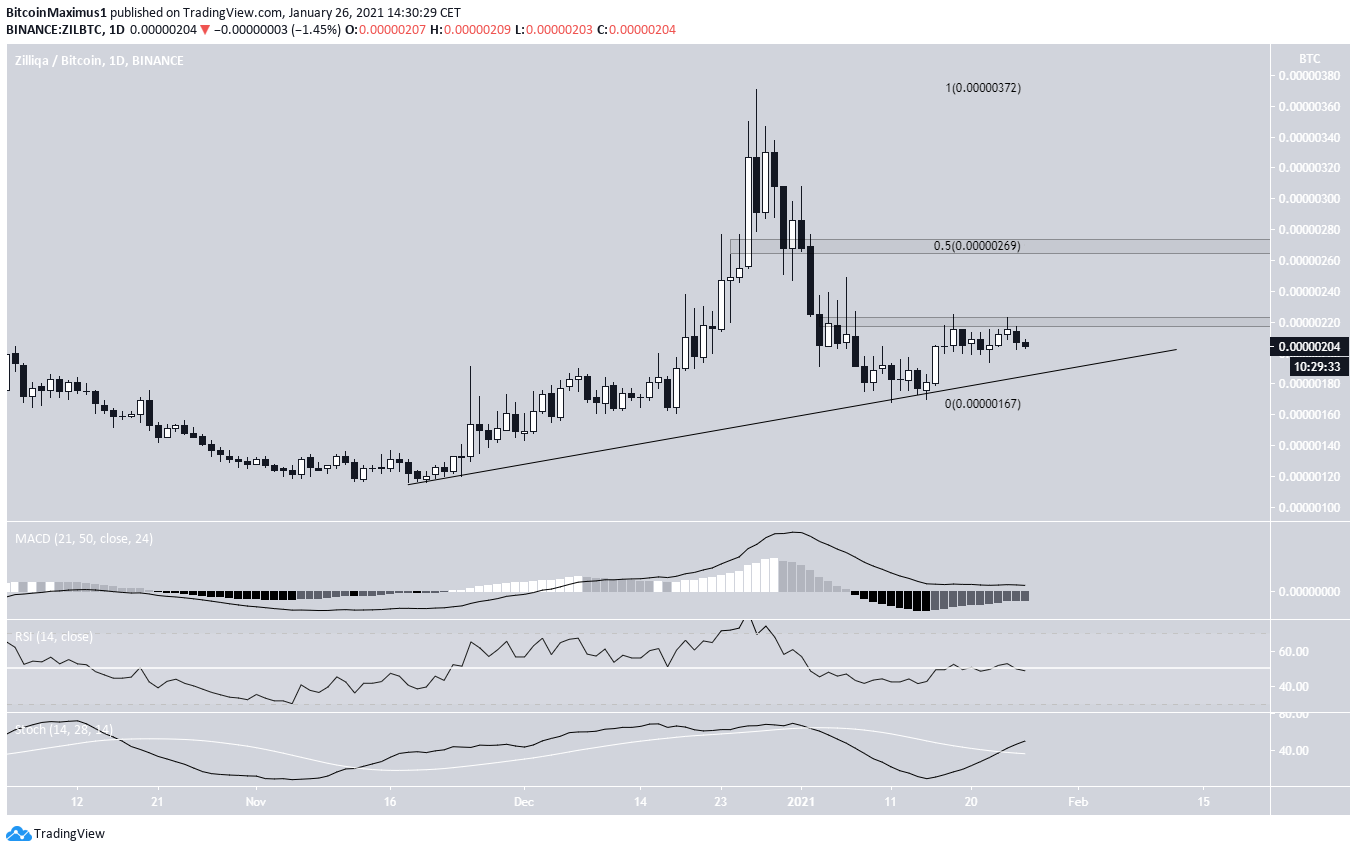
If one occurs, the next closest resistance area would be at 270 satoshis, the 0.5 Fib retracement level of the downward move, and a horizontal resistance area.
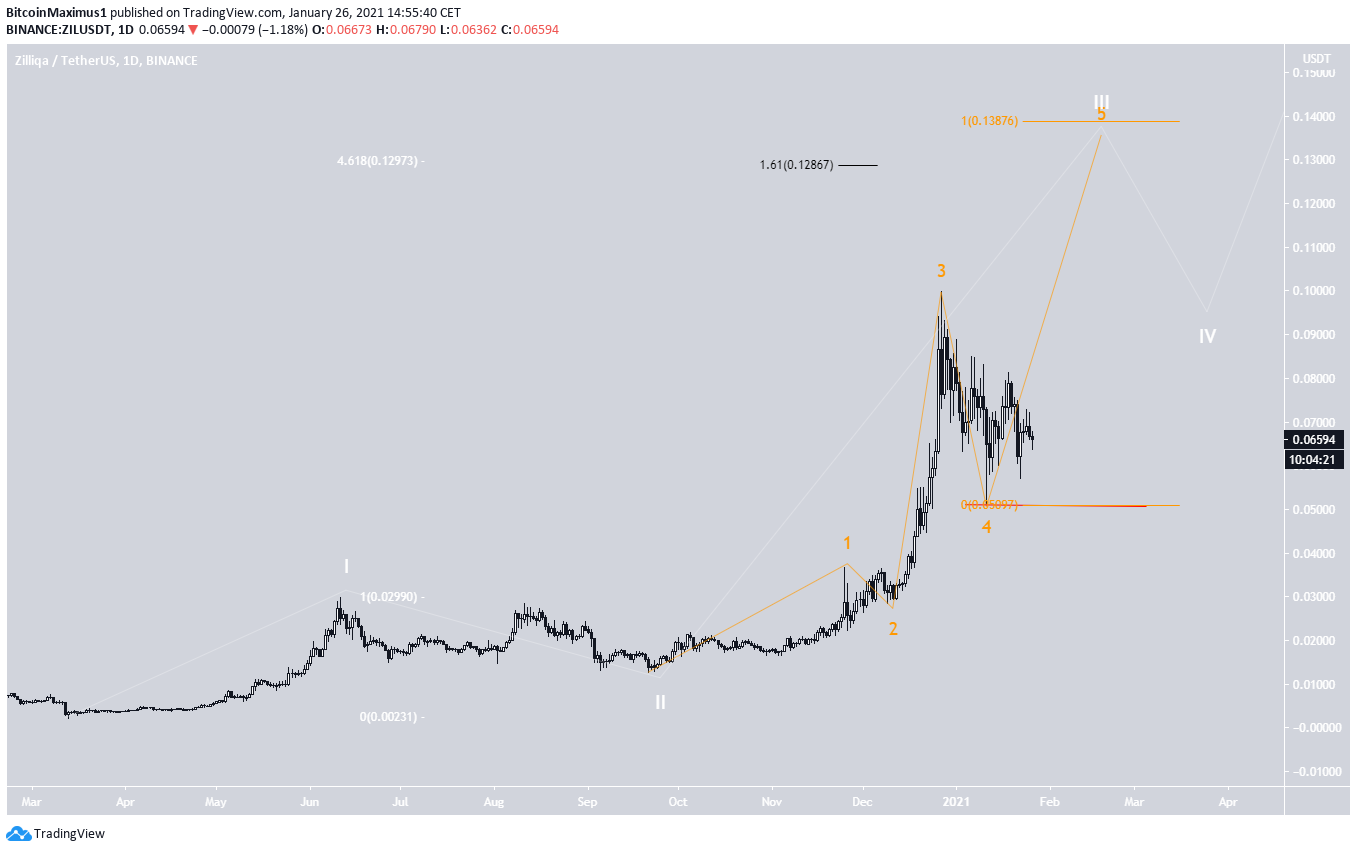
ZIL’s Wave Count
The wave count indicates that ZIL has begun a long-term bullish impulse after its March low. The breakout above the previous $0.028 resistance area marks the end of wave 1 (shown in white below).
Currently, it seems that ZIL is in an extended wave 3, while the sub-wave count is shown in orange. ZIL is likely in the fifth and final sub-wave of wave 3.
A likely target for the top of this move is near $0.128, while a possible but less likely one is $0.138. Both these targets are found using a combination of Fib extensions, projections, and external retracements.
Conclusion
To conclude, if ZIL/USD manages to hold on above the current short-term support area at $0.062, it should initiate a significant upward move towards $0.128.
ZIL/BTC is likely to break out above the current resistance area and gradually move towards 270 satoshis.
For BeInCrypto’s latest Bitcoin (BTC) analysis, click here!


