The Zcash (ZEC) price fell considerably during the week of August 31 – September 7. The drop caused the price to break down below numerous support levels, possibly indicating that the upward move has ended.
Breakdown From Support Line
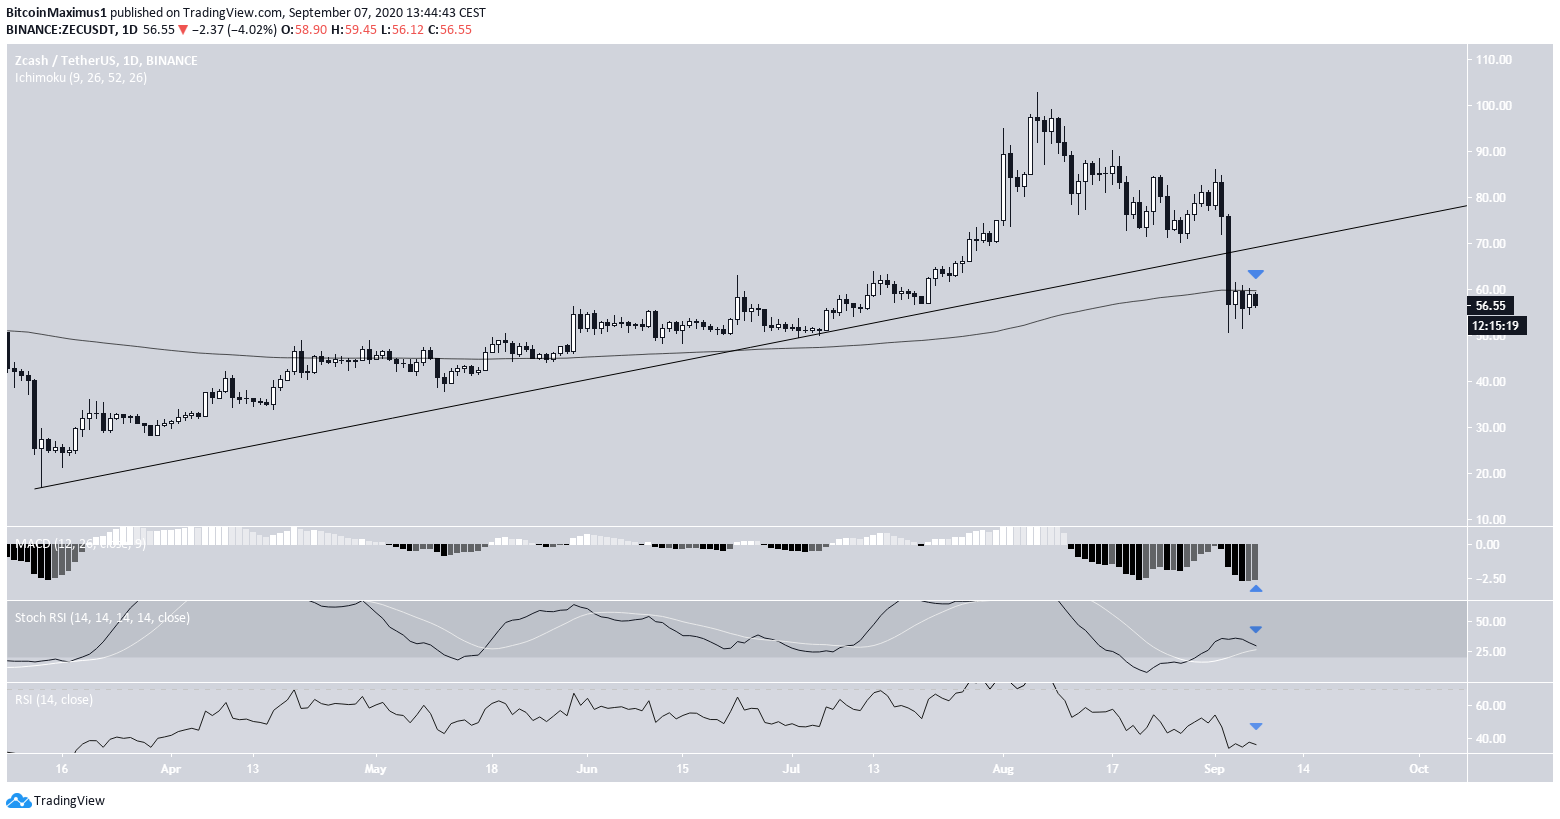
The ZEC price had been following an ascending support line since it reached a bottom on March 13. Last week’s decline caused a breakdown from this support line, possibly signaling that the upward move from the previous bottom has ended.
Furthermore, the price has broken down from its 200-day moving average (MA) and has validated it as support afterward.
While the MACD has begun to rally, possibly signaling a bullish reversal, there is a bearish cross that has just taken place on the stochastic RSI. The RSI is also falling without forming any bullish divergence.
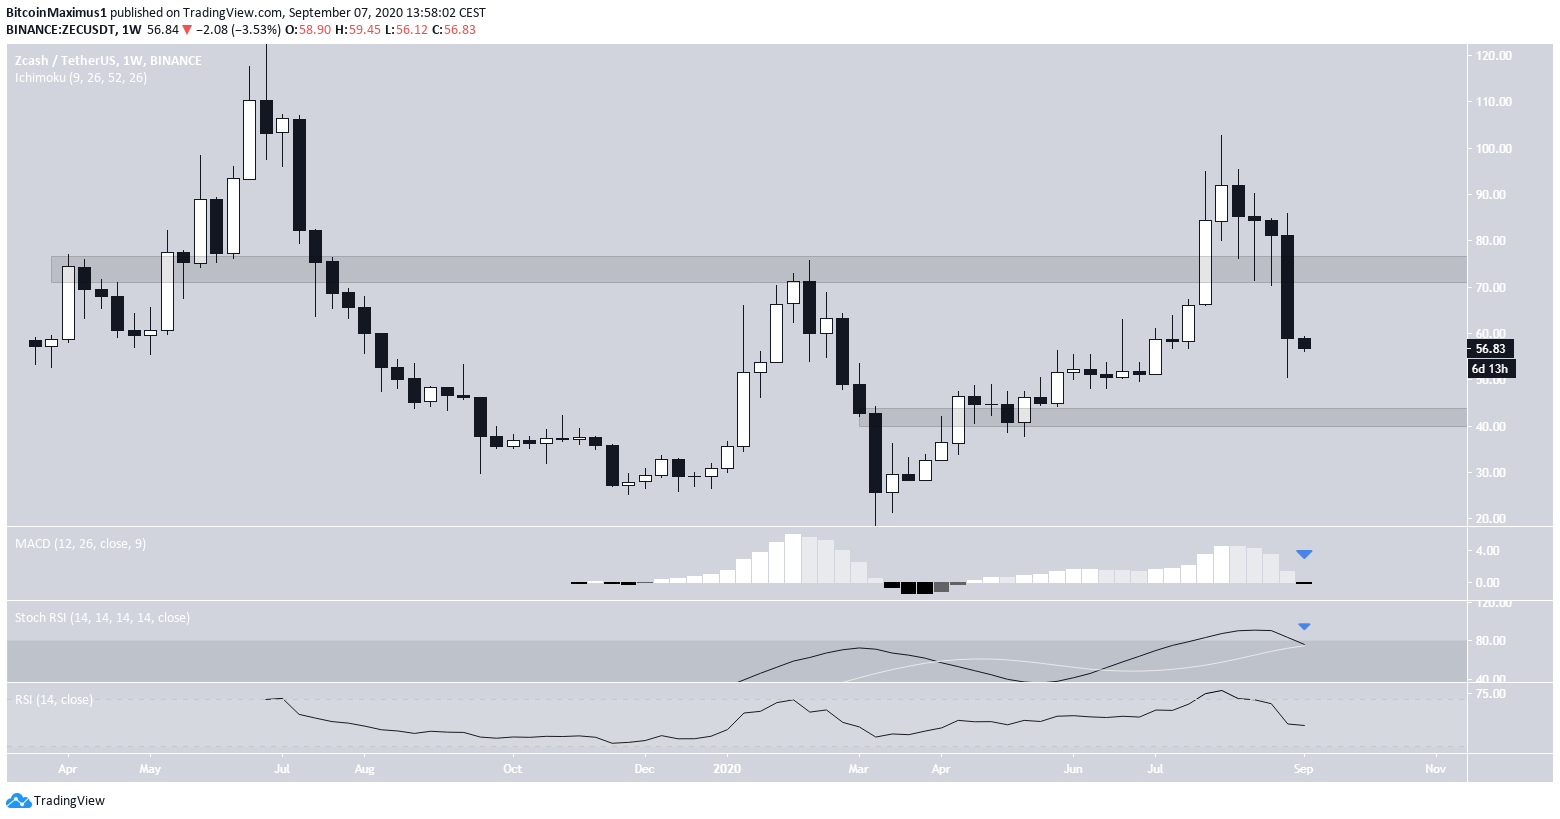
The long-term chart reveals a similarly bearish outlook. The price has fallen below the $75 area, which had previously acted as resistance. This makes the July rally above this area a likely deviation above the range high, which was followed by a rapid decline.
Likewise, technical indicators are bearish. The MACD has crossed into negative territory, the stochastic RSI is in the process of making a bearish cross, and the RSI is decreasing.
The closest support area is found at $45.
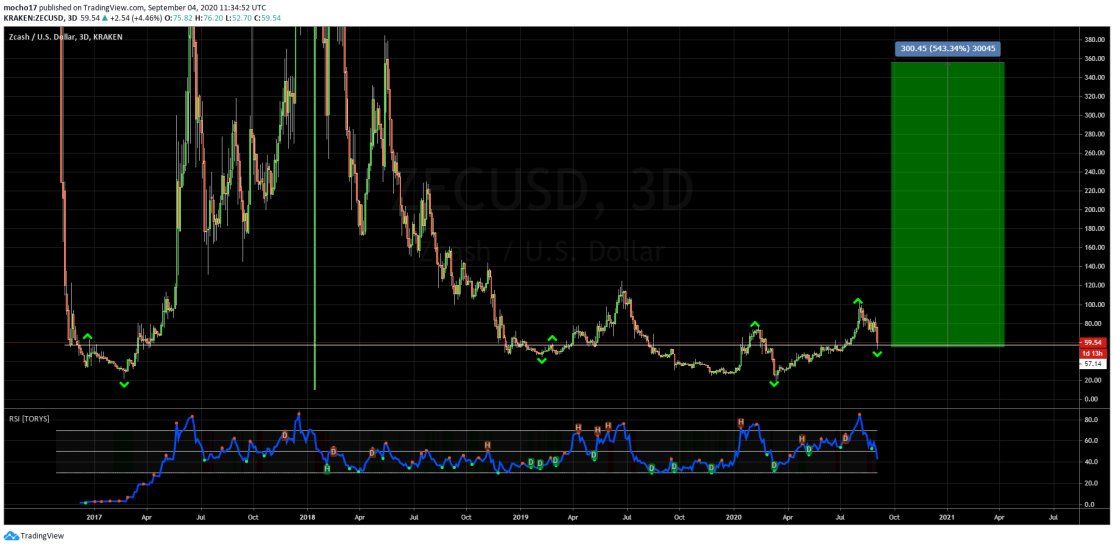
Cryptocurrency trader @CryptoMocho outlined a ZEC chart, stating that the price is going to rise by a massive 550%. Due to the bearish indications outlined above, it seems unlikely that this will occur in the near future.
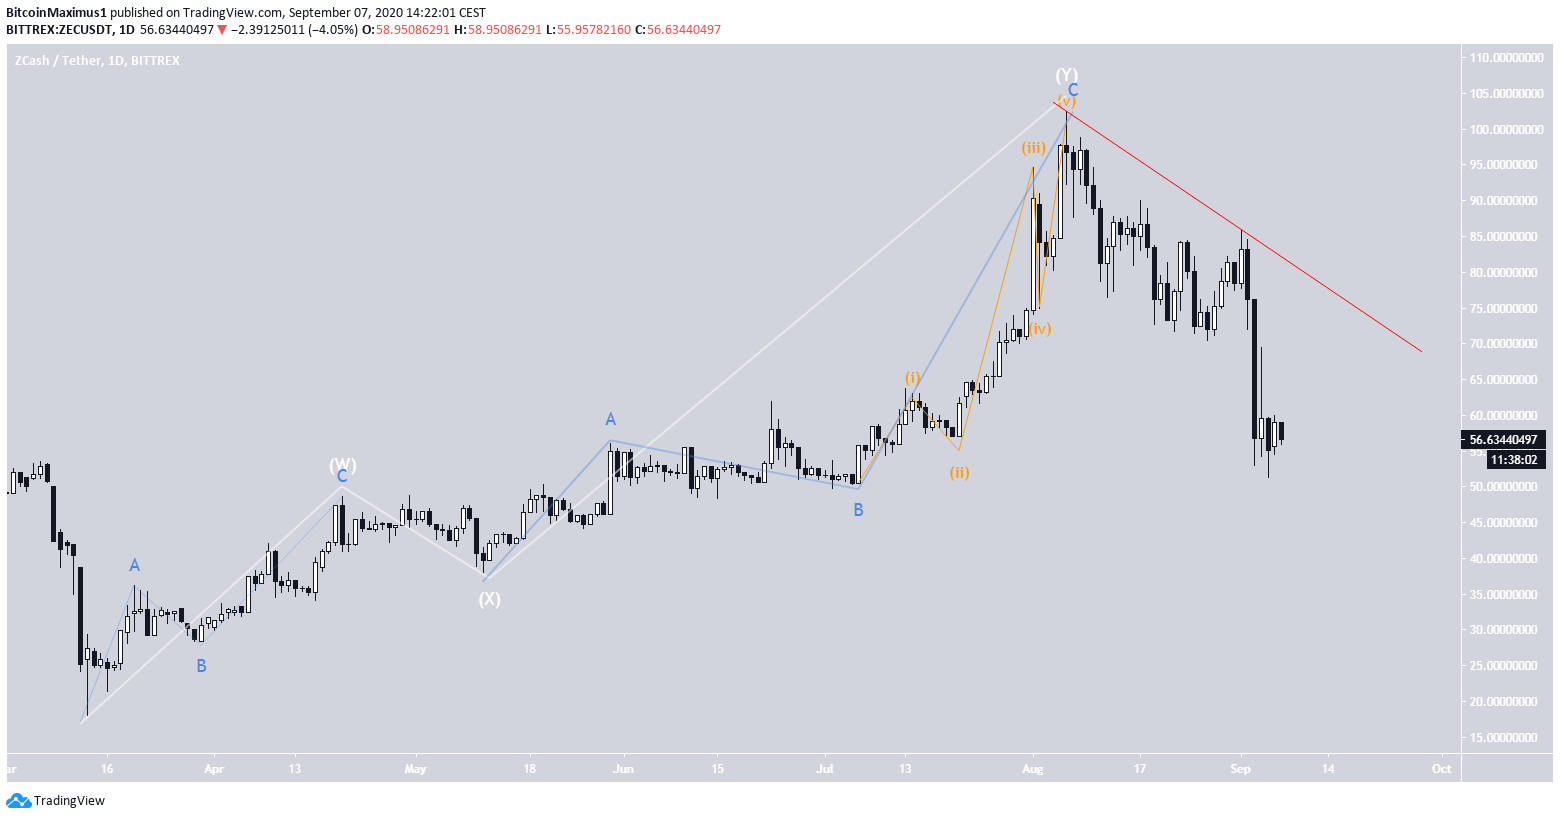
ZEC Wave Count
Beginning on March 13, the ZEC price has been moving upwards. However, the movement since the lows appears corrective rather than impulsive. Furthermore, the decrease that took place last week has invalidated the majority of the bullish formations.
It’s possible that the price has completed a W-X-Y correction (white) and has now begun a downward move.
A breakout above the descending resistance line (red) would invalidate this bearish hypothesis and indicate that the price will head higher. However, due to the frequent overlap, ZEC is likely to continue lower eventually.