


On June 1, the Zcash price (ZEC) reached an hourly high of $92.29. A rapid decrease ensued and the price made a low of $75.38 on June 5. A gradual increase was followed by a decrease. The price reached the same levels on June 10.
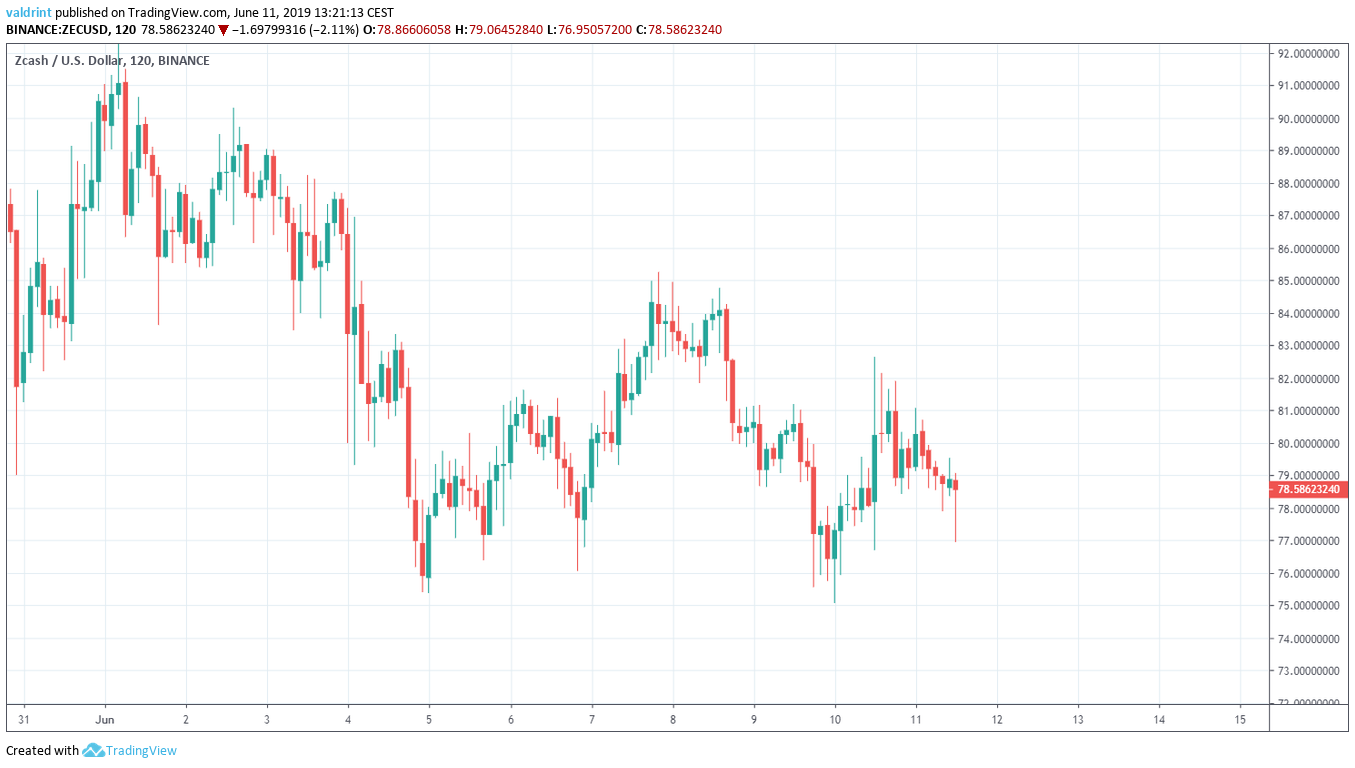
Since then, the price has been gradually increasing.
Below we are going to analyze the Zcash price (ZEC) in different time-frames alongside technical indicators and try to predict its future movement. (For our previous analysis, click here)
Zcash Price (ZEC): Trends and Highlights for June 11, 2019
- ZEC/USD reached a high on June 1.
- It is trading inside a descending triangle.
- The 10- and 20-day moving averages have made a bearish cross.
- There is resistance near $87.
- There is support near $68.
Descending Triangle
On June 1, the price reached a high of $92.29. A gradual decrease ensued. On June 5, the Zcash (ZEC) price reached a low of $75.3.
Since then, it has been trading inside the descending triangle outlined below:
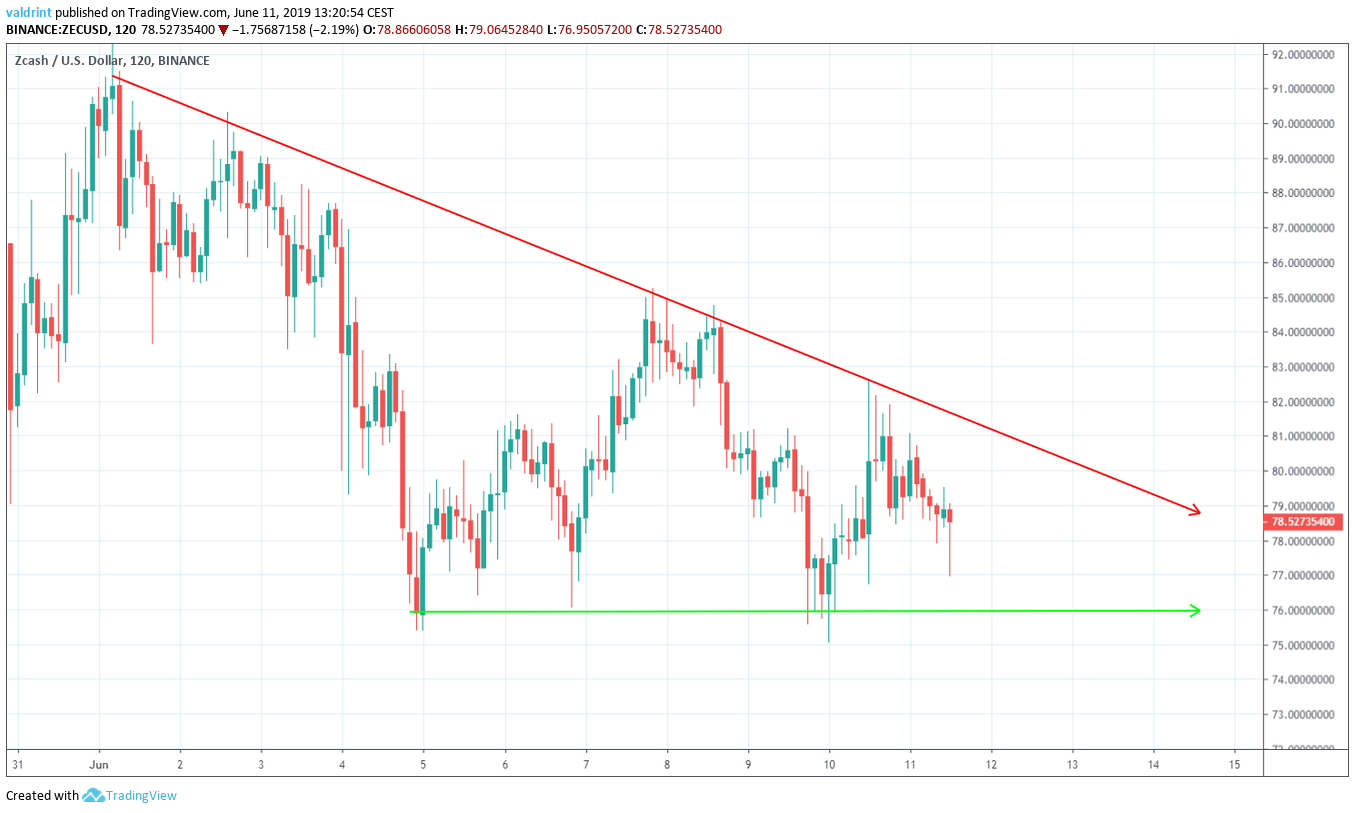
On June 10, the Zcash price (ZEC) was rejected by the resistance line of the triangle and began to decrease. At the time of writing, it was on its way towards the support line.
Will it break down from the triangle? A look at technical indicators is required in order to answer this question.
Zcash Price (ZEC): Technical Indicators
The Zcash price is analyzed alongside the 10- and 20-day moving averages (MA) below:
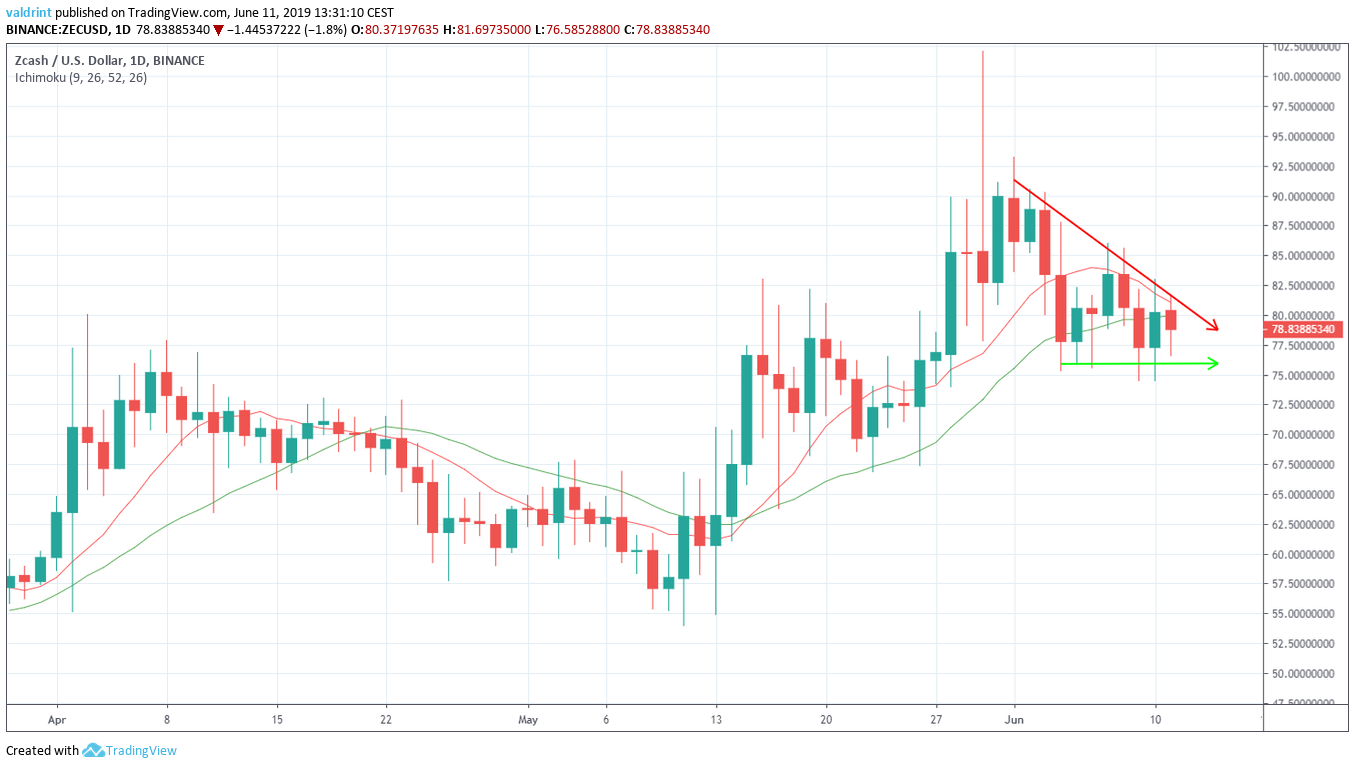
At the time of writing, the price was trading below both MAs. Furthermore, they are very close to making a bearish cross. This often indicates that a downtrend has begun.
Will this cause the price to break down from the triangle?
If the Zcash price (ZEC) response is similar to the previous time this occurred, then a breakdown is likely.
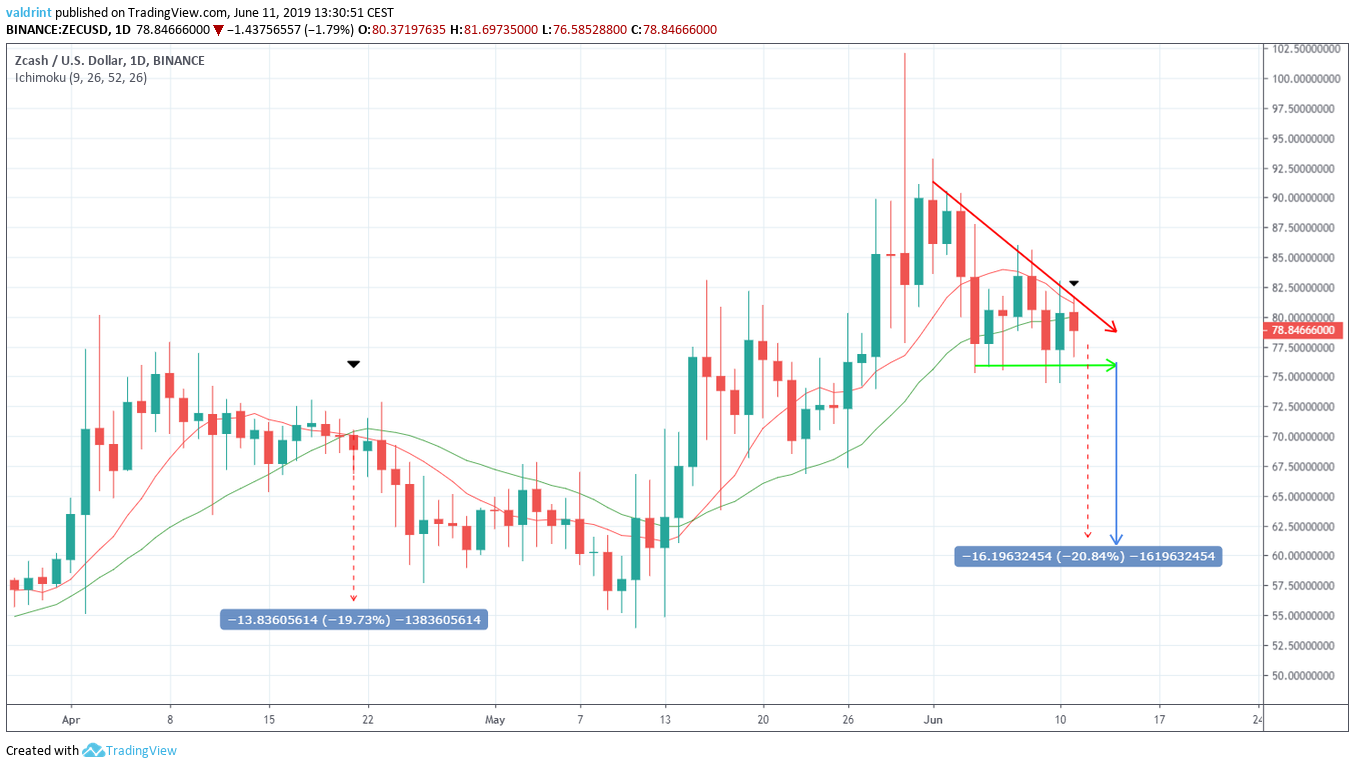
On June 21, the same MAs made a bearish cross. A 20% price decrease in a span of 21 days followed.
If the same were to occur, we would have prices close to $60 in the beginning of July. Interestingly, the same target is given by the descending triangle.
The blue line outlined above is the height of the triangle projected from the breakdown point at the support line. It also gives a target of $60.
Even if this breakdown occurs, the Zcash price (ZEC) is unlikely to follow a straight line to $60.
Let’s look at some support areas between the current and the target prices.
Zcash Price (ZEC): Reversal Areas
One support and one resistance area are traced for ZEC/USD below. If a decisive move occurs, they are likely to provide a reversal.
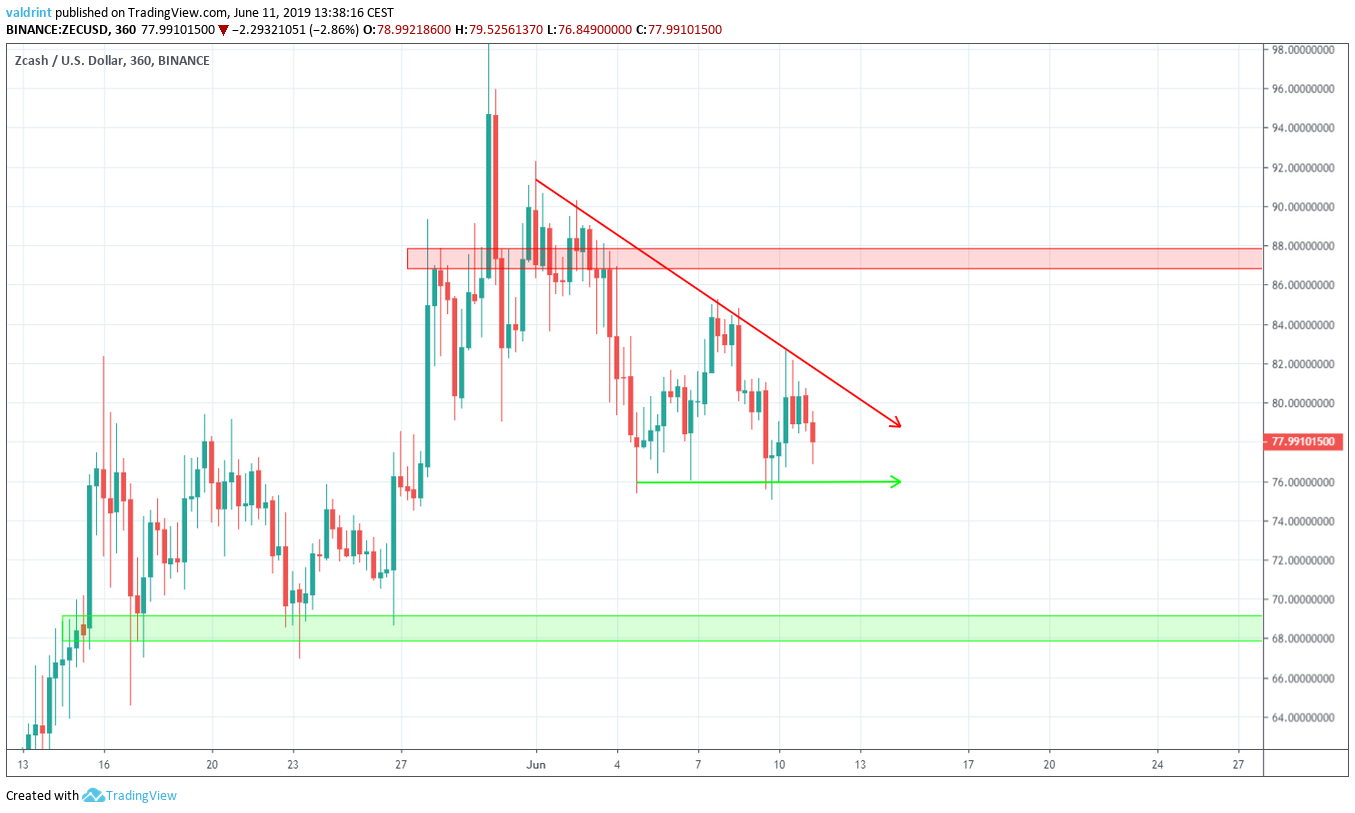
The closest resistance area is found near $87. If the Zcash price (ZEC) breaks out from the triangle, it is likely to provide a reversal. According to the analysis of technical indicators, this is unlikely.
The closest support area is found near $69. If the price breaks down from the triangle, it is likely to provide support and possibly initiate a reversal.
Summary
The Zcash price (ZEC) s trading in a descending triangle. The 10- and 20-day moving averages are very close to making a bearish cross. If the price breaks down from the triangle, it is likely to reach the support area outlined above.
Do you think the price of ZEC will break down from the triangle? Let us know in the comments below.
If you’d like to read the long-term price predictions of Zcash, click on the blue button below:


