


The Bitcoin 50- and 100-week moving averages are in the process of making a bullish cross. In the previous market cycle, this cross led to the all-time high price — as this same cross preceded the entire upward move.
On December 4, the Bitcoin price underwent a very rapid increase, followed by a very rapid decrease. It is possible that this was caused by a massive Tether transfer to the Okex exchange. However, the long-term charts suggest that this could have been a signal that the bottom is in and we will soon begin a new market cycle.
Trader and analyst @davthewave stated that we are currently at a confluence of supports, given by the 1-, 2-, and 3-year moving averages (MA).
And with the 3 year MA.
The 1 year, 2 year, and 3 year coming back into alignment… pic.twitter.com/JfPQdAbS4j
— dave the wave🌊🌓 (@davthewave) December 4, 2019
Looking at the long-term chart, this suggests that a new market cycle will begin soon. Let’s take a closer look at the price and see if that will occur.
For those of you more interested in video analysis, click below:
Moving Average Significance
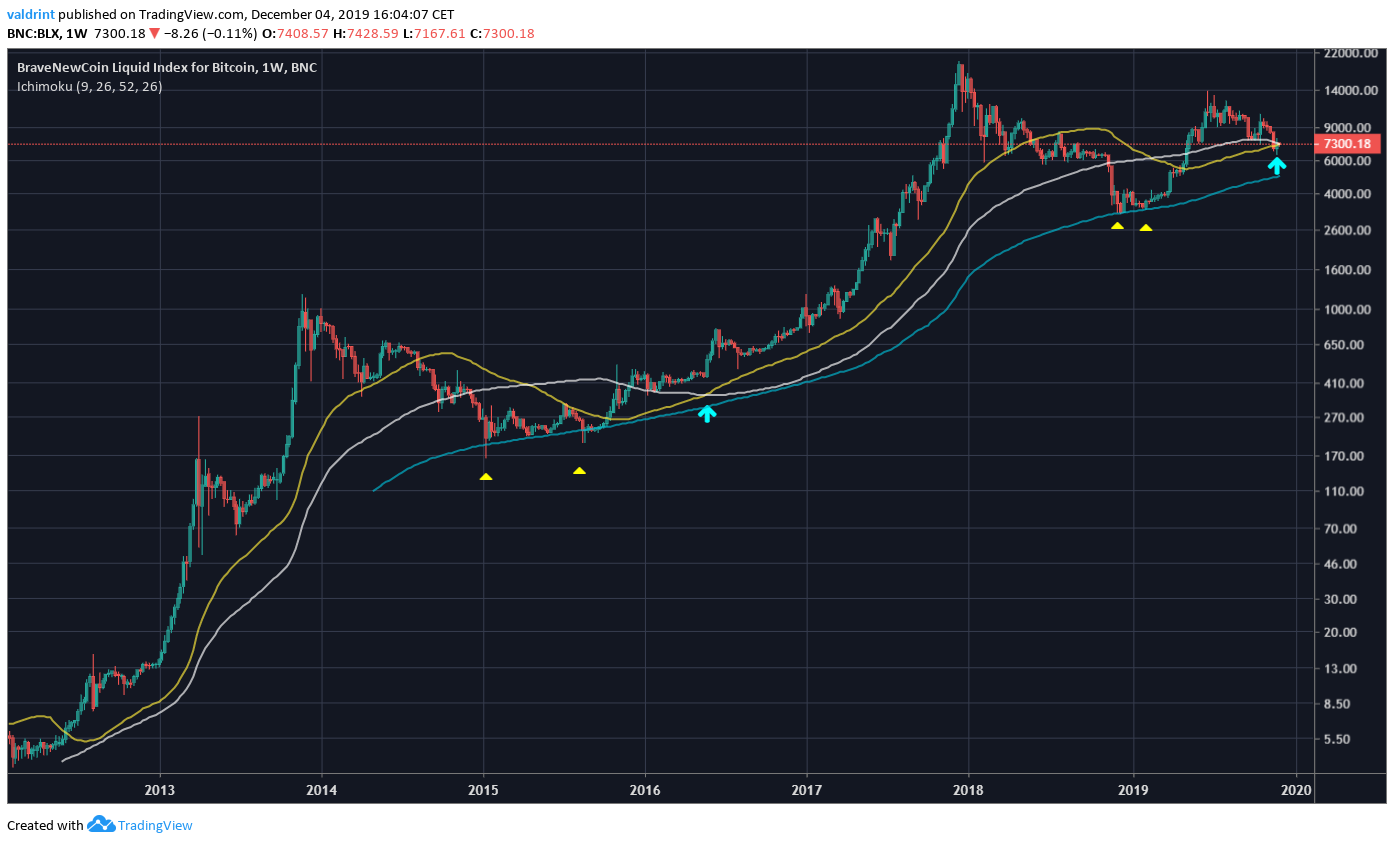
The historical Bitcoin price chart has had an interesting relationship with its moving averages (MAs).
The Bitcoin price has never traded below its 200-week MA (4-year). It bounced on it twice in 2015 before beginning the upward move that led to the all-time high price. Throughout the entire move, the price did not react to the MA afterward.
Similarly, the Bitcoin price bounced twice on the same MA in December 2018/January 2019. Afterward, it began an upward move that led to the $13,764 high.
The Bitcoin price has traded above its 50- and 100-week MAs (1-, 2- year) for most of its history, with the exception of the periods in which it was heading to the bottom. Additionally, sometime after the bounce on the 200-week MA, the 50- and 100-week ones have made a bullish cross. In 2016, this was the catalyst for the upward move.
Currently, the MAs are in the process of making a bullish cross.
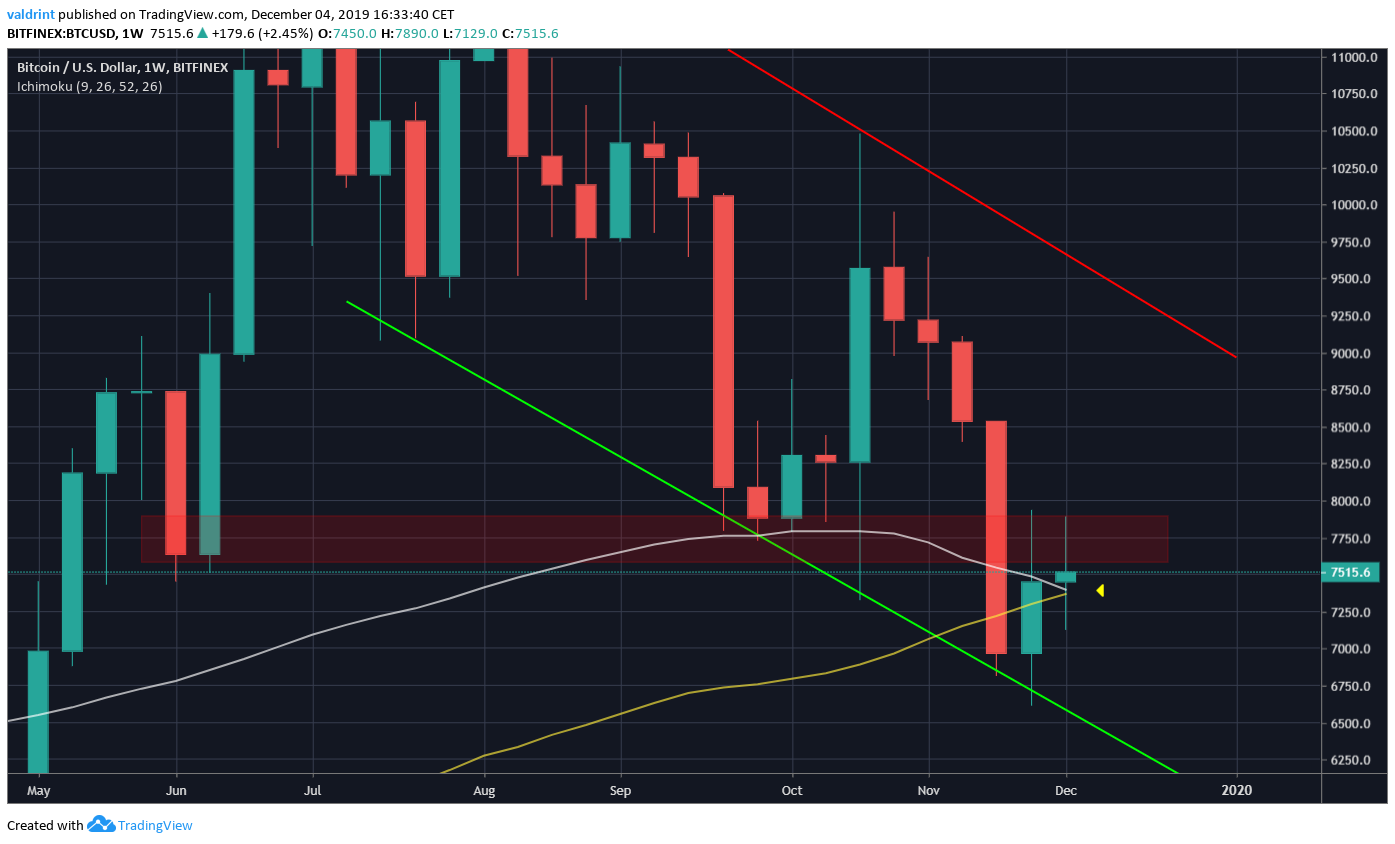
Bullish Bitcoin Cross
Looking closer at this possible bullish cross, we can see that the Bitcoin price has just moved above the 50- and 100-week MAs. However, it has found resistance at the $7600-$7800 area and has decreased slightly.
This area could hold the key to whether we do one final move downward or if we head immediately towards resistance. A weekly close below the resistance area would indicate the former — while a close above would support the latter.
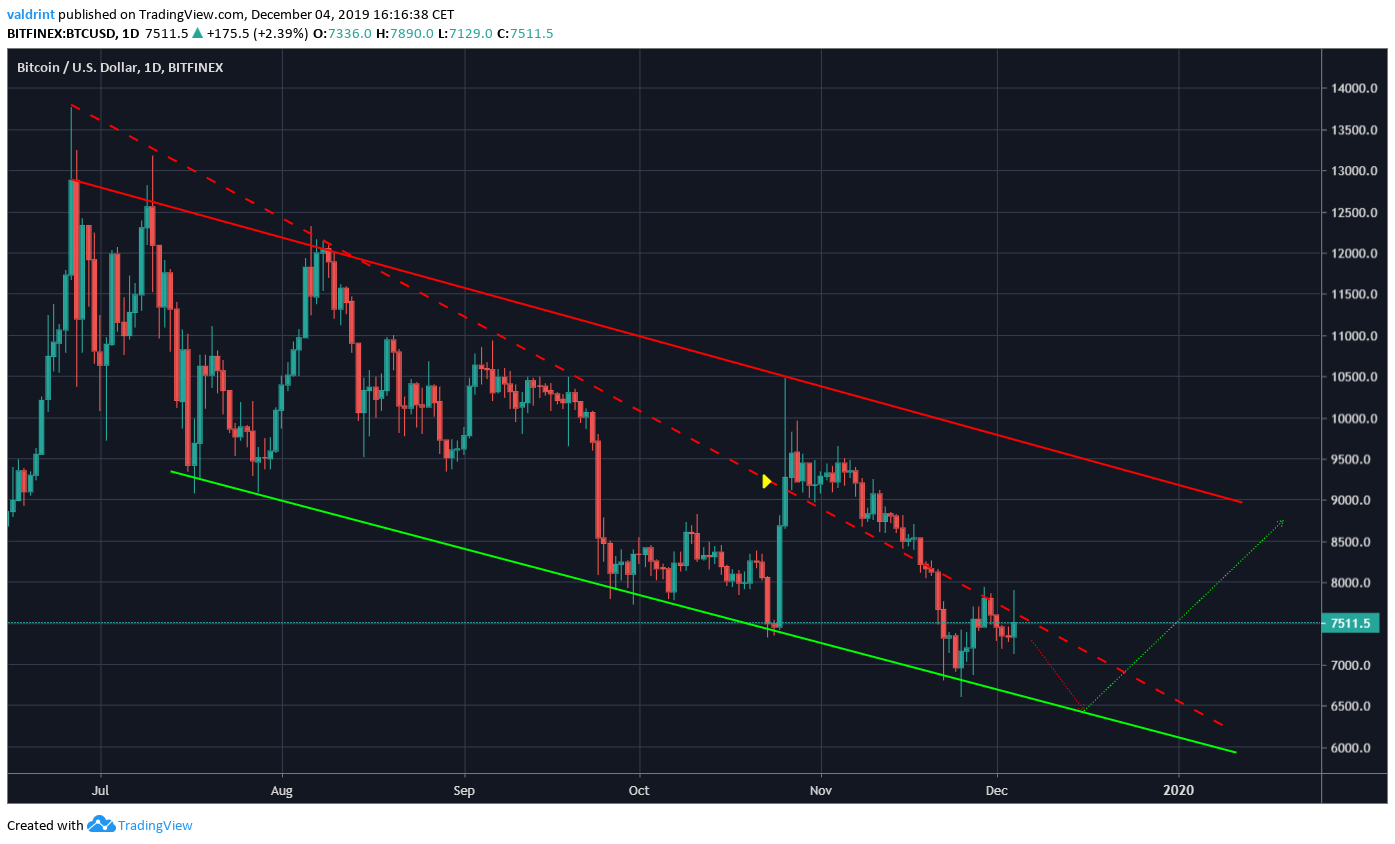
Significant Resistance
Since reaching the June 24 high, the Bitcoin price has been decreasing. It is trading in one of two possible patterns:
- The first (dashed line) suggests that Bitcoin was trading inside a descending wedge, out of which it broke out on October 25 (yellow arrow). However, that proved to be an illegitimate breakout — since the price fell inside the line once again. It is currently in the process of breaking out.
- The second scenario has Bitcoin trading inside a parallel descending channel, with both the resistance and support lines having been validated several times. The price initiated an upward move on November 24.
Both scenarios suggest that the Bitcoin price will move upward. However, one final drop is possible before the price begins to increase.
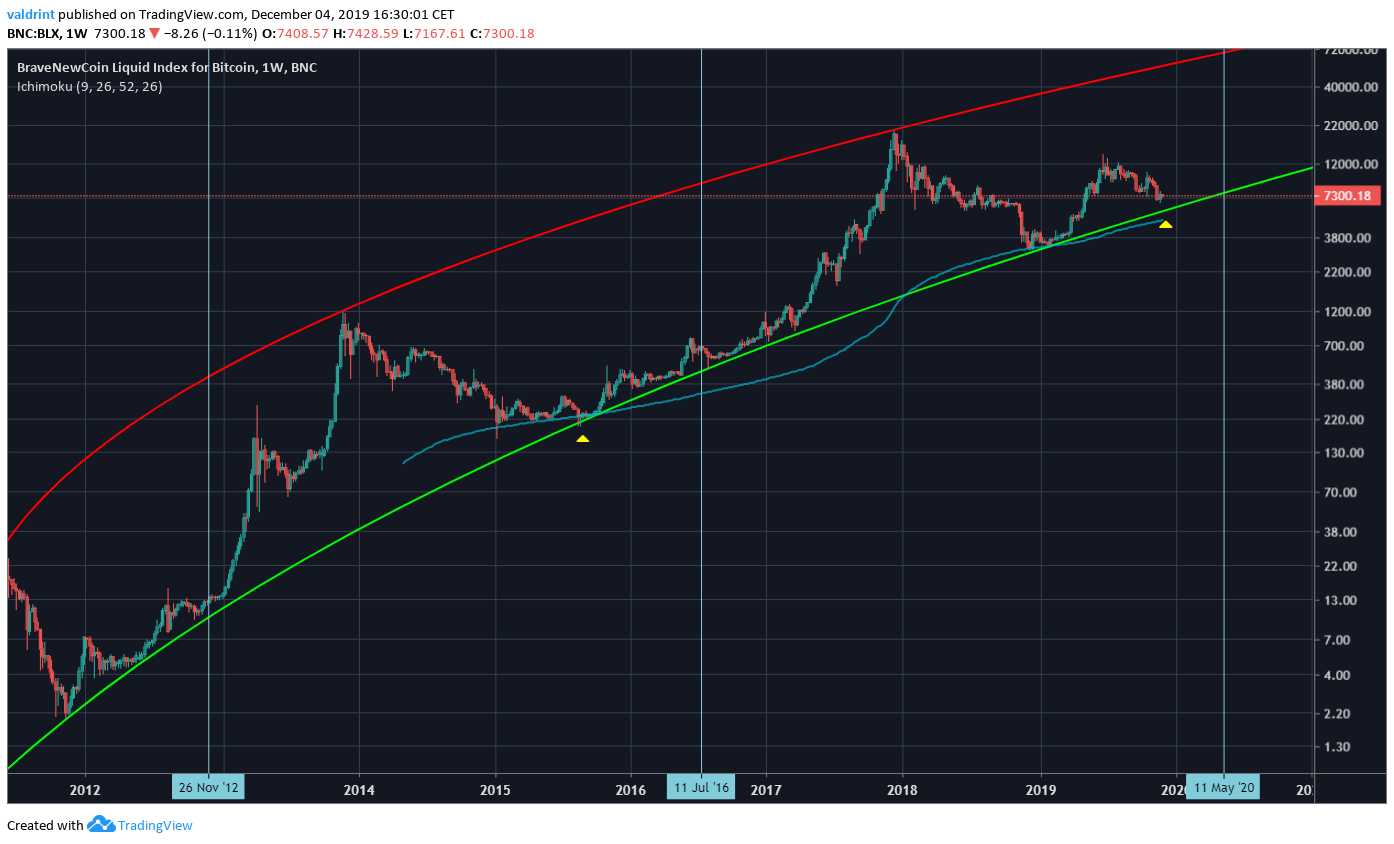
The final drop would fit well with the logarithmic growth curve. The support line is currently near $6000. If the Bitcoin price was to decrease once more to touch the line and the 200-week MA, it would be an almost identical move to that in 2015.
Furthermore, this would indicate the final low before the price increases in anticipation of Bitcoin’s block reward halving (vertical lines) — which is expected to occur in May 2020.
To conclude, the Bitcoin price movement suggests that the price has likely reached a bottom in December 2018 and will soon begin a new upward cycle. The relationship between long-term moving averages in the current and previous cycle supports this claim. Whether we close above or below the current resistance area at $7600-$7800 will indicate if we do one final downward move.
Disclaimer: This article is not trading advice and should not be construed as such. Always consult a trained financial professional before investing in cryptocurrencies, as the market is particularly volatile.


