


The XRP price is approaching a yearlong descending resistance line. A breakout above it could trigger a rapid price increase, similar to October 2018 and November 2019.
2019 was not kind to XRP since the price decreased by 75%. But, it has currently reached a support area, which acted as a catalyst for an upward move in May. A breakdown below this area would likely take the price to new lows near 1400 satoshis. On the contrary, a price breakout above the current descending resistance line would indicate that a new market cycle has begun.
Full-time cryptocurrency trader (@CryptoMichNL) outlined the XRP chart since 2017, highlighting two descending resistance lines. A breakdown above the first one initiated the December 2017 upward move while the second on that in September 2018. But, for the same thing to happen this time, the 2400 satoshi support area has to hold and act as the catalyst for this upward movement.
Tik tok, tik tok. pic.twitter.com/7pF3d6clrN
— Michaël van de Poppe (@CryptoMichNL) January 2, 2020
Will XRP break out? If so, how high will it increase? Keep reading below if you are interested in finding out.
Descending Resistance
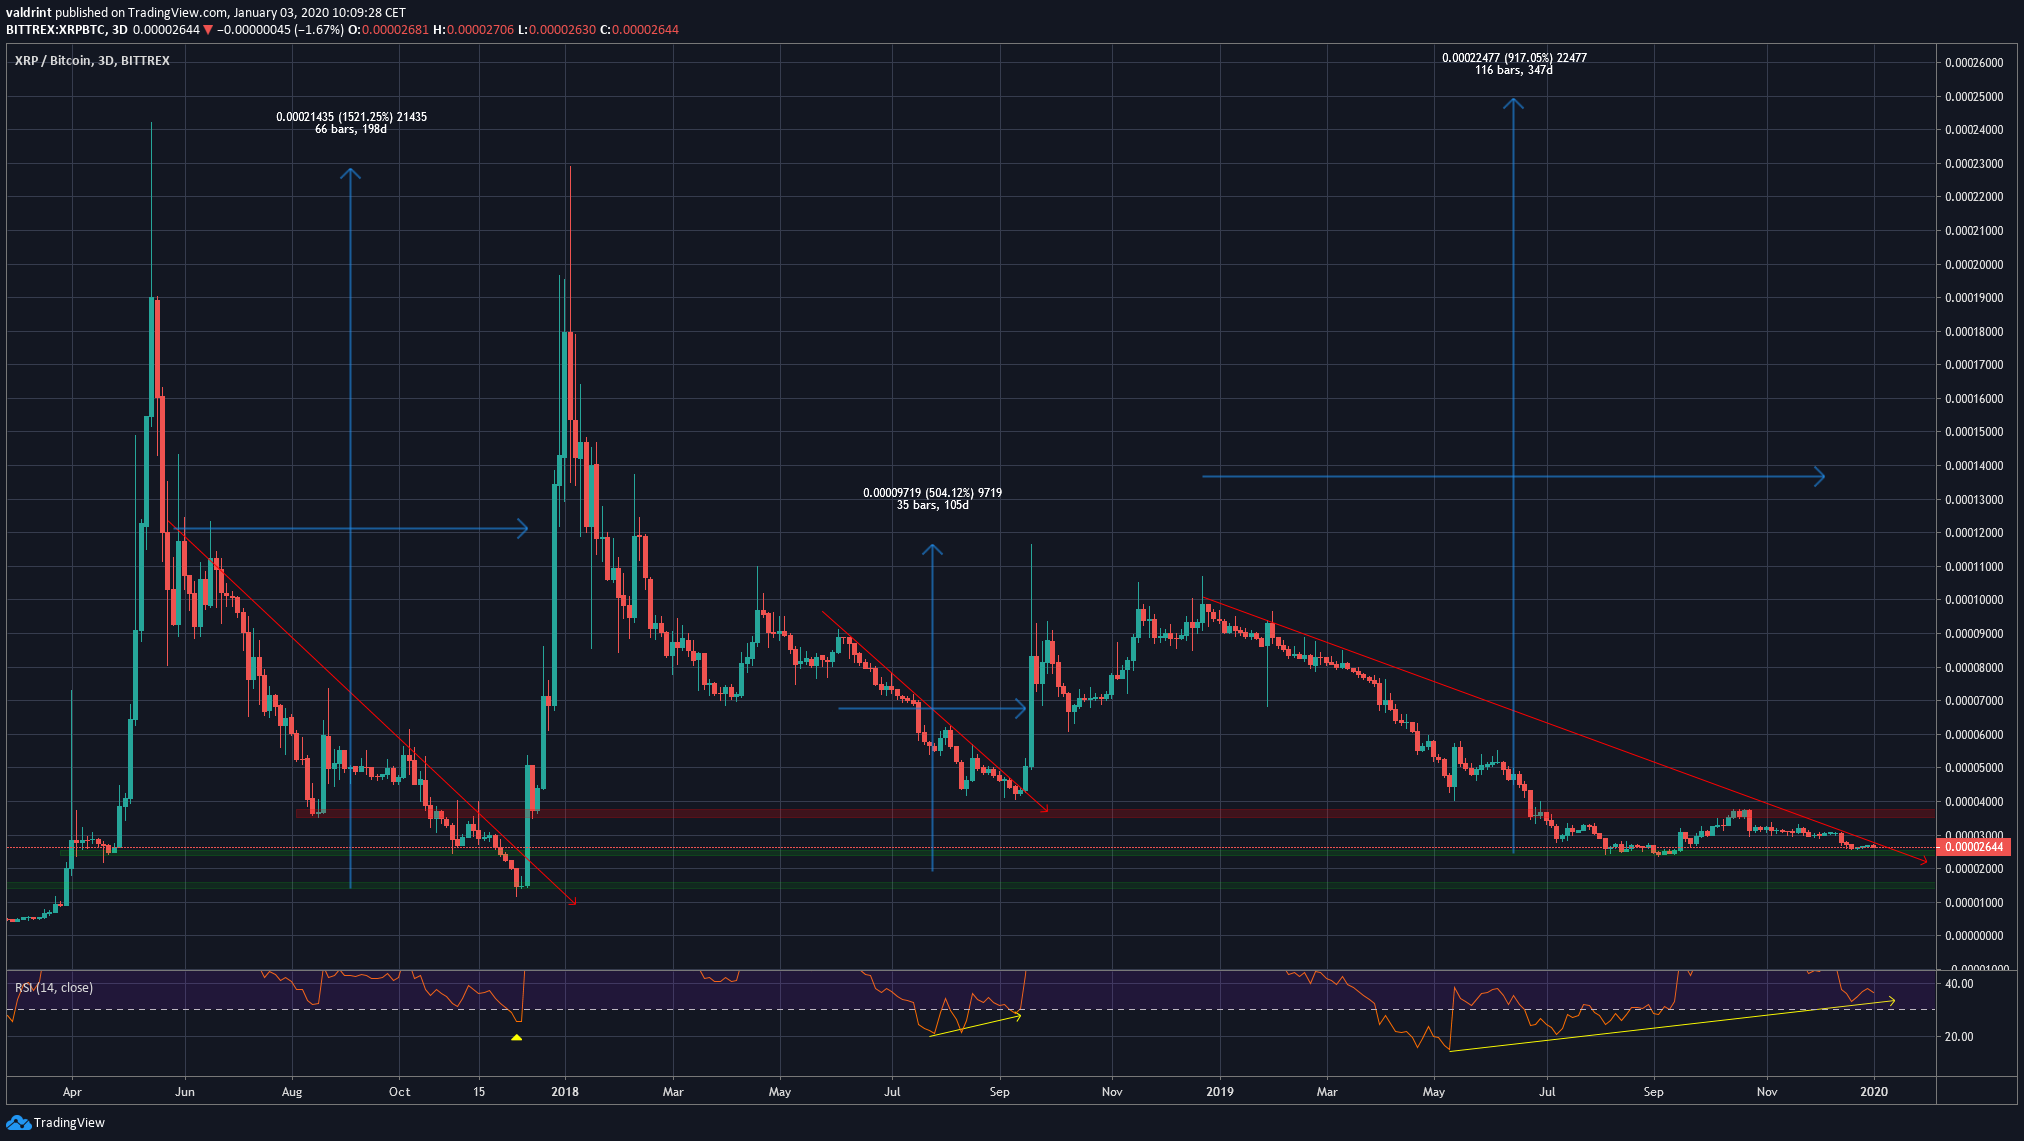
Since May 2017, the XRP price has begun an upward movement on two occasions. Both times, the upward move was preceded by a breakout above a long-term descending resistance line. The first happened in November 2017, while the second one in September 2018.

During the current movement, the price has been following the descending resistance line for 350 days. For it to reach an all-time high of 25,000 satoshis, an upward movement of 900% would have to follow, which is less than a 3:1 ratio.
Furthermore, while the three-day RSI was oversold during the first movement, it did not generate any bullish divergence before the breakout. The second time, there was a close to two month period in which it generated a bullish divergence. In the current movement, the price has been generating bullish divergence since May, suggesting that if an upward move occurs, it could have a very strong magnitude and reaffirming the hypothesis coming from the downtrend length of time.
The closest resistance area is found at 3600 satoshis, while the support areas are at 2400 and 1400 satoshis, respectively.
XRP Current Upward Move
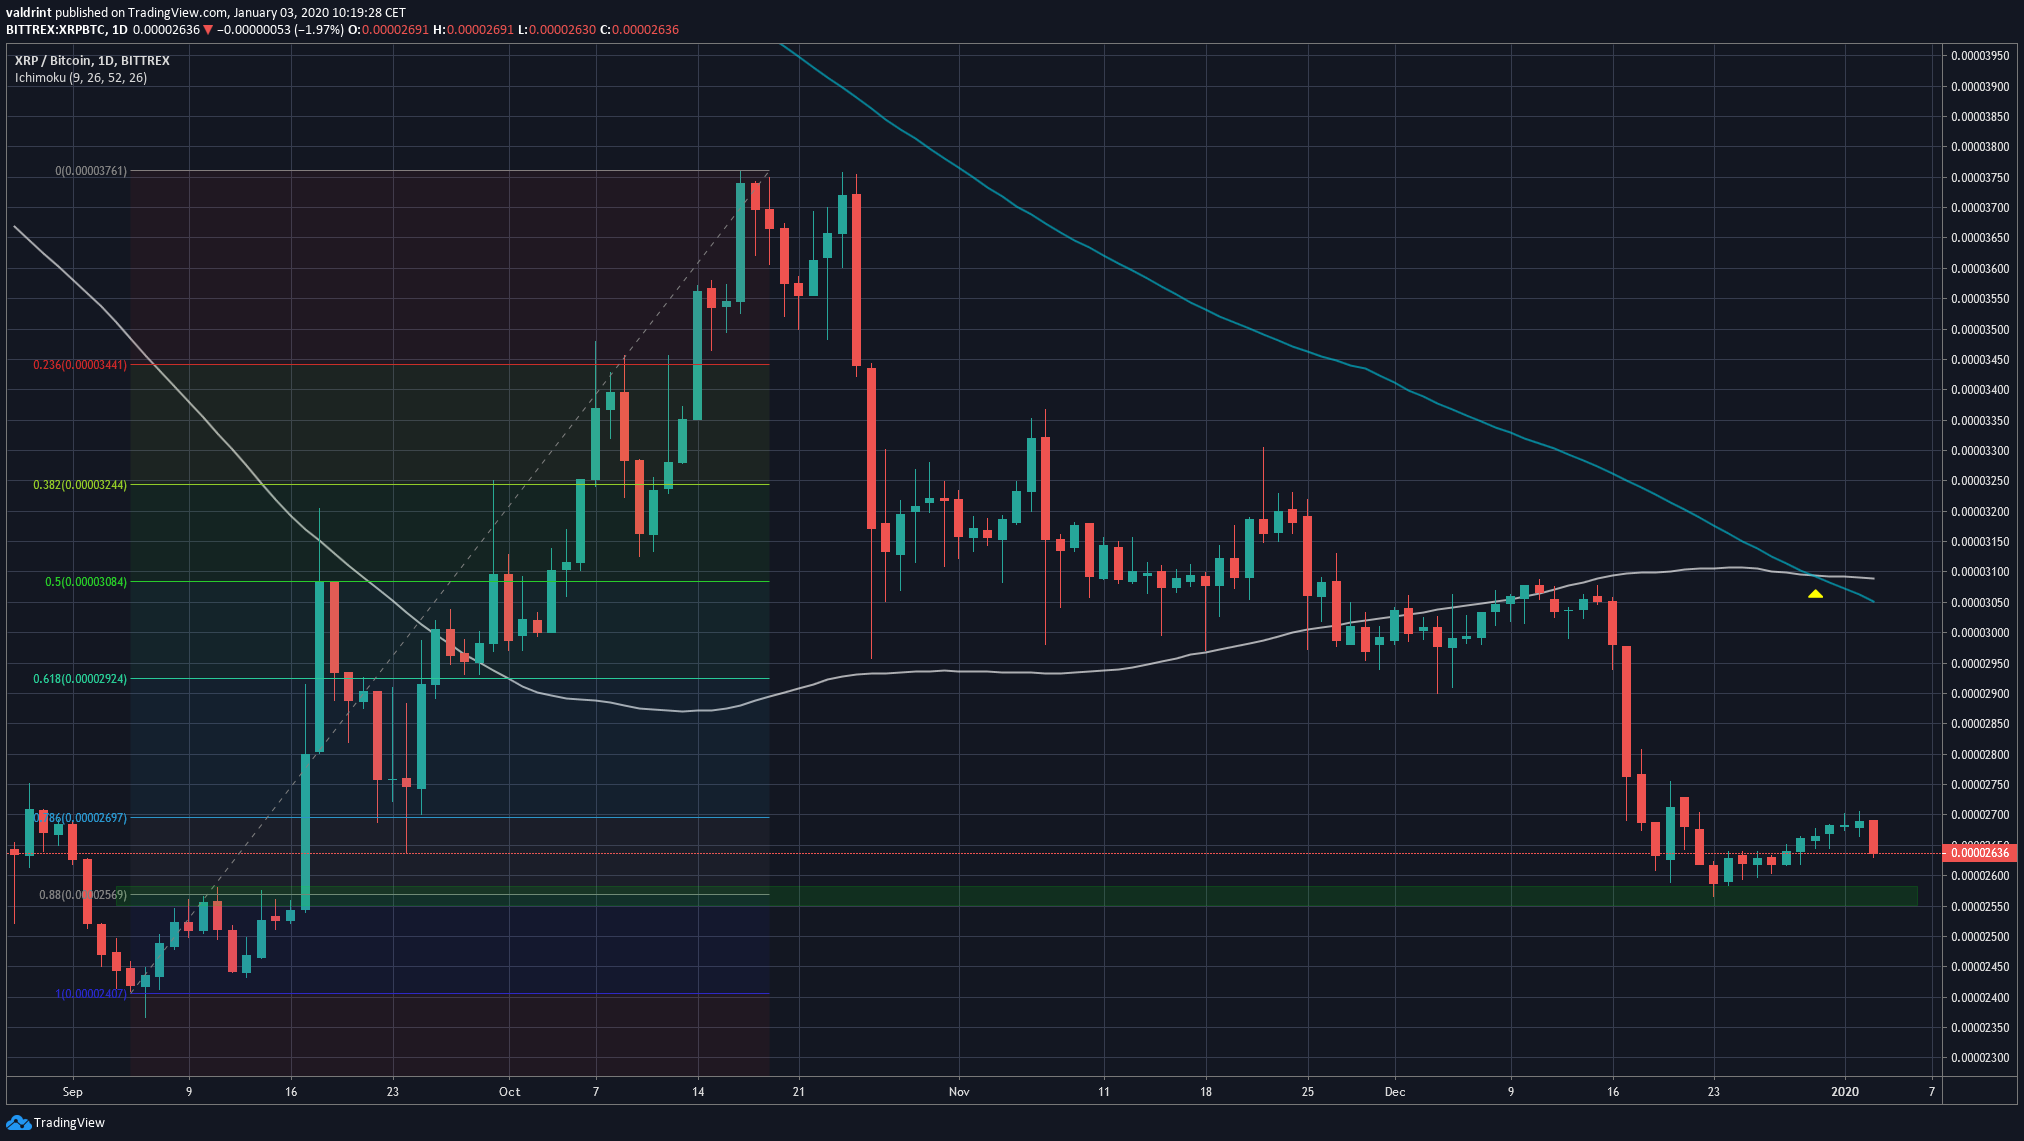
Looking at the upward movement since September 5, the price has reached the final fib level of 0.88, which also coincides with a previous resistance area at 2550 satoshis.
While the 100- and 200-day moving averages (MA) have made a bullish cross, indicating that a long-term upward move might have begun, the price is still trading below both of them. A rapid upward movement, as indicated in the previous section, would have the price move above these MAs.
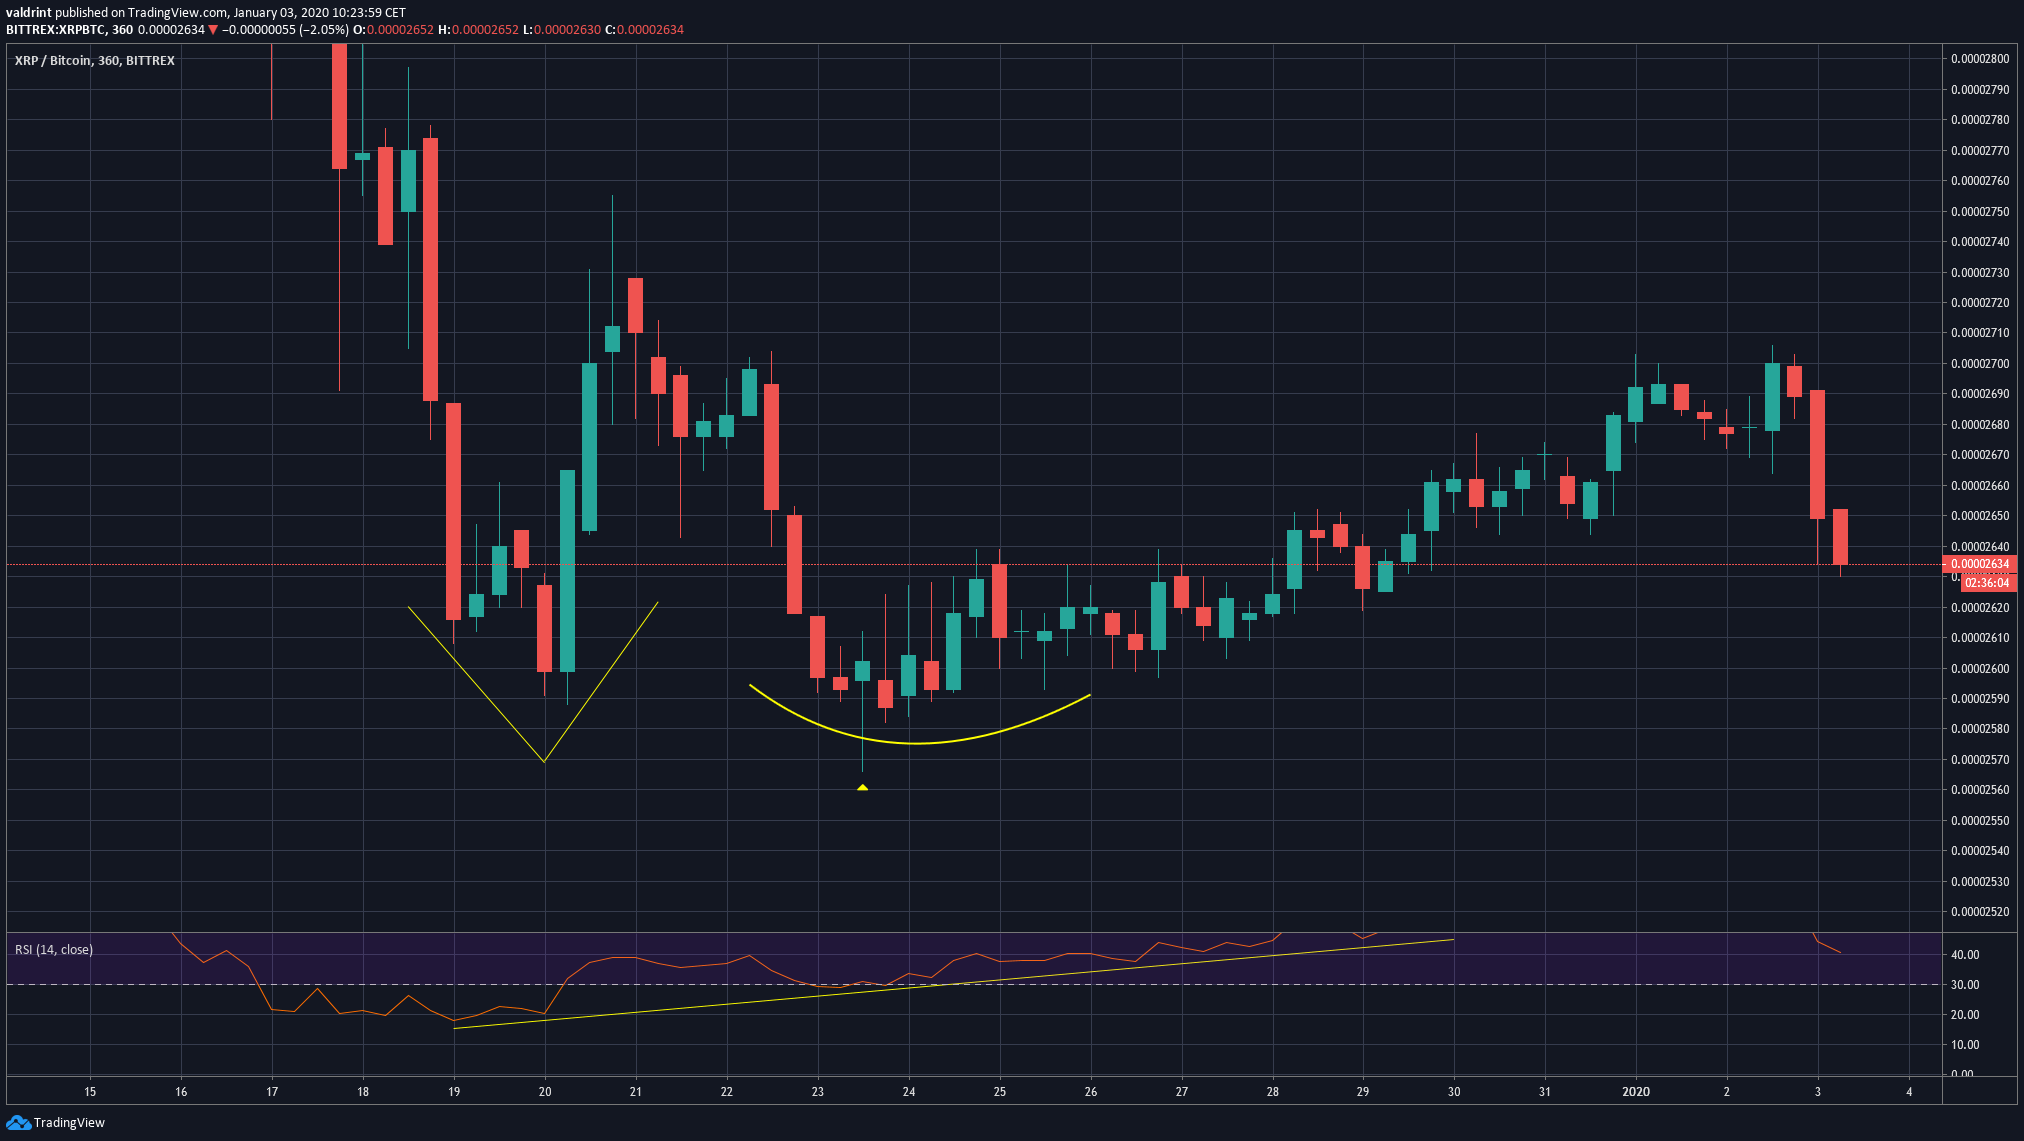
In the shorter-term, we can see that the price has created an Adam & Eve (sharp & gradual) bottom near 2500 satoshis. The bullish pattern was also combined with a bullish divergence in the RSI. However, the price failed to reach a new high and has been decreasing since yesterday.
The wick low of 2550 offers a suitable level to place a stop loss in case the price breaks down.
To conclude, the XRP price has approached a significant descending resistance line. A similar movement preceded two previous upward moves with magnitudes of 1500% and 500%, respectively. A similar movement would cause the price to reach a new all-time high.
