
XRP has been up 10% over the past seven days but has corrected by 4.6% on Thursday, signaling a potential shift in momentum. The RSI has dropped below 50, Ichimoku indicators show price slipping under key support lines, and the EMA gap is narrowing—together pointing to weakening short-term strength.
While XRP’s broader trend remains technically bullish, its indicators now reflect growing vulnerability. Whether the recent pullback deepens or sets the stage for a rebound will depend on how XRP behaves around current support zones.
XRP Momentum Cools as RSI Slides Below 50
XRP’s Relative Strength Index (RSI) has dropped significantly, falling from 65.13 yesterday to 46.95 today.
This decline indicates a clear loss of bullish momentum within a short time frame and places XRP back in the lower half of the neutral RSI zone.
The drop reflects a shift in sentiment, as traders may be stepping back from aggressive buying following recent price action.
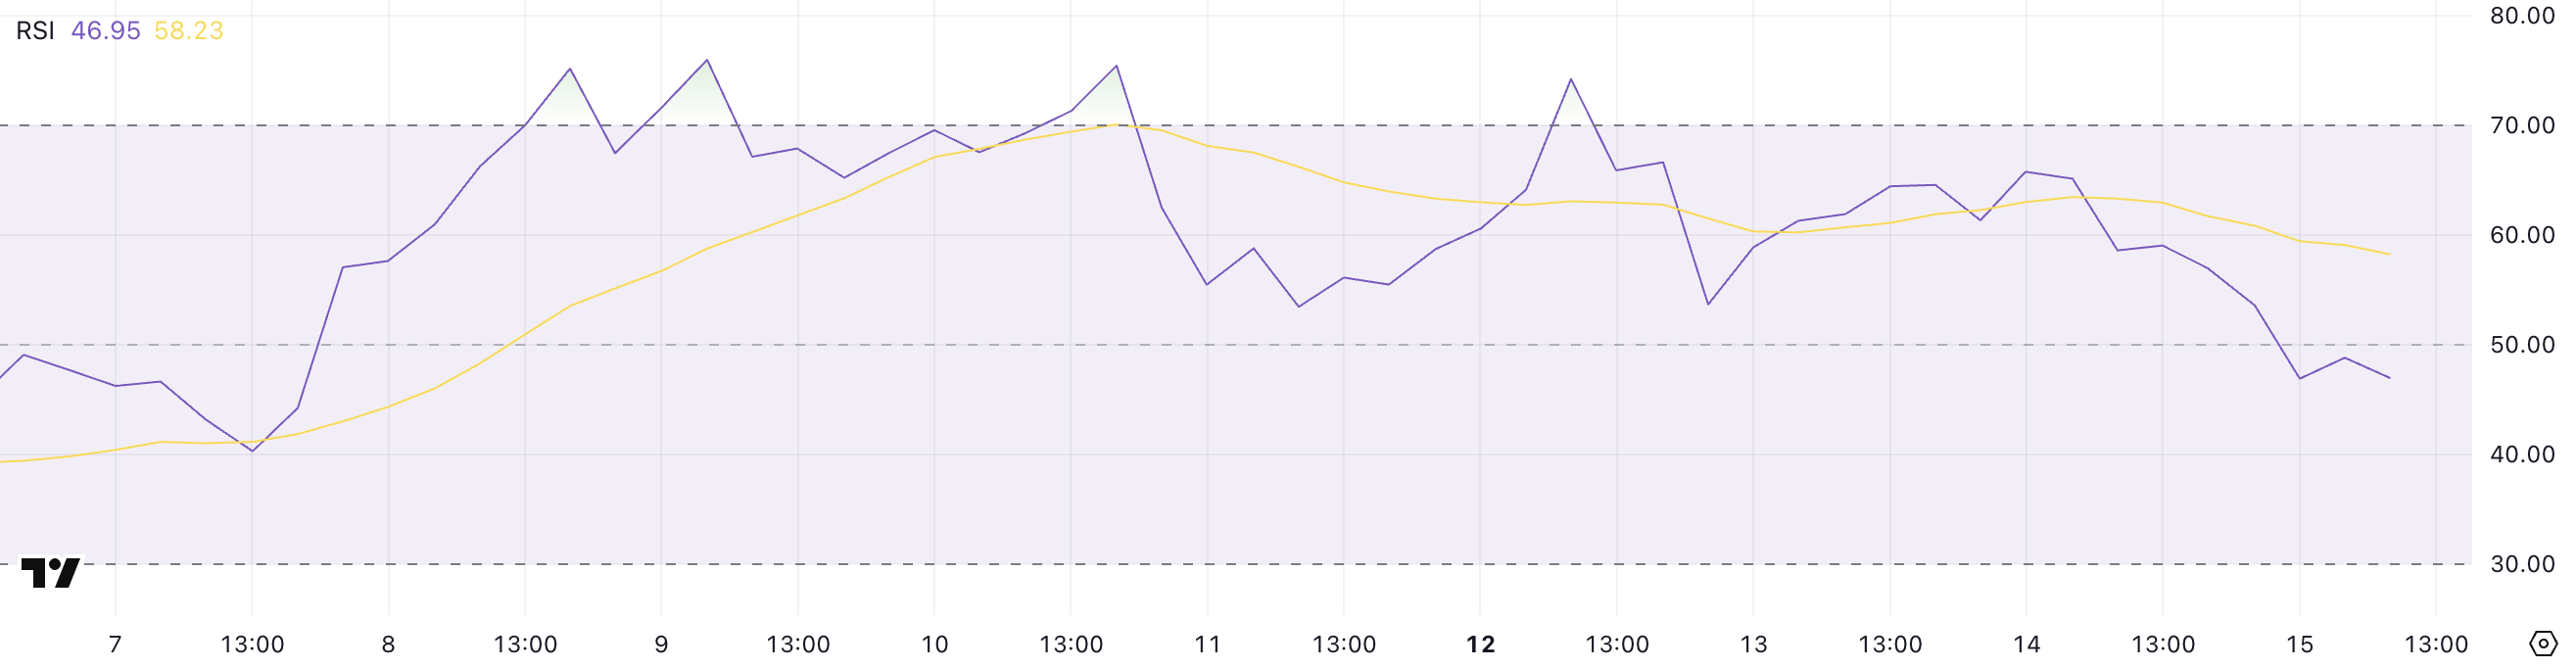
The RSI is a momentum oscillator that measures the speed and change of price movements on a scale from 0 to 100. Readings above 70 typically suggest an asset is overbought and may be due for a correction, while levels below 30 indicate oversold conditions that could precede a rebound.
XRP’s current RSI of 46.95 suggests neither extreme, but the downward trend could signal weakening demand.
If the RSI continues falling toward 30, it may point to increased bearish pressure; however, a bounce from current levels could help XRP stabilize and attempt a recovery.
XRP Faces Pressure as Price Slips Below Ichimoku Lines
The Ichimoku Cloud chart for XRP shows a shift in momentum as the price action has moved below both the blue Tenkan-sen and red Kijun-sen lines.
This crossover to the downside is typically viewed as a short-term bearish signal, especially when confirmed by the price trading below the Kijun-sen.
The cloud ahead (Senkou Span A and B) is currently green, indicating that the longer-term outlook still holds a bullish bias. However, the cloud’s narrowing suggests weakening trend strength and increasing vulnerability to a possible trend reversal.
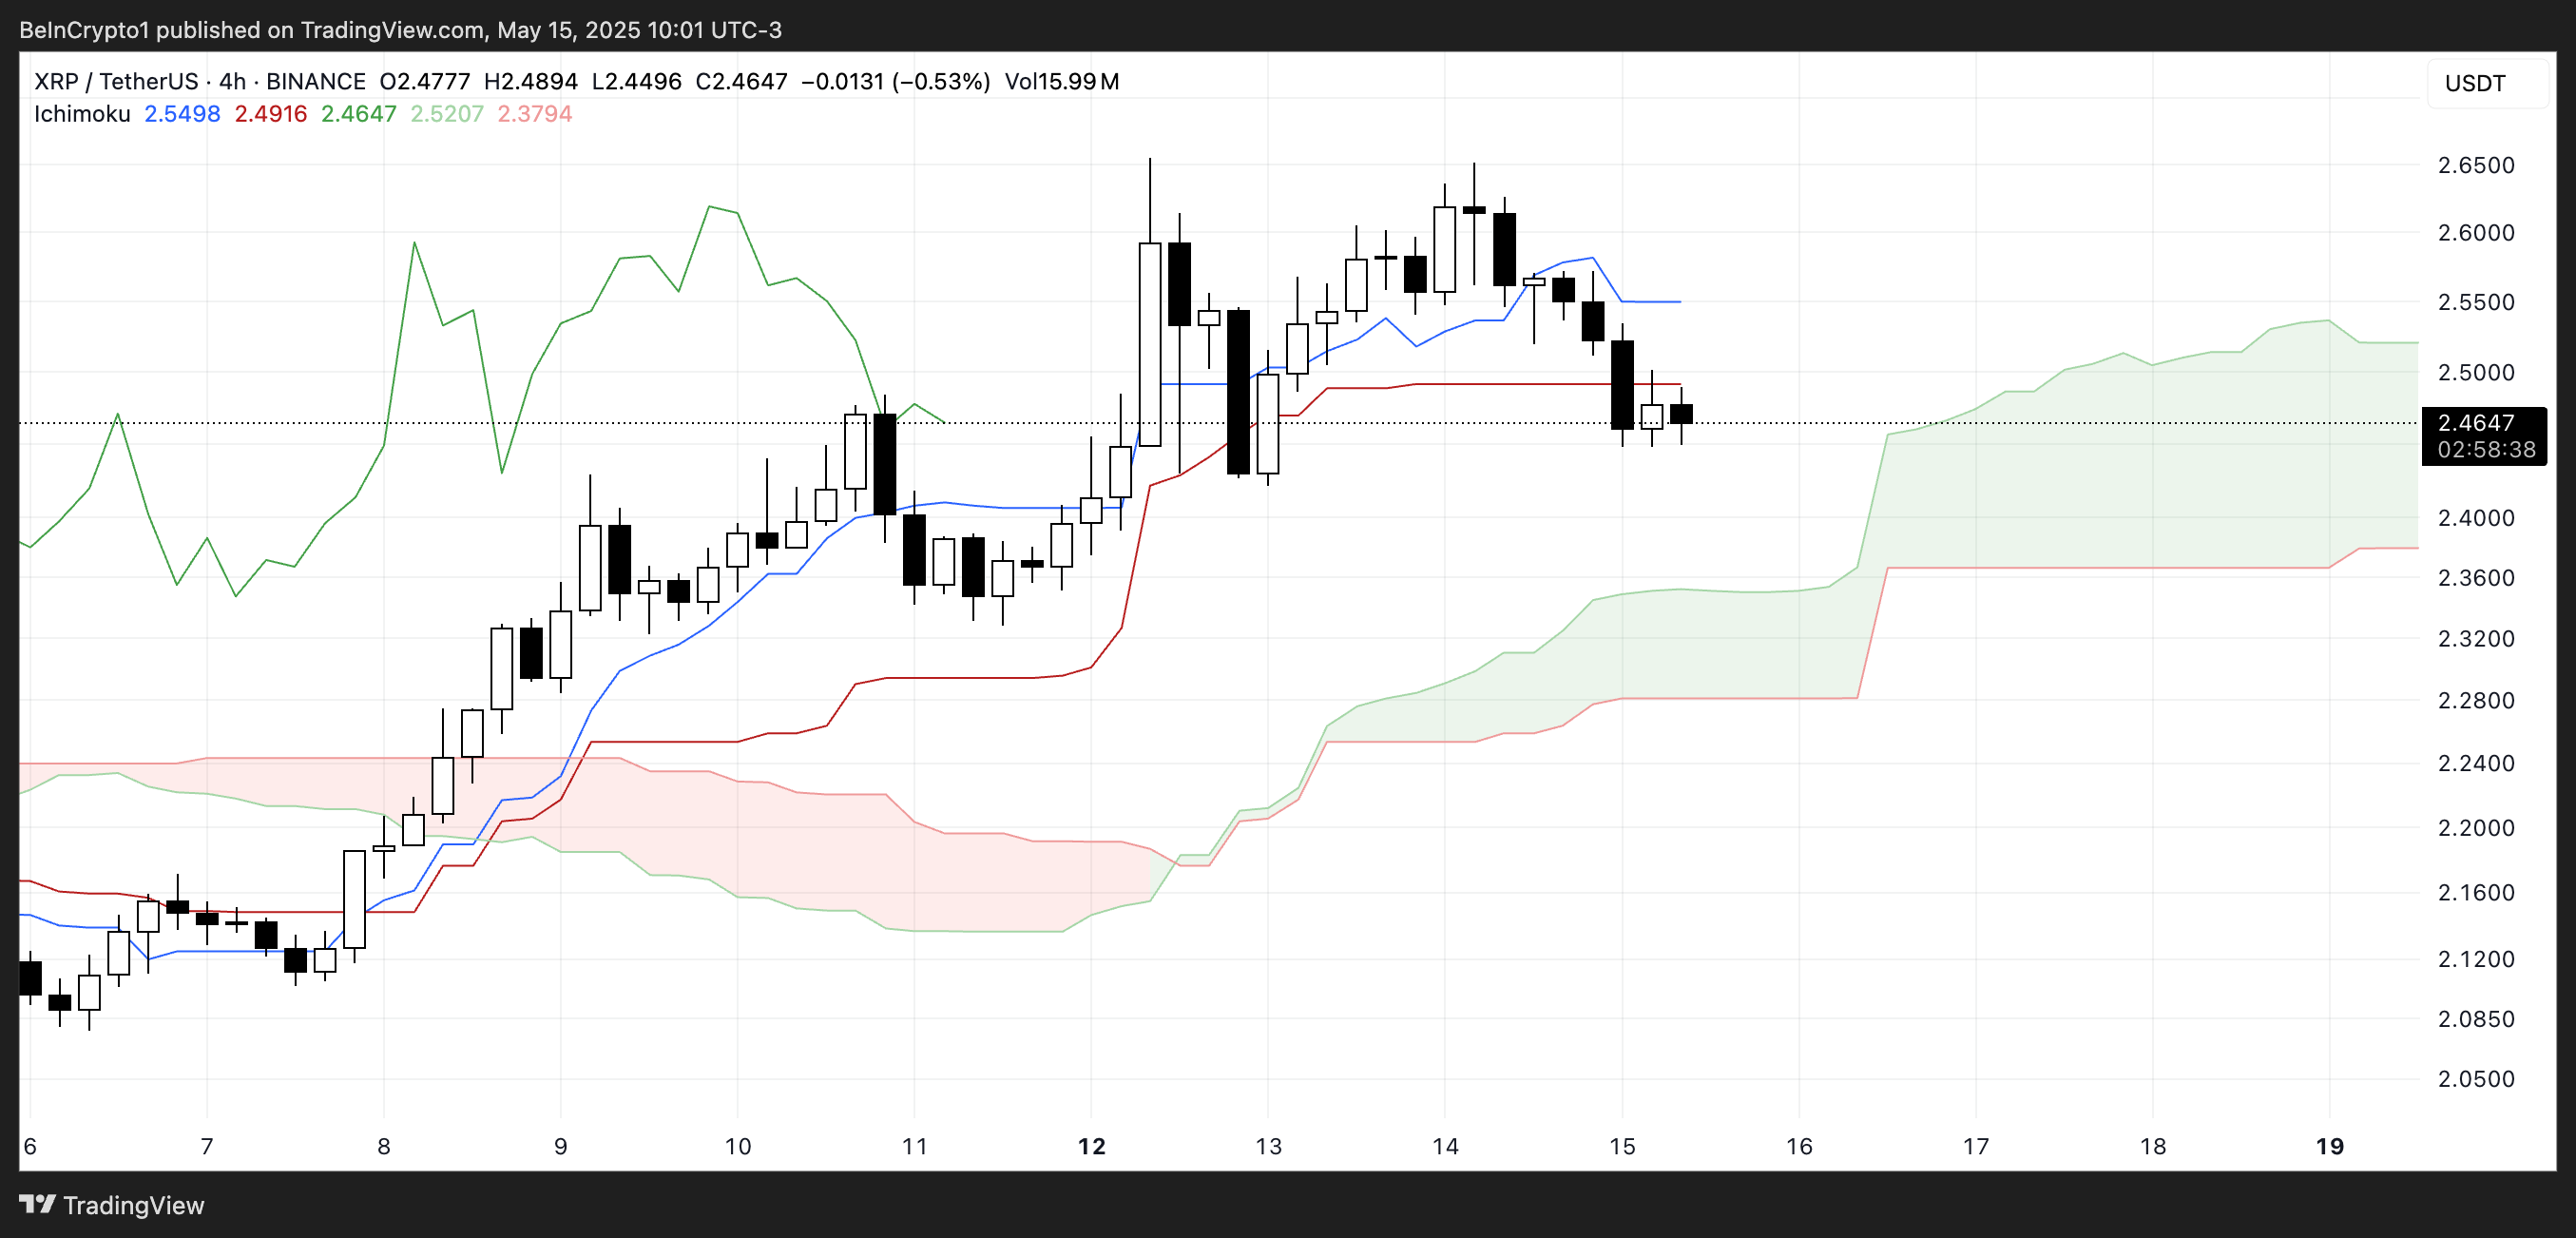
The price is now approaching the edge of the green cloud, which acts as a key support zone. If this support holds, XRP may consolidate or attempt a bounce.
However, if the price breaks decisively below the cloud, it would mark a bearish shift in structure. Additionally, the Chikou Span (lagging green line) has lost its bullish separation from past price action, suggesting that momentum is no longer clearly on the bulls’ side.
The overall setup reflects a market at a crossroads—still holding structural support, but with growing signs of weakness.
XRP EMA Lines Narrow as Market Awaits Next Move
XRP’s EMA lines remain bullish, with shorter-term moving averages still positioned above the longer-term ones—an indication that the broader trend is intact.
However, the gap between these lines has narrowed, signaling a potential weakening in momentum. This compression suggests that bulls are losing control, and if XRP fails to hold the nearby support at $2.42, it could open the door for a deeper correction.
In such a case, further downside targets include $2.32, followed by $2.25 and $2.15 if bearish pressure accelerates.
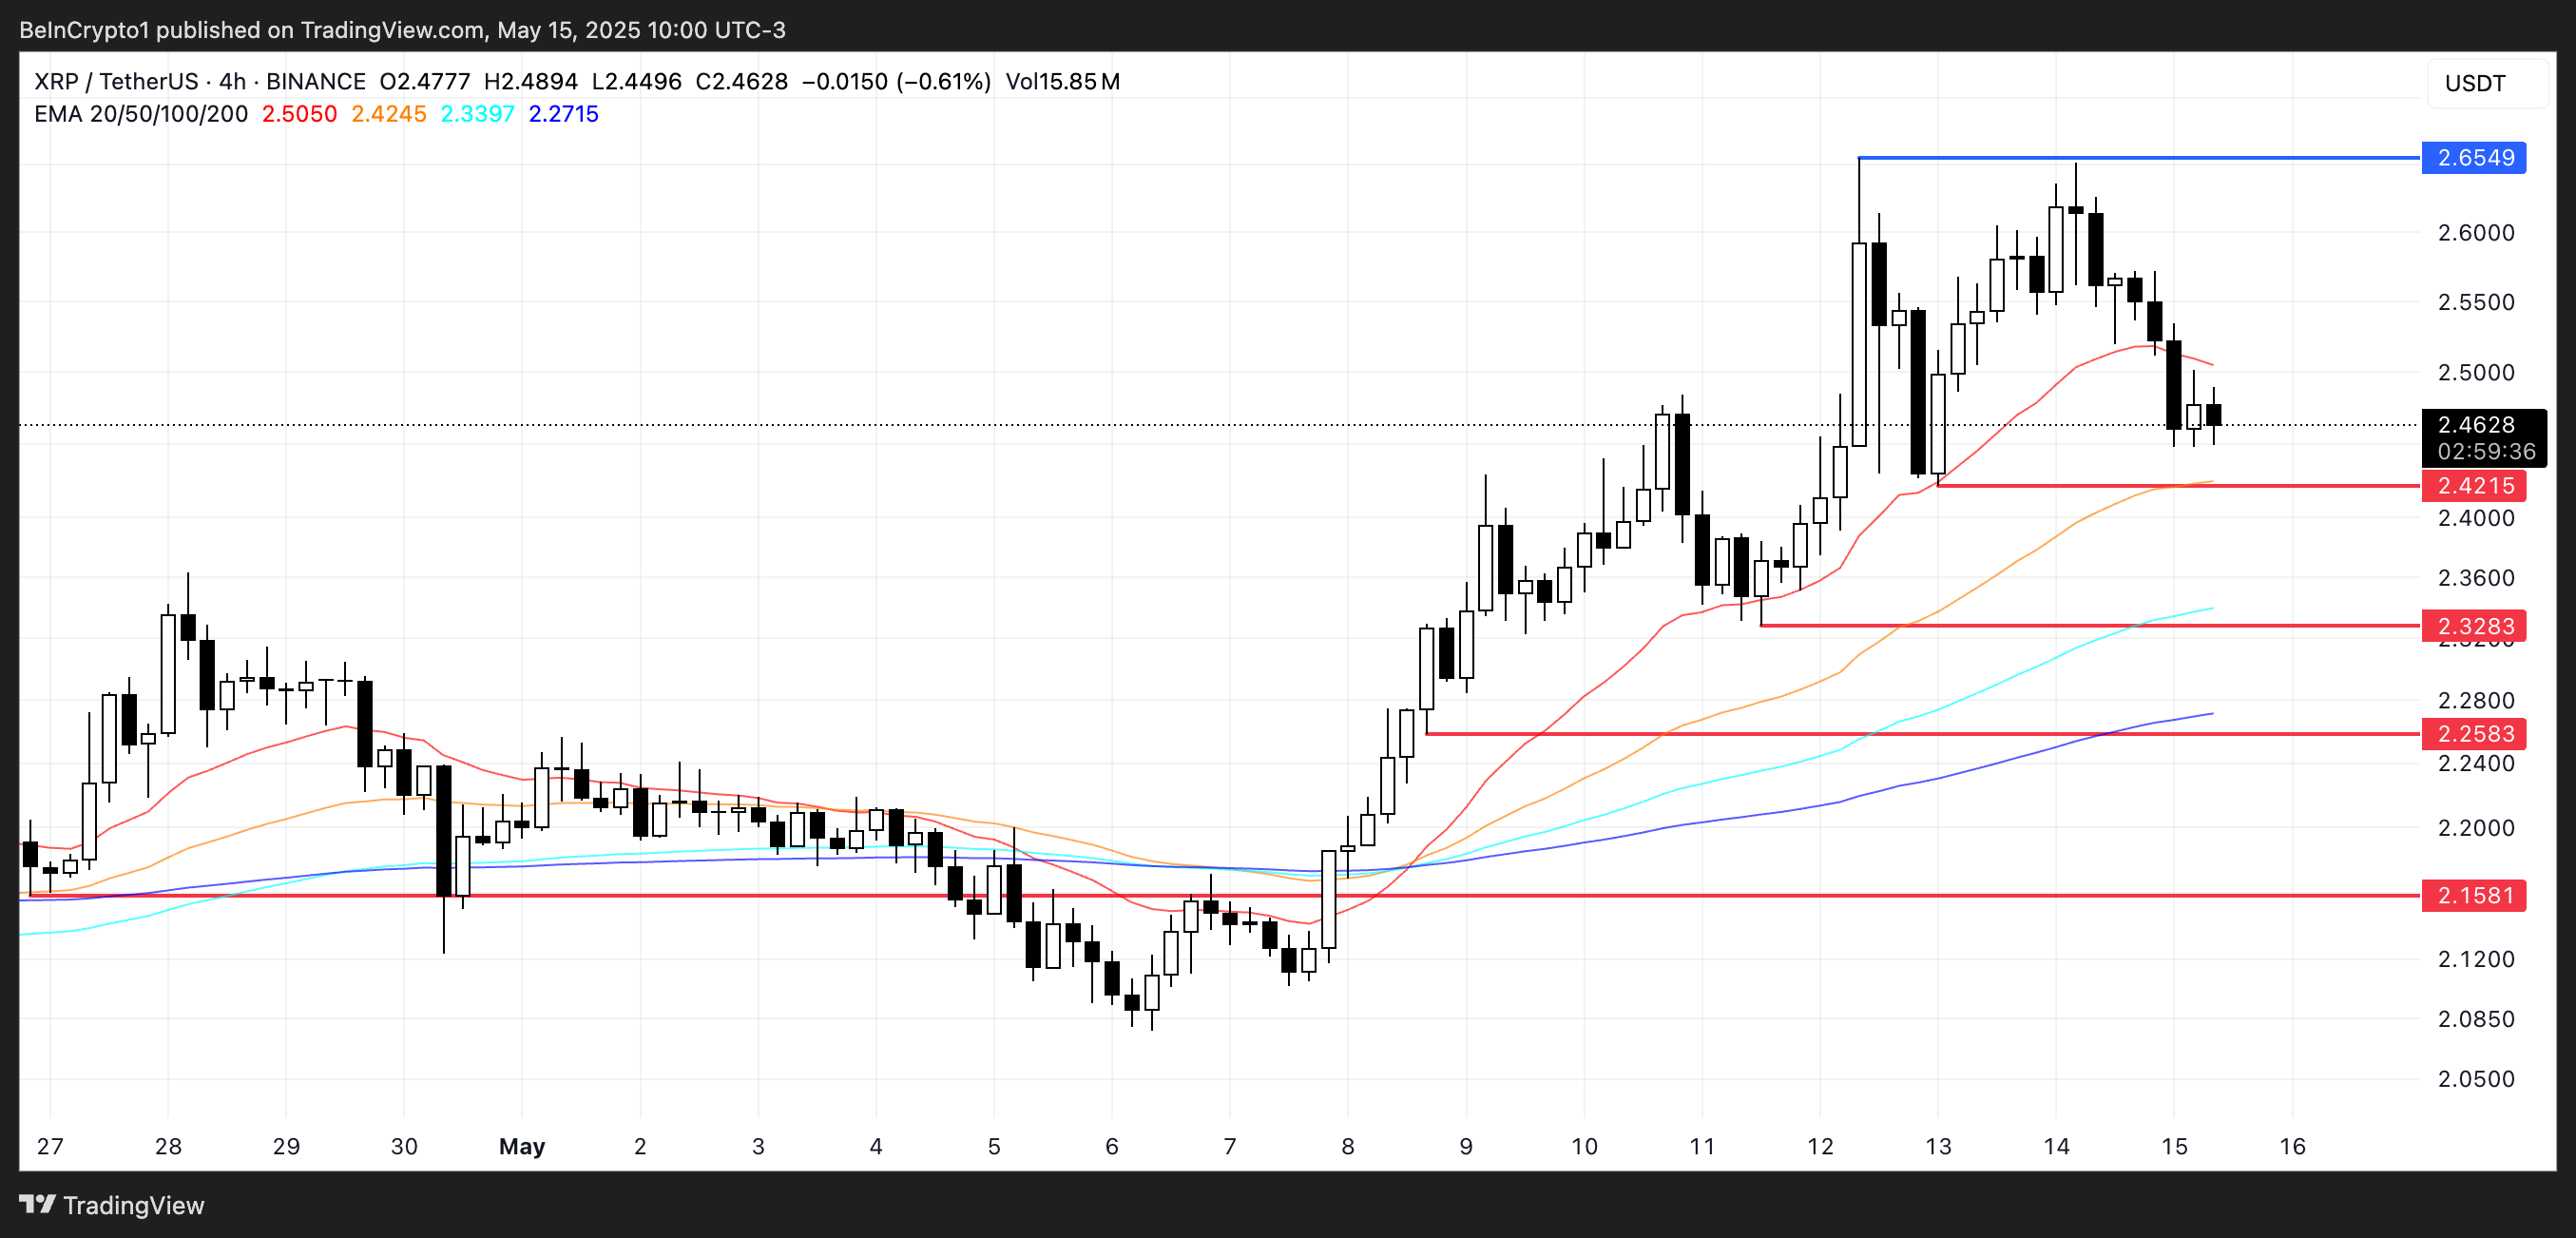
Despite this vulnerability, XRP is still up 11.7% over the past week, showing it has recently attracted buying interest.
If positive momentum resumes, XRP could again challenge the $2.65 resistance.
A successful breakout above that level may pave the way for a move above $2.70—a price not seen since March 2.
