


The XRP price increased by more than 7% on Oct 4, creating a bullish engulfing candlestick in the process.
While the price has yet to break out above the main resistance area, technical indicators and the price action suggest it will do so soon.
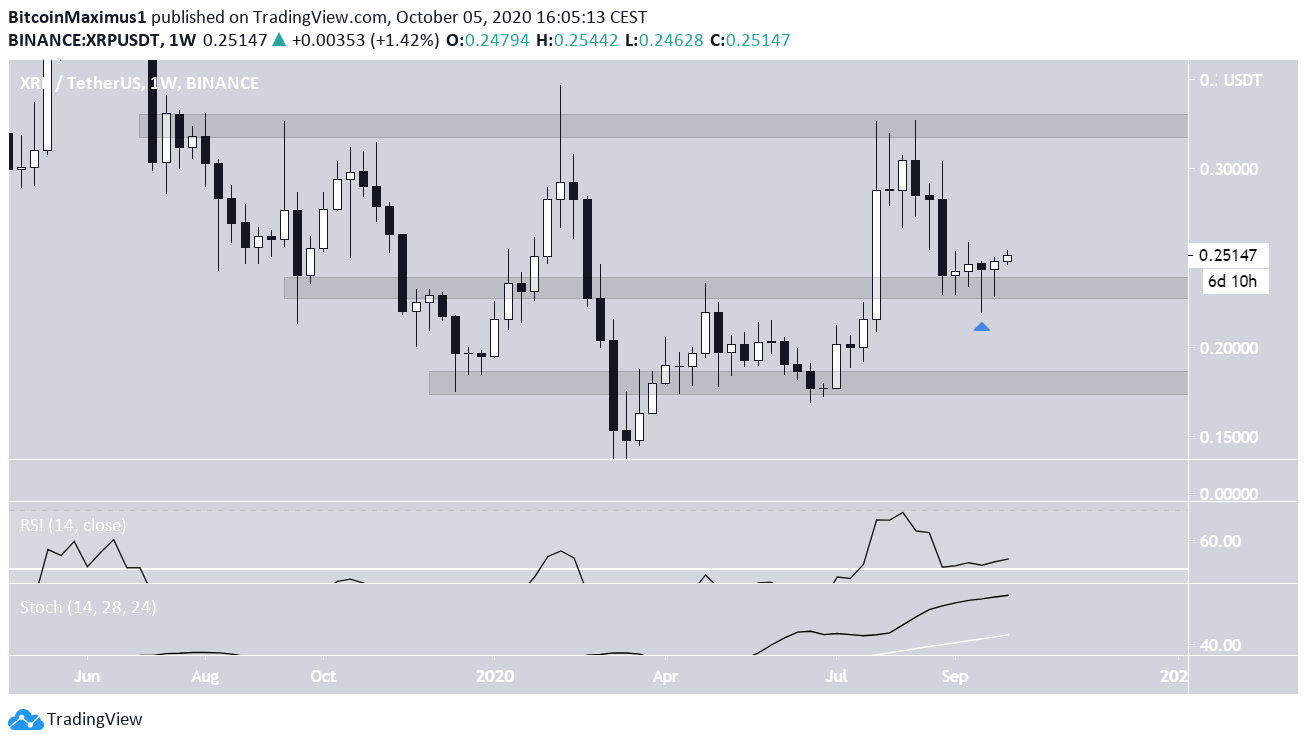
Long-Term Levels
The XRP price is currently trading above the long-term $0.235 support area. The area has intermittently acted as both support and resistance since Sept. 2019.
In August 2020, the price broke out from this area, creating a bullish engulfing candlestick and reaching a high of $0.326. However, the price has been falling since the beginning of September, and it just validated the $0.235 area as support again.
Technical indicators are bullish. Both the RSI and Stochastic oscillators are increasing, neither having formed any bearish divergence. This signifies that the price is likely to continue moving upwards, possibly validating the $0.325 resistance area once more.
If the price were to break down, the next closest support area is found at $0.18.
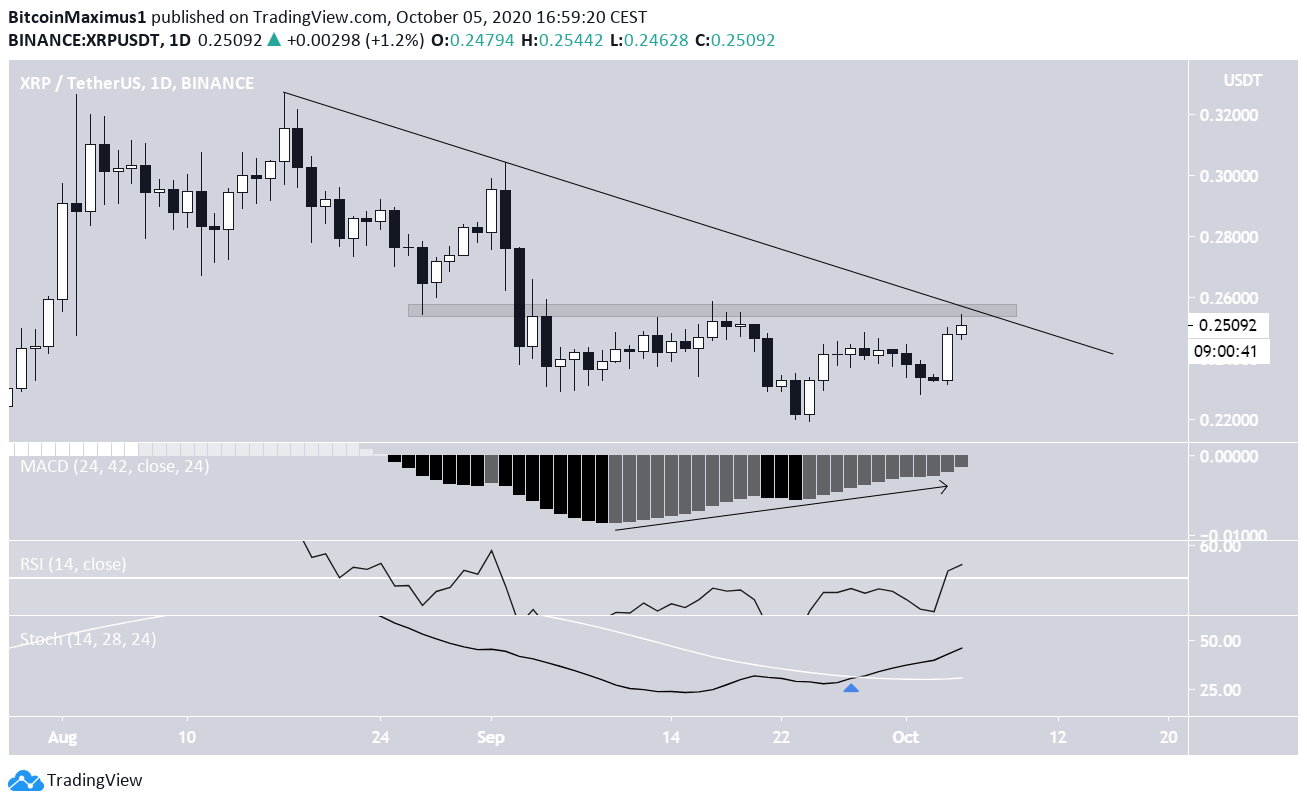
Main Resistance Area
The XRP price has been declining since Aug 17, when a high of $0.326 was reached. The price created a descending resistance line, and the decline went on until the price reached a low of $0.219 on Sept 24.
Since then, XRP has been rallying and is currently right at the resistance line and the $0.255 area, which previously acted as support but turned to resistance after the Sept drop.
If the price successfully breaks out above both the resistance line and area, it could trigger a rapid increase towards the long-term resistance levels outlined in the previous section.
Technical indicators are bullish. The MACD has formed considerable bullish divergence and is moving upwards. The RSI has crossed above 50, and the Stochastic Oscillator has made a bullish cross.
These are signs that the price will eventually be successful in breaking out.
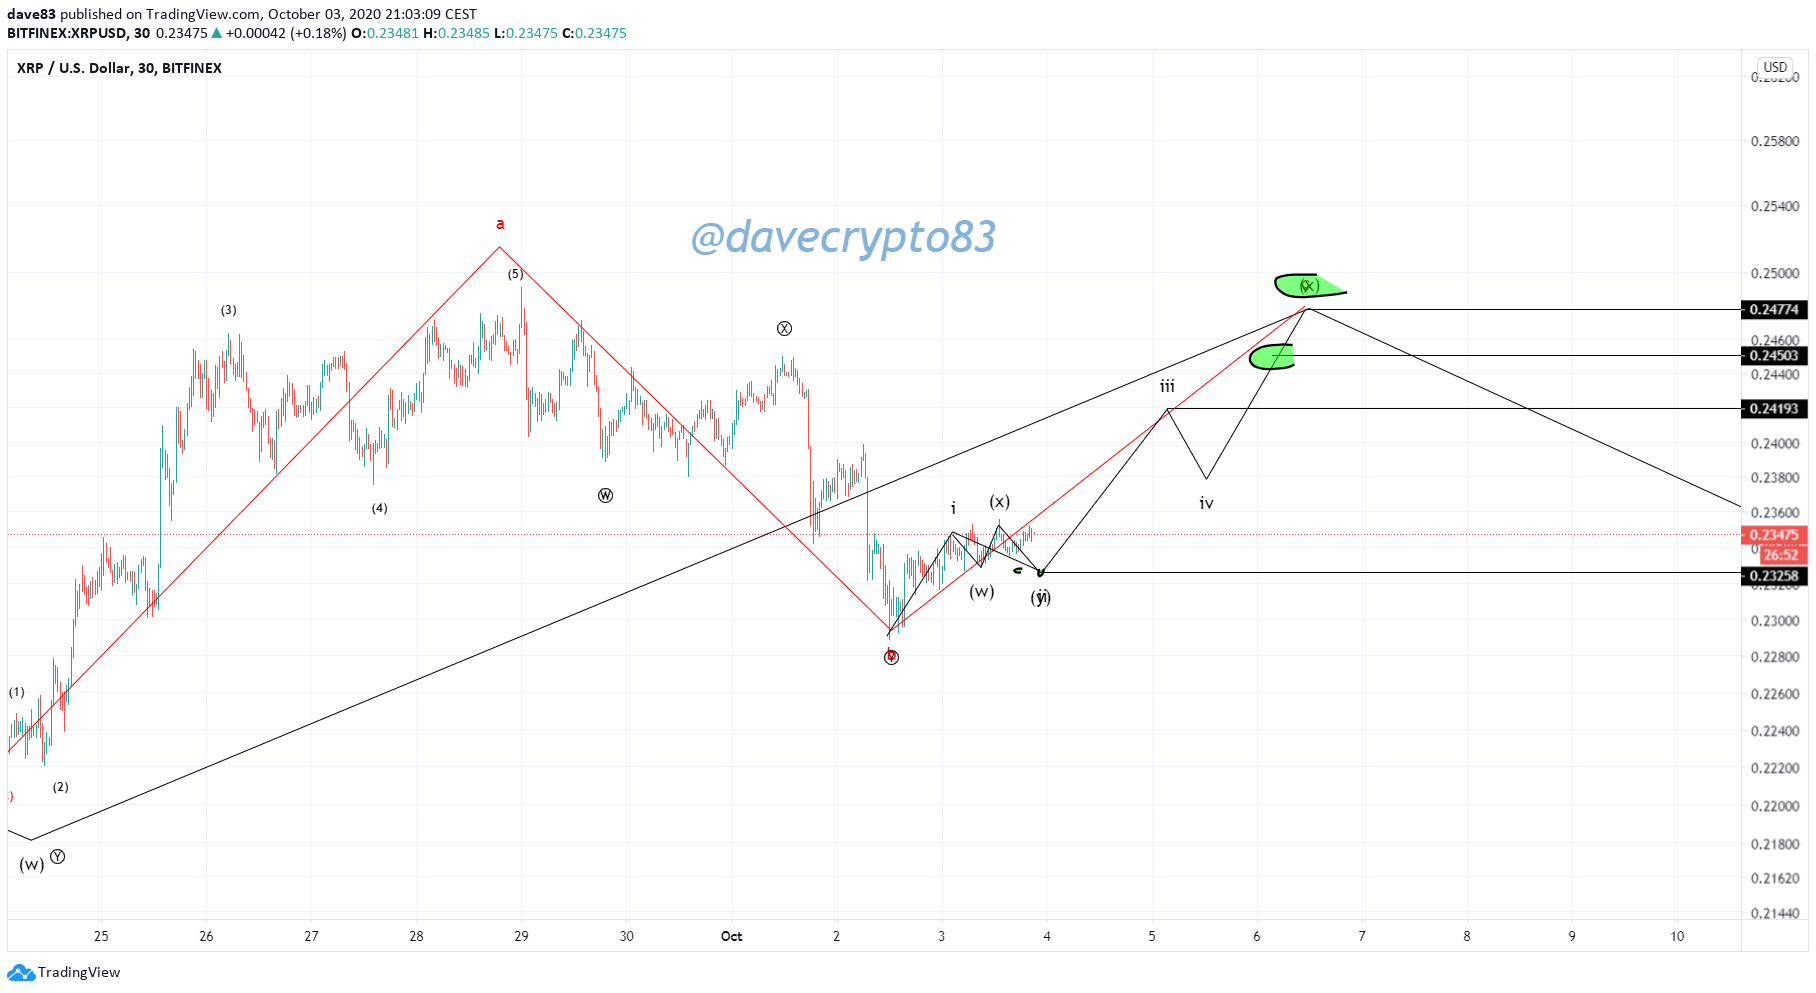
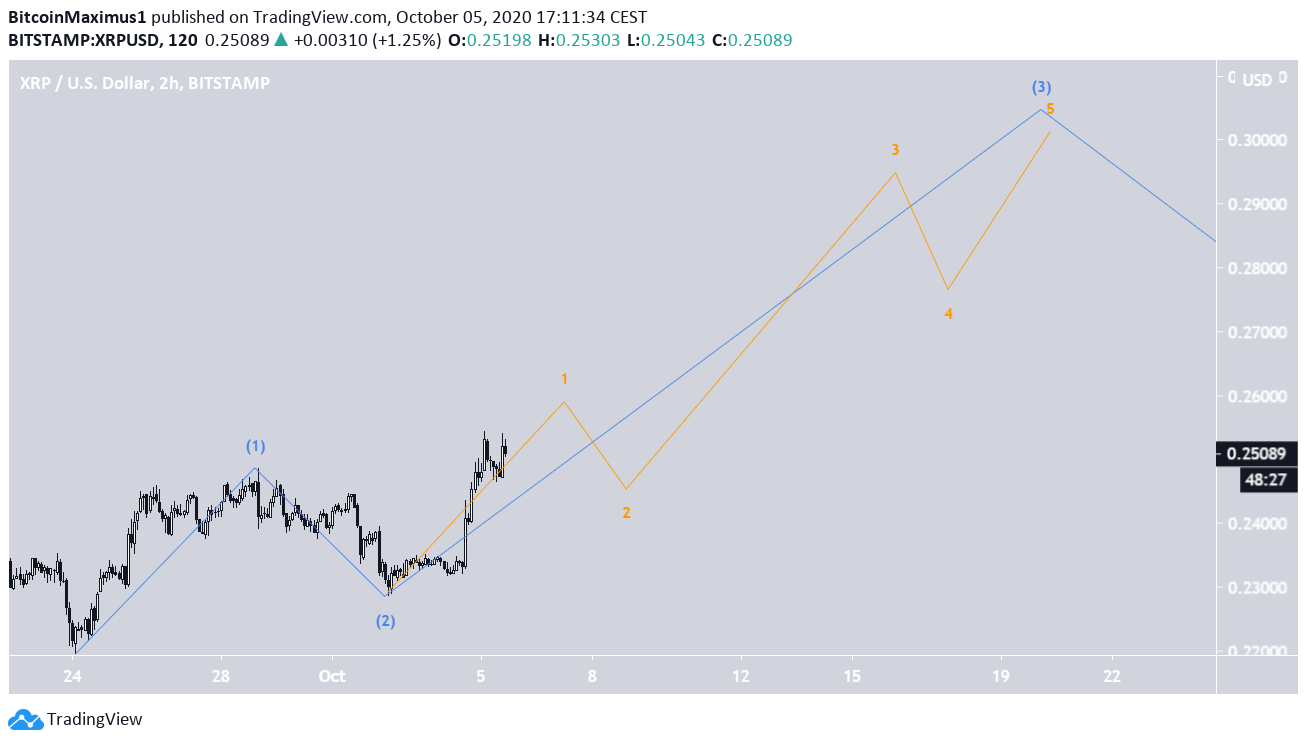
Wave Count
Cryptocurrency trader @davecrypto83 outlined an XRP chart, stating that the price will rally towards $0.25.
In BeInCrypto’s previous analysis, we outlined a long-term count, which suggests that the price completed wave 4 during the previous Sept. 24 low and has now begun wave 5 (shown in black below).
A target near $0.36 is given for the end of the move by projecting the length of wave a (white) to the bottom of b, or by using the 4.61 Fib level of wave 1 (black), which is considered the maximum Fib level a 5th wave can reach if it extends.
A fall below the wave 1 high at $0.213 would invalidate this particular wave count.
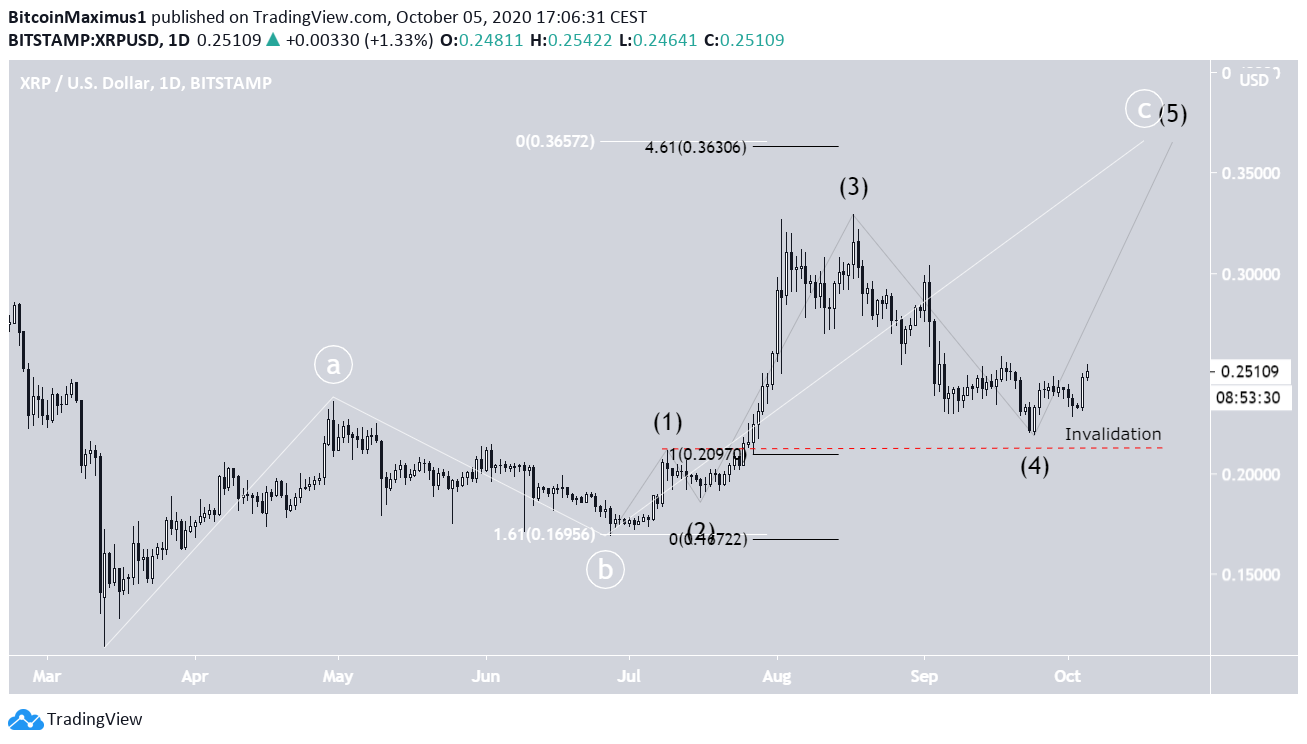
If the count is correct, the price has completed wave 1 of a bullish impulse (in blue below), which will eventually complete the previous wave 5.
If so, the price is now in an extended third wave.
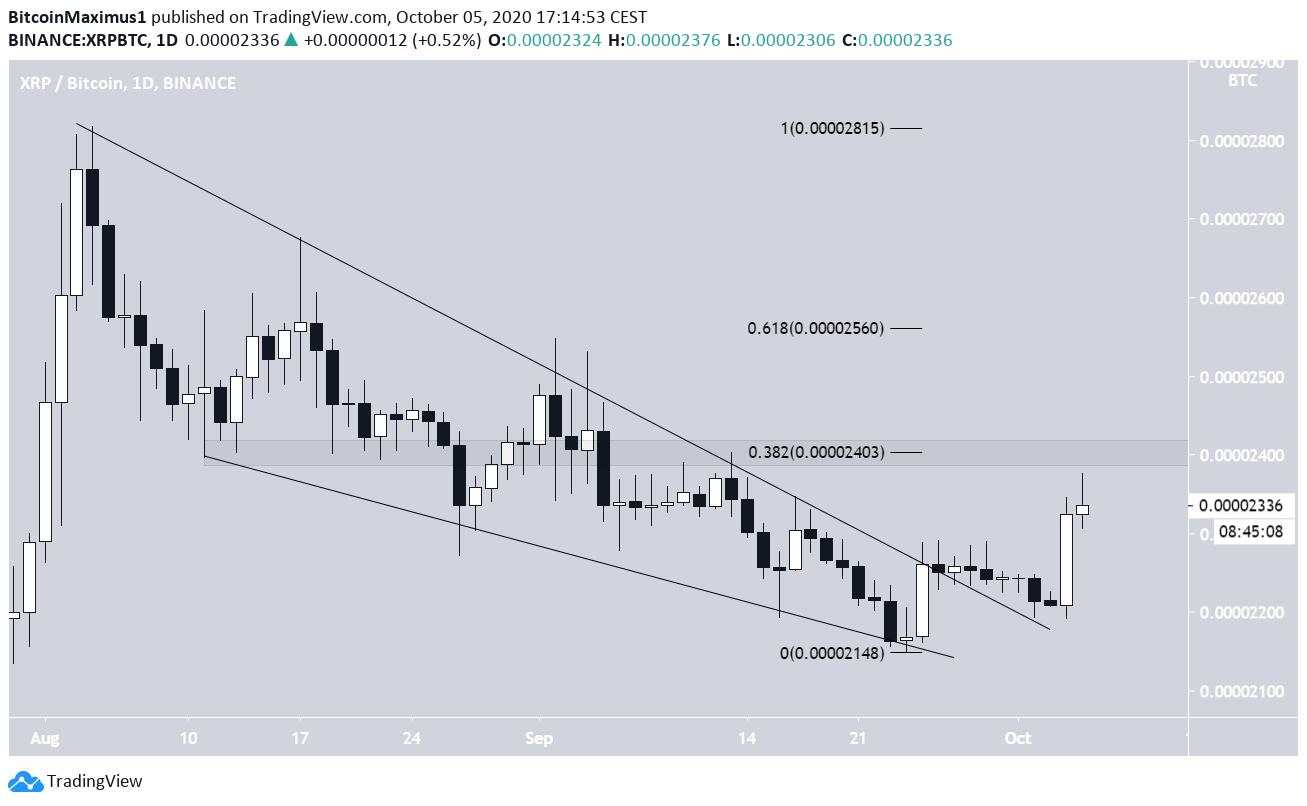
XRP/BTC
The XRP/BTC price had been trading inside a descending wedge since the beginning of August. The descending wedge is considered a bullish reversal pattern, and the price successfully broke out on Sept 24.
After consolidating for some time, XRP began to move upwards and created a bullish engulfing candlestick on Oct 4.
The price is moving upwards, with the two closest resistance levels found at 2400 and 2560 satoshis.
For BeInCrypto’s Bitcoin analysis, click here!
Disclaimer: Cryptocurrency trading carries a high level of risk and may not be suitable for all investors. The views expressed in this article do not reflect those of BeInCrypto.


