See More

Is Ripple About to See Another Bearish Drop? (XRP/USD & XRP/EUR Price Analysis for 04/23/19)

3 mins
Updated by Valdrin Tahiri
Join our Trading Community on Telegram
At BeInCrypto, we publish regular price analyses and predictions for XRP. In our Apr 19 analysis of XRP/USD, we predicted that XRP—also known as Ripple— would experience slight price decreases. Our prediction was validated on Apr 23 when the price reached lows close to the support line we defined.  In this analysis, we take a analyze XRP/USD($) and XRP/EUR(€) to predict future short-term price fluctuations.
On Apr 3, 2019, Ripple reached a high close to $0.386 and €0.338. A rapid drop followed. Lows close to $0.313 and €0.278 were reached on Apr 15.
A rapid increase was followed by a gradual decrease. Prices began a slight reversal on Apr 21.
Market Outlook
XRP/USD & XRP/EUR Prices: Apr 3 – Apr 23

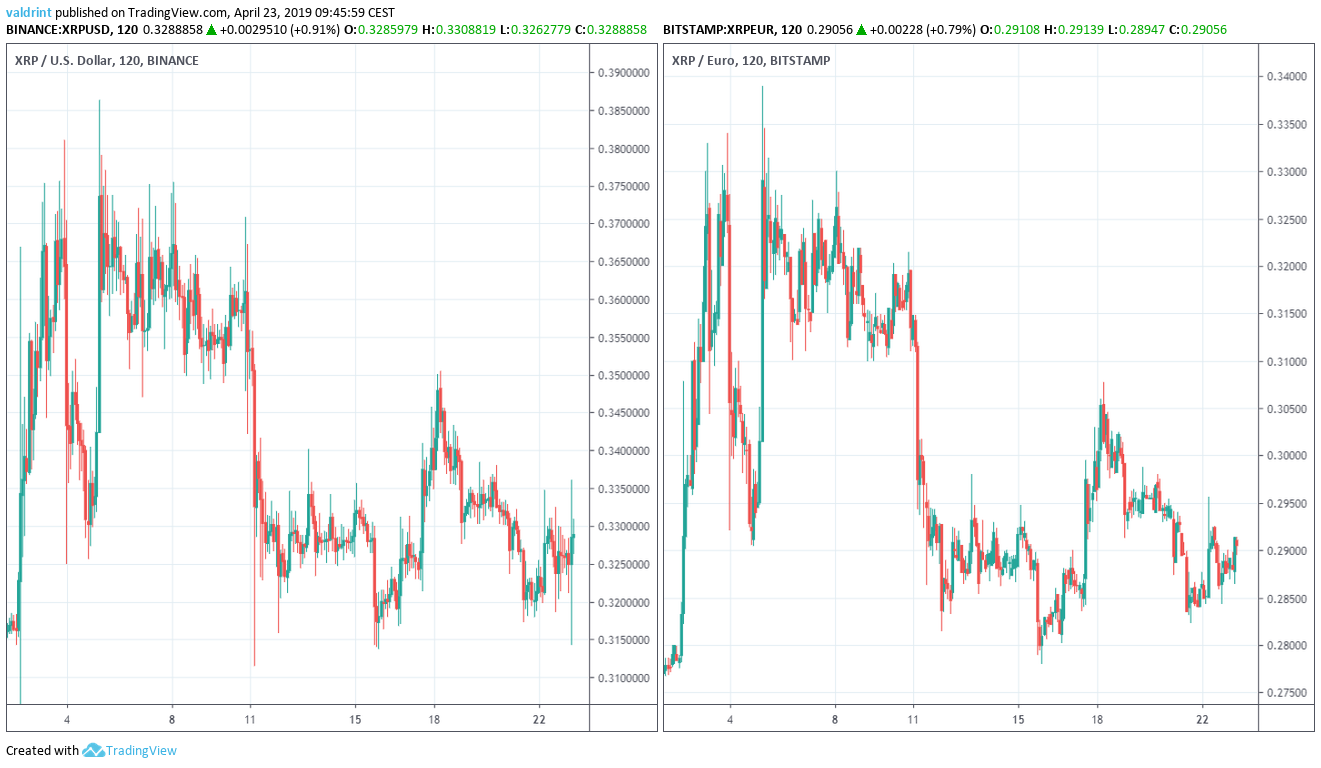
At the time of writing on Apr 22, XRP is trading slightly below $0.33 and €0.295. Will the price of Ripple continue increasing or can we expect price to fall further? Let’s find out:

XRP (XRP): Highlights and Trends For April 23, 2019

  • The price of XRP has been on a downtrend since Apr 6.
  • It is trading inside a descending wedge.
  • The moving averages have recently made a bearish cross.
  • Ripple is trending along a long-term support line.
  • There is resistance near $0.35/€0.3 and support near $0.30/€0.265.

Descending Wedge

The price of XRP/USD on Binance is analyzed at two-hour intervals from Apr 4 to Apr 23 to help determine current trading patterns. We do not include euros in this section because only one trading pair is needed to generate the current trading pattern. Both XRP/USD and XRP/EUR are discussed in the final two sections.
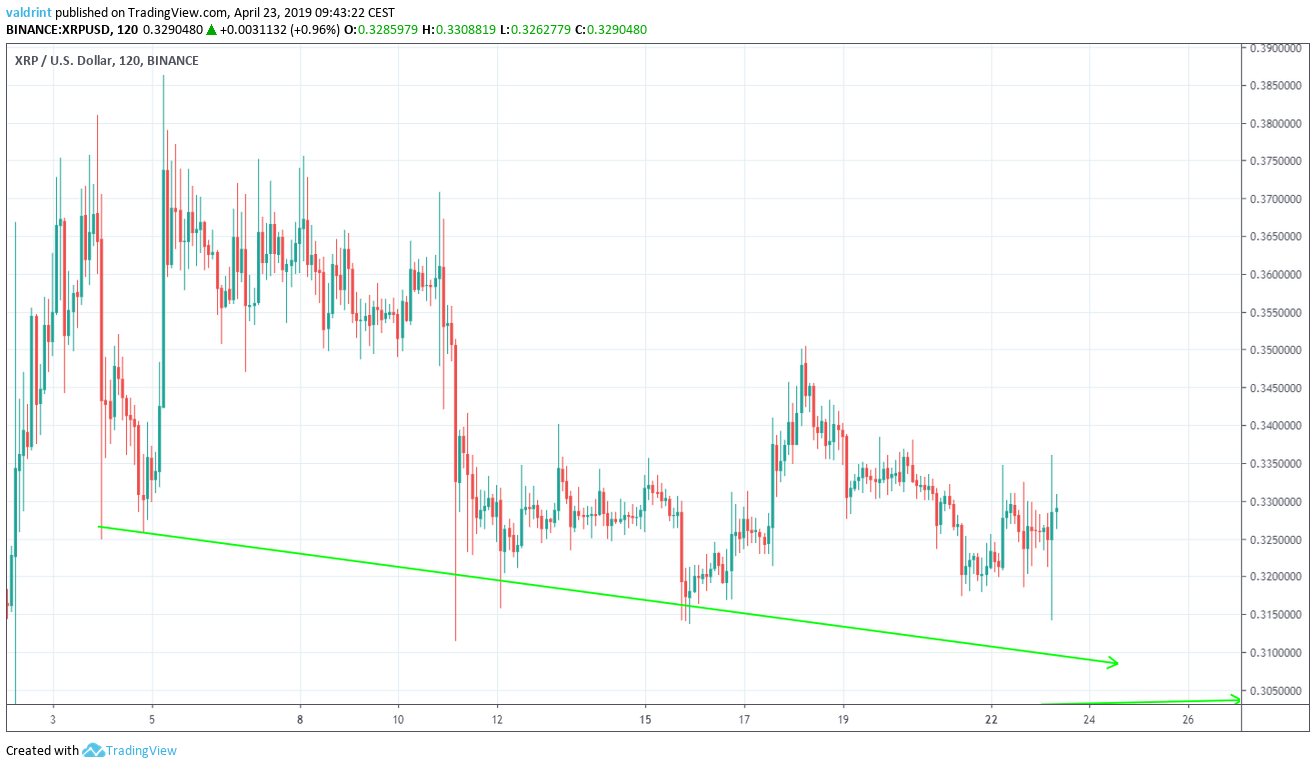
On Apr 4, the price reached a  low of $0.325. Several market cycles were subsequently completed. The price has created lower lows each time. Tracing these lows gives us a descending support line: XRP Support Line 
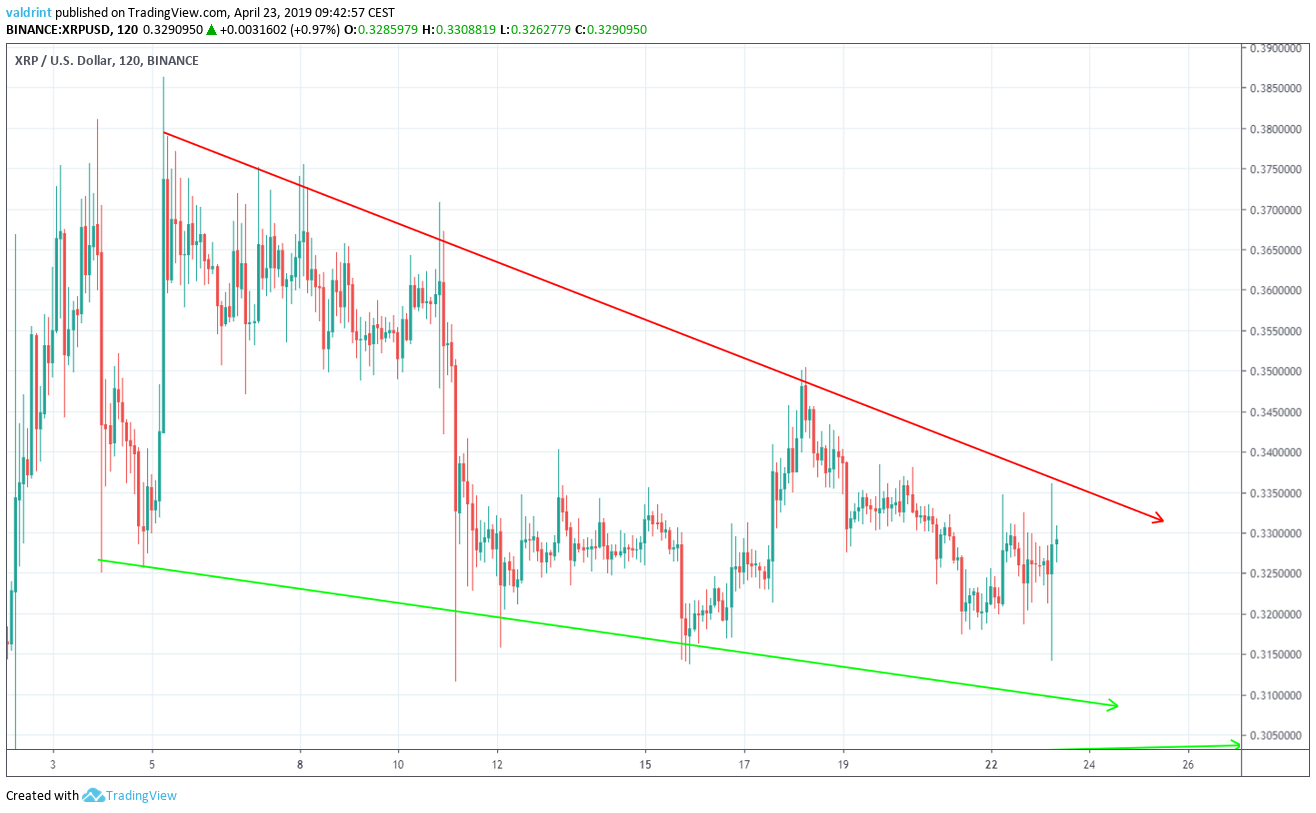
On Apr 5, the price reached a high of $0.386. At the time of writing, several lower highs had been reached. A descending resistance line is created by tracing these highs. Taken together, the resistance and support lines combine to create a descending channel:

XRP Descending WedgeTechnical Indicators

To better assess possible future price movements, price is analyzed on one-day intervals from December 2018 to April 2019 alongside the MACD and moving averages (MAs).
The moving average convergence divergence (MACD) is a trend indicator that shows the relationship between two moving averages (long and short-term) and the price.
Moving averages are tools used in technical analysis to smooth out price action. It is a lagging indicator since it is based on past prices. The relationship between short and long-term moving averages can help in identifying the beginning and end of a trend.
They are traced in the chart below:
XRP Moving Averages
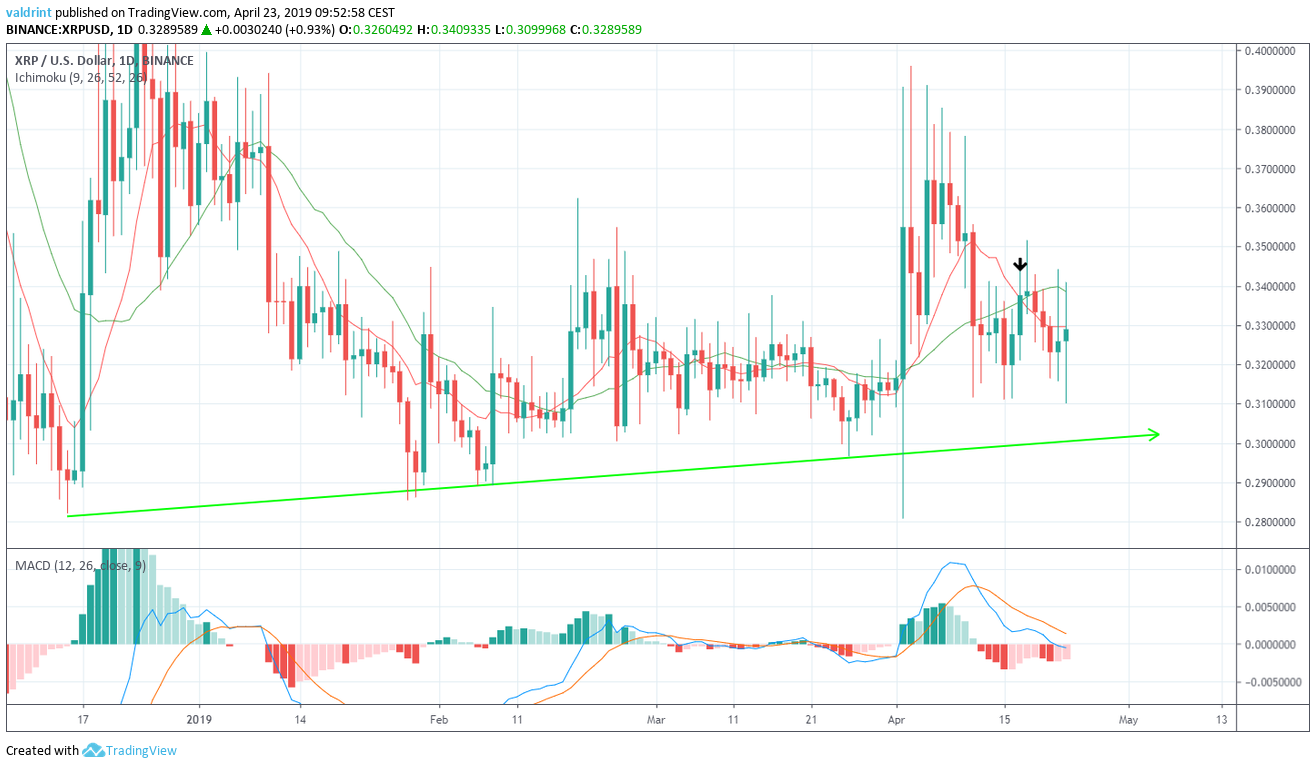
On Apr 16, the 10-day moving average crossed below the 21-day MA. This is known as a bearish cross and often precedes price decreases. On Apr 23, the MACD line crossed into negative territory. This strengthens the validity of the previous bearish cross. Based on these indicators,  we believe the price will continue to decrease towards the support line traced above.

Reversal Areas

We now incorporate resistance areas into our analysis to better determine future price fluctuations.
Resistance and support areas are created when the price visits the same level several times. They can act as an area of reversal in case a breakdown or a breakout occurs.
One resistance area is traced below for both XRP/USD and XRP/EUR in the graphs below:
XRP Resistance
XRP/EURO Resistance
XRP Reversal
XRP/USD Resistance
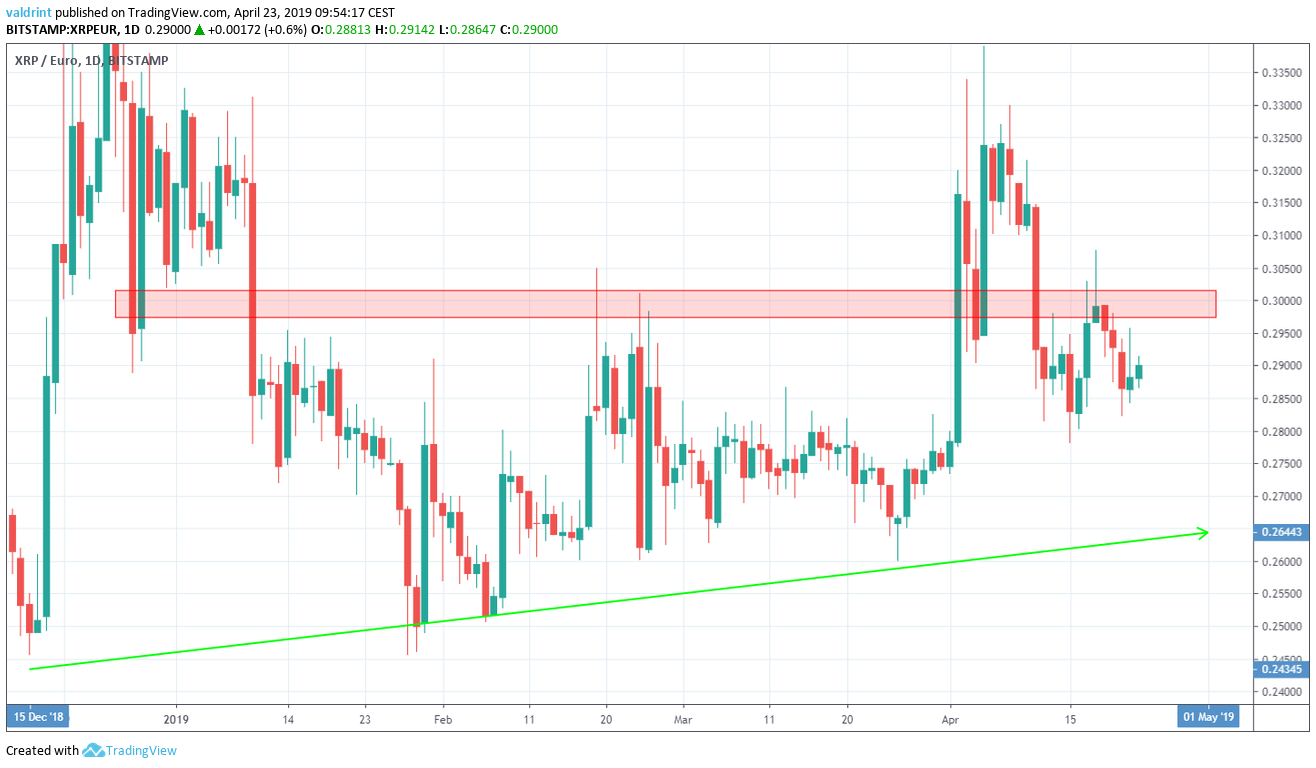
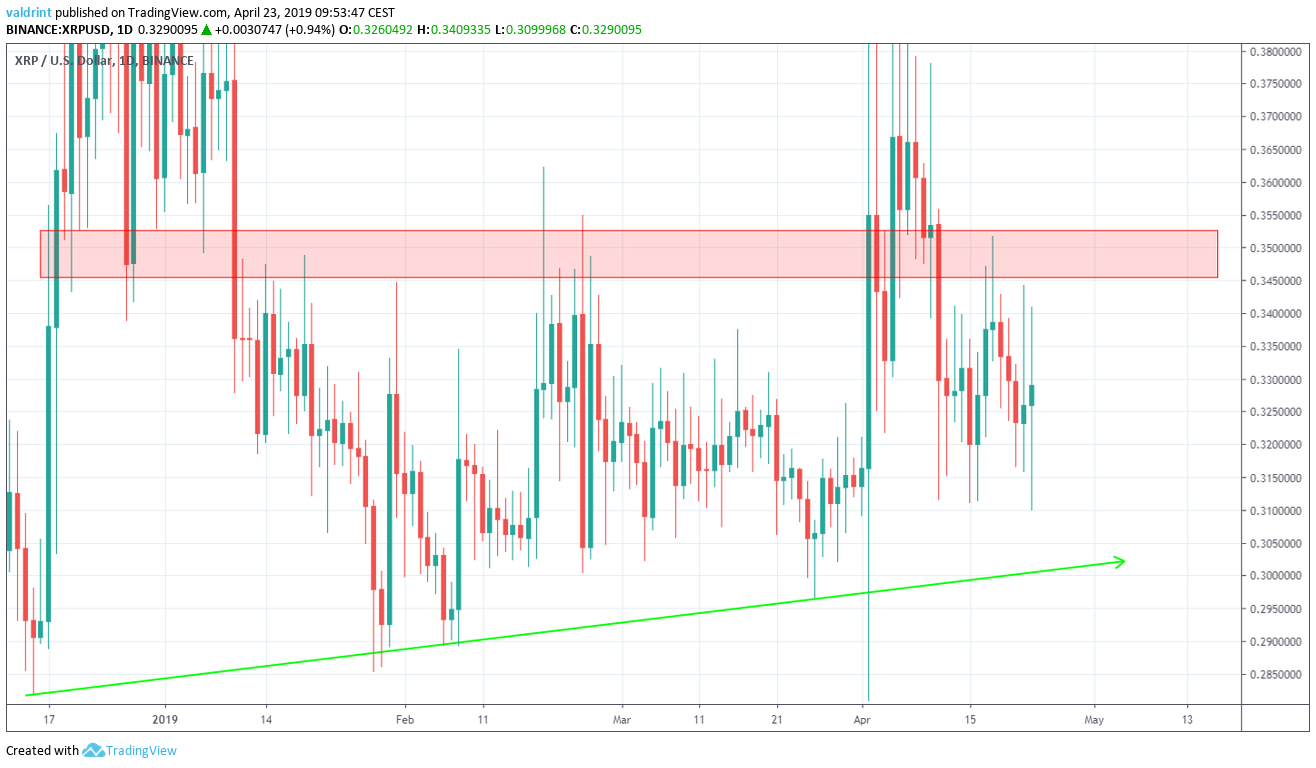
The closest resistance area is found near $0.35/€0.3 was reached on Apr 15. Since then, the price has been trading below the resistance. While it is possible that slight price increases may bring XRP back to this level, price decreases from this level appear likely. XRP may drop to the support line in the near future. Lows around $0.3/€0.265 might be expected.

Summary of Analysis

Based on this analysis, the price of Ripple is likely to decrease at the rate predicted by the wedge and eventually reach the long-term support line. While slight price gains toward the resistance area are possible, they would likely precede greater losses. For price 2019, 2020, and five-year XRP/USD price predictions click on the green button below:

Disclaimer: This article is not trading advice and should not be construed as such. Always consult a trained financial professional before investing in cryptocurrencies, as the market is particularly volatile.
Top crypto projects in the US | April 2024

Trusted

Disclaimer

In line with the Trust Project guidelines, this price analysis article is for informational purposes only and should not be considered financial or investment advice. BeInCrypto is committed to accurate, unbiased reporting, but market conditions are subject to change without notice. Always conduct your own research and consult with a professional before making any financial decisions. Please note that our Terms and ConditionsPrivacy Policy, and Disclaimers have been updated.

Valdrin-Tahiri.jpg
Valdrin Tahiri
Valdrin discovered cryptocurrencies while he was getting his MSc in Financial Markets from the Barcelona School of Economics. Shortly after graduating, he began writing for several different cryptocurrency related websites as a freelancer before eventually taking on the role of BeInCrypto's Senior Analyst. (I do not have a discord and will not contact you first there. Beware of scammers)
READ FULL BIO
Sponsored
Sponsored