


The XRP (XRP) price broke down from the $0.385 horizontal support area. It could fall toward the support line of a longer-term symmetrical triangle. Depending on how the ongoing case with the Securities and Exchange Commission (SEC) gets resolved, the long-term outlook could be positive.
XRP is the native token of Ripple Labs, created by Jed McCaleb and Chris Larsen. It acts as a payments network for global payments, offering nearly instantaneous XRP transactions at a negligible cost.
XRP Price Breaks Down From Key Short-Term Level
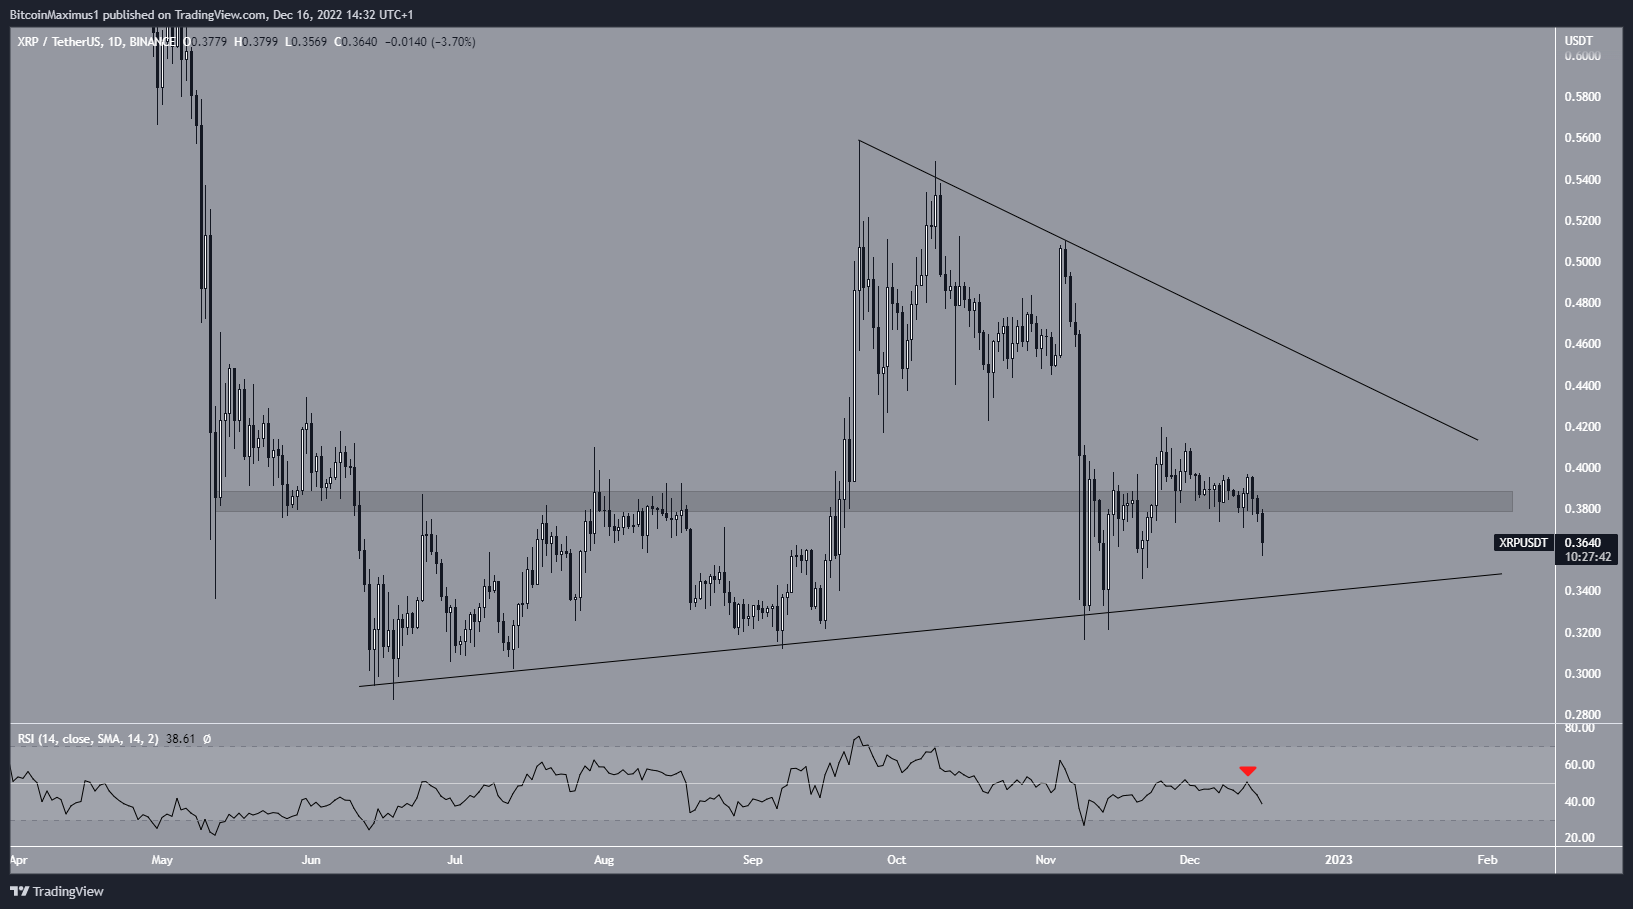
The XRP price has moved upward alongside an ascending support line since June 13. The increase culminated with a high of $0.56 on Sept. 23. The XRP price has fallen below a descending resistance line since. Together the support and resistance lines create a symmetrical triangle, which is considered a neutral pattern.
The Ripple movement since Nov. 25 initially seemed bullish since the price traded above the $0.385 horizontal support area. However, the ensuing drop caused a breakdown on Dec. 14 and a daily close below the area during the next 24 hours. The breakdown was also combined with an RSI rejection from the 50 line (red icons). These are both considered bearish signs.
As a result, the most likely XRP price forecast is a drop toward the triangle’s support line. Reaching a daily close above $0.385 would invalidate this bearish outlook.
Despite the bearish outlook, positive XRP news could come soon. XRP, which is a digital asset that serves as a native token of Ripple Labs, is in an ongoing legal battle with the Securities and Exchange Commission (SEC). Ripple’s legal team made their final submission on Dec. 2, arguing that the SEC failed to prove the existence of an investment contract. A positive resolution of the case could also have a positive long-term effect in the XRP price. However, it is worth mentioning that the SEC already won a legal battle against LBRY and deemed their tokens as securities.
Long-Term Structure Still Intact
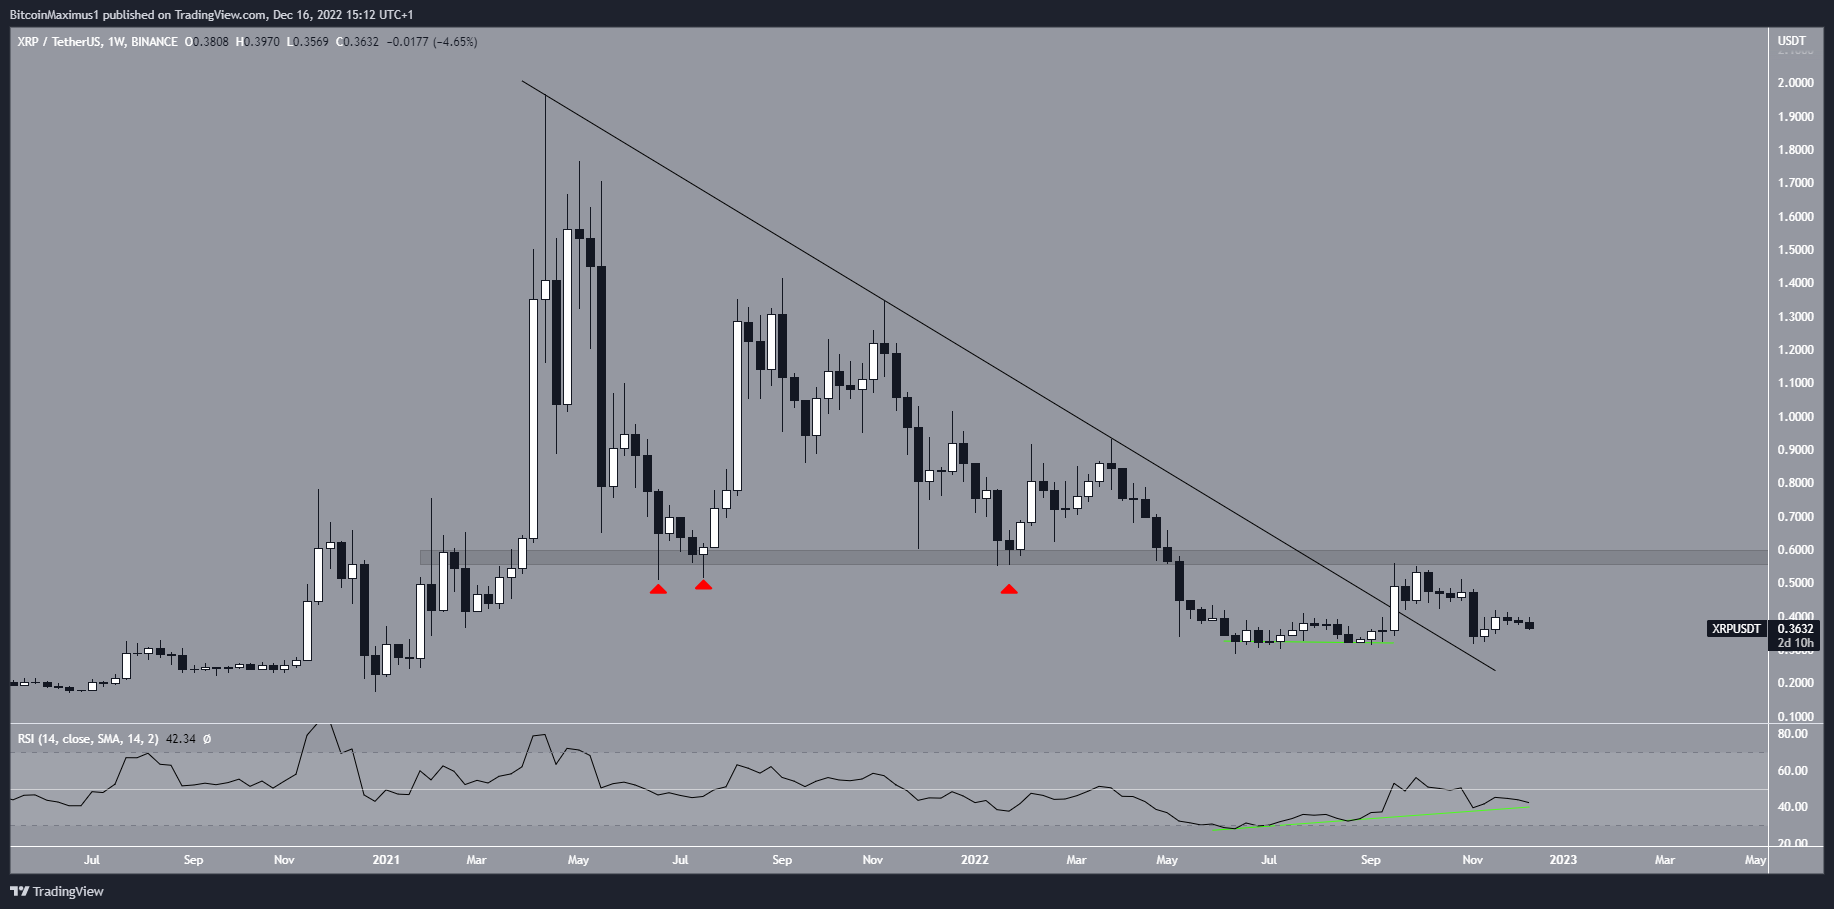
Despite the bearishness from the daily time frame, the bullish structure in the weekly time frame is still intact. The XRP price broke out from a long-term descending resistance line and validated it as support afterward.
More importantly, the bullish divergence trendline (green) in the weekly RSI is still intact. The divergence preceded the upward movement that caused the breakout. As a result, the bullish structure can be considered intact as long as the line is in place.
However, an XRP price movement above the long-term $0.58 horizontal area is required for the long-term trend to be bullish.
For BeInCrypto’s latest crypto market analysis, click here.


