
XRP’s market momentum has slowed since Friday, with trading activity cooling and price action moving sideways.
The token, which had seen modest movement earlier in the week, now shows signs of reduced volatility and weakening demand, raising concerns about a potential bearish shift.
XRP Trading Flatlines, But Sellers Could Soon Take Control
Readings from the XRP/USD one-chart show that the altcoin has trended within a narrow range over the past three trading sessions. Since Friday, XRP has faced resistance at $3.30 and found support at $3.22.
This follows a four-day rally between August 3 and 7, during which the token surged by 20%. The current sideways trend indicates reduced market volatility, reflecting a relative balance between buying and selling pressure.
In such phases, the market is often in a “wait-and-see” mode, with traders anticipating a catalyst to determine the next price move.
The decline in volatility is evident in XRP’s Average True Range (ATR), which has dropped by 10% since August 7. The ATR measures the degree of price fluctuation over a set period, and a falling ATR signals calmer market conditions with less volatility.
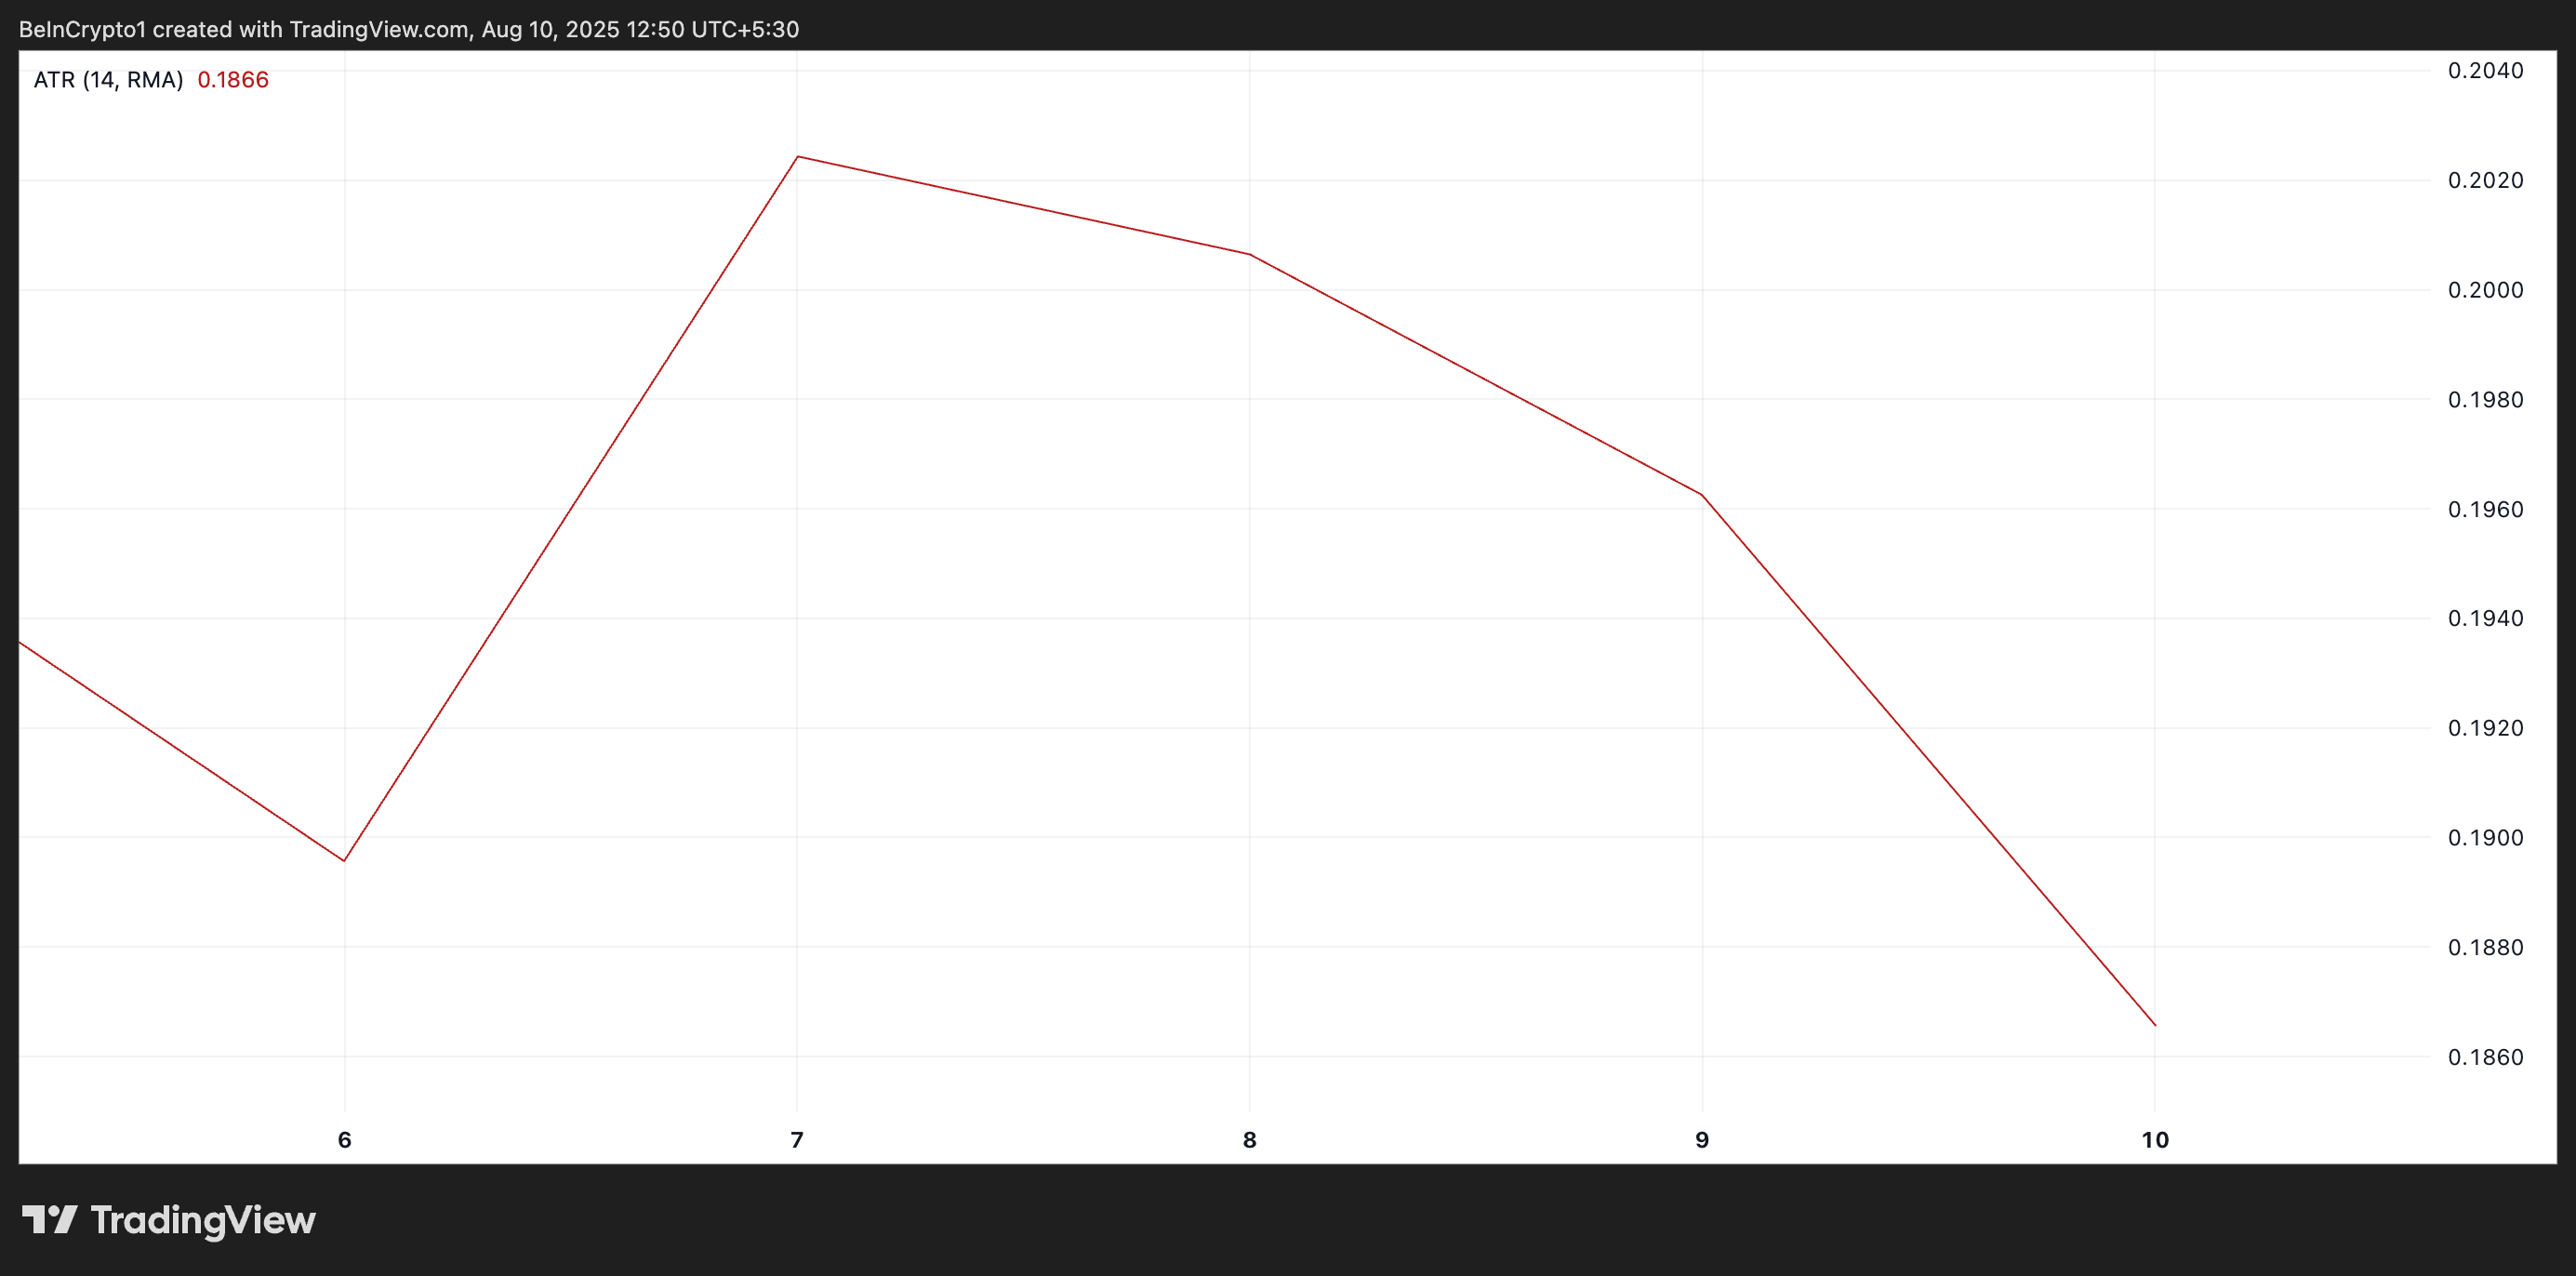
While periods of low volatility suggest market stability, it can also mean traders are becoming less active, often a precursor to a sharp breakout in either direction.
Furthermore, XRP’s Elder-Ray Index strengthens the case for a potential bearish breakout. This indicator measures the strength of buyers (bull power) and sellers (bear power) by comparing price movements against a moving average.
On XRP’s daily chart, the Elder-Ray Index has been posting green histogram bars, representing bullish strength, that have steadily diminished in size over the past few days.
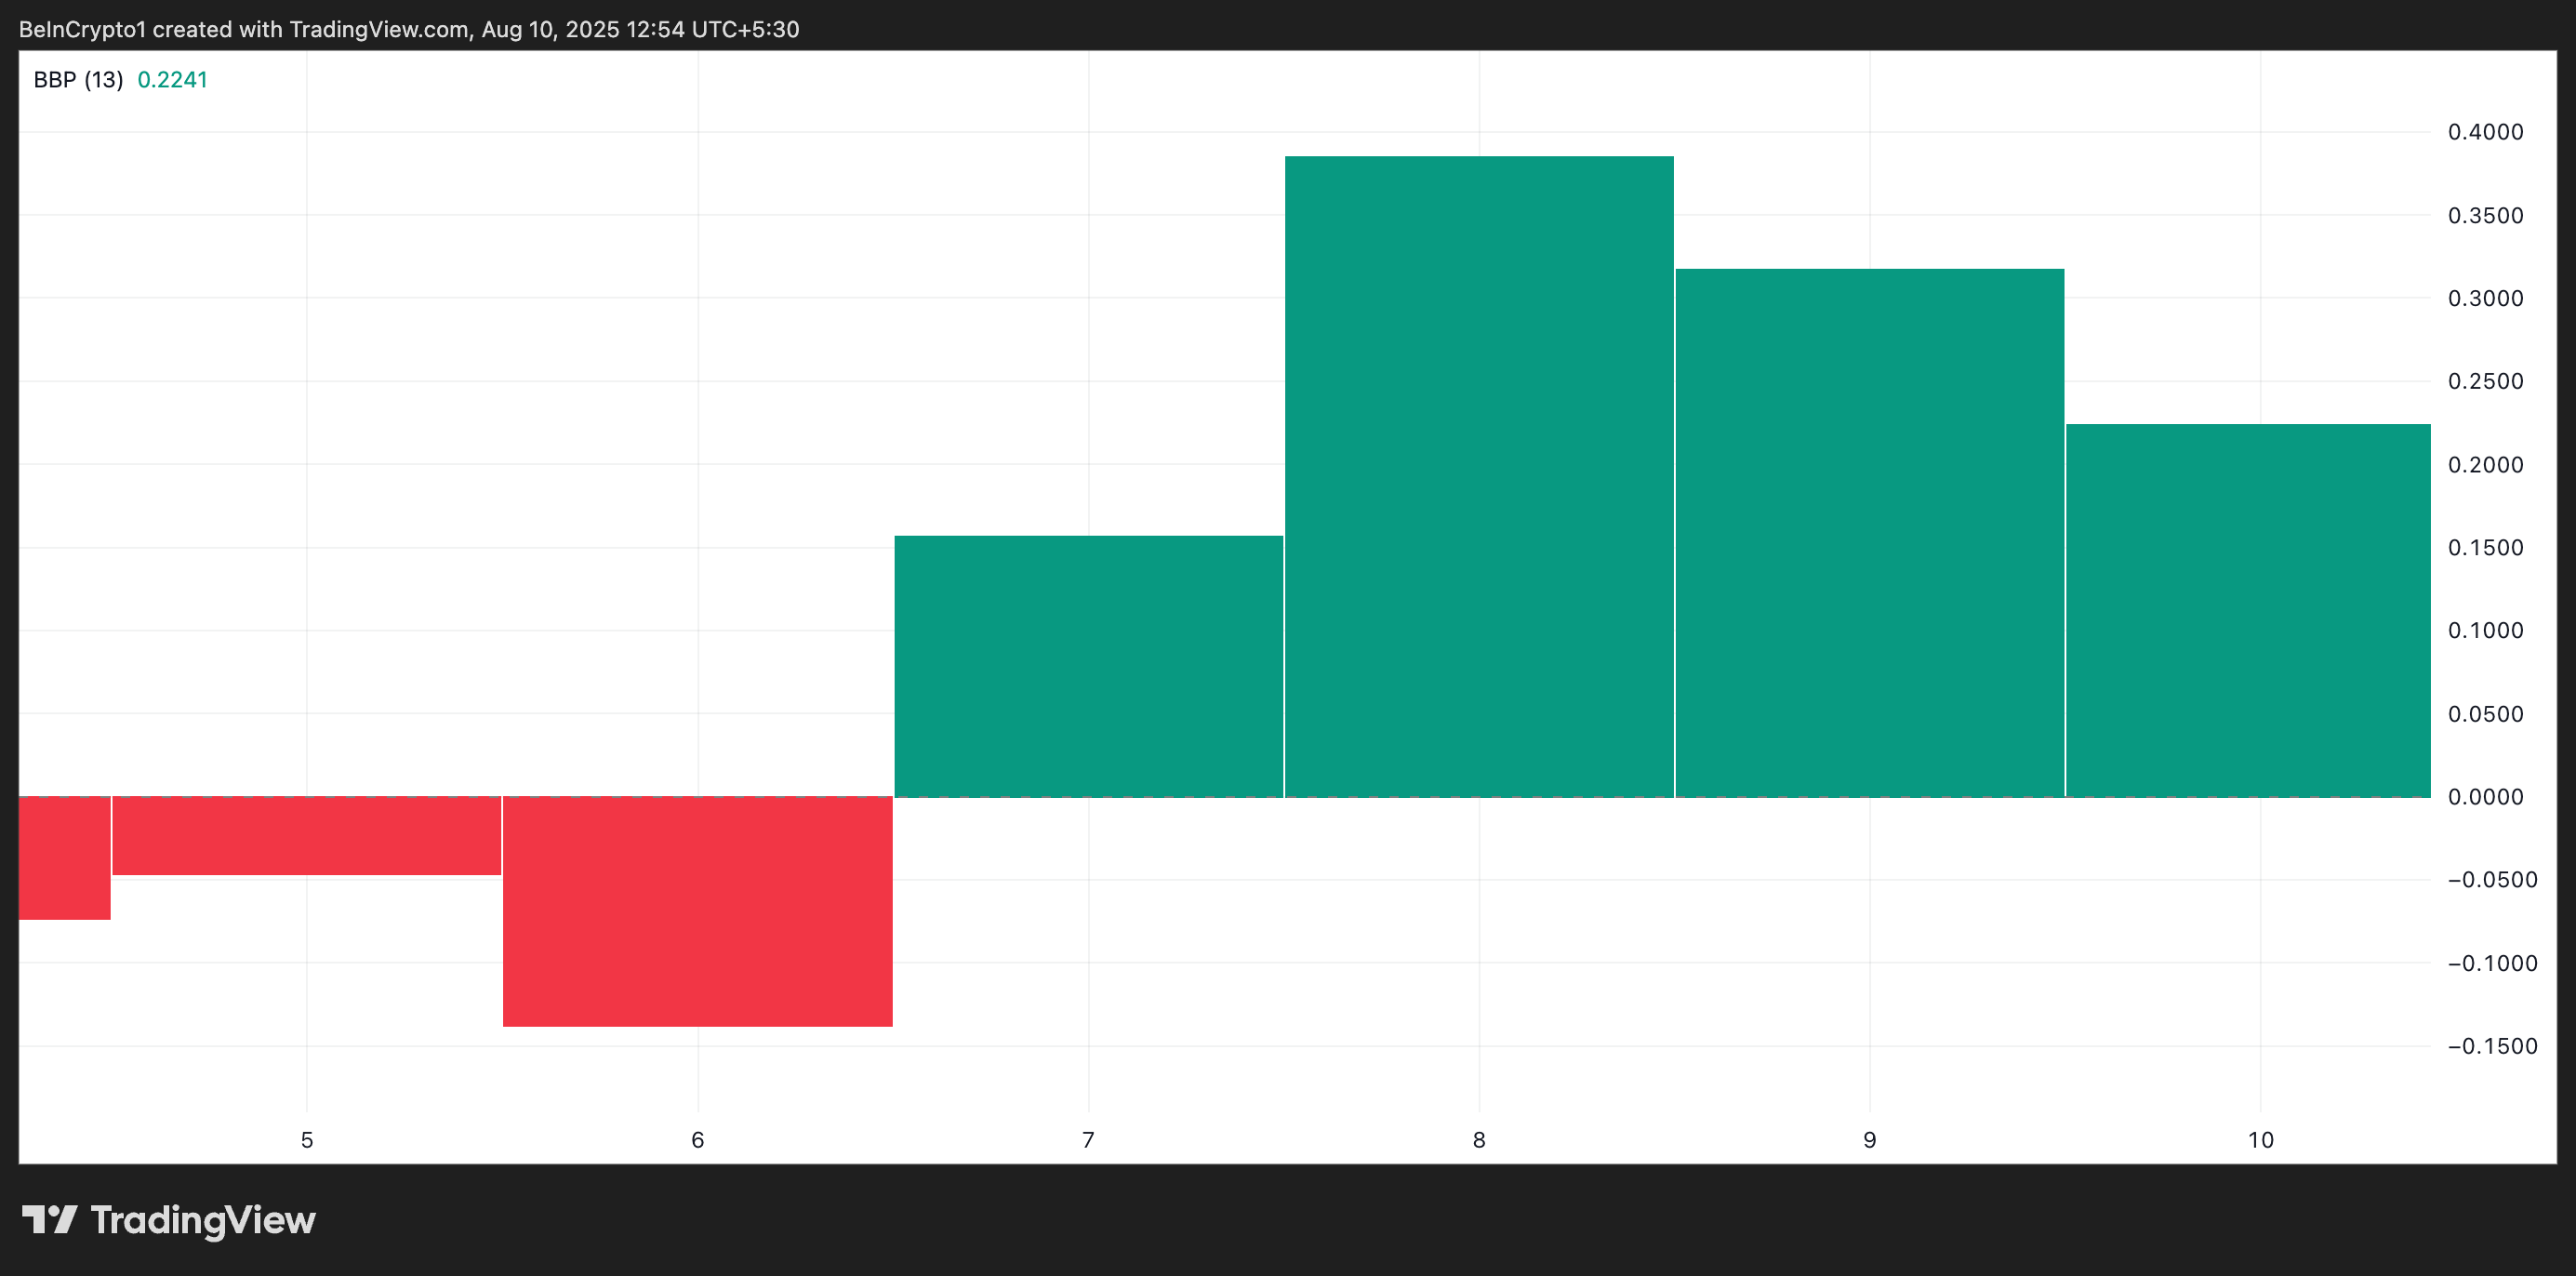
This contraction points to a loss of buying momentum and creates an opening for sellers to assert control and drive XRP’s price lower.
XRP Faces Make-or-Break Moment Between $3.22 and $3.66
Strong sell-side pressure could trigger a break below support at $3.22. If this happens, XRP’s price could deepen its decline and fall to $2.99.
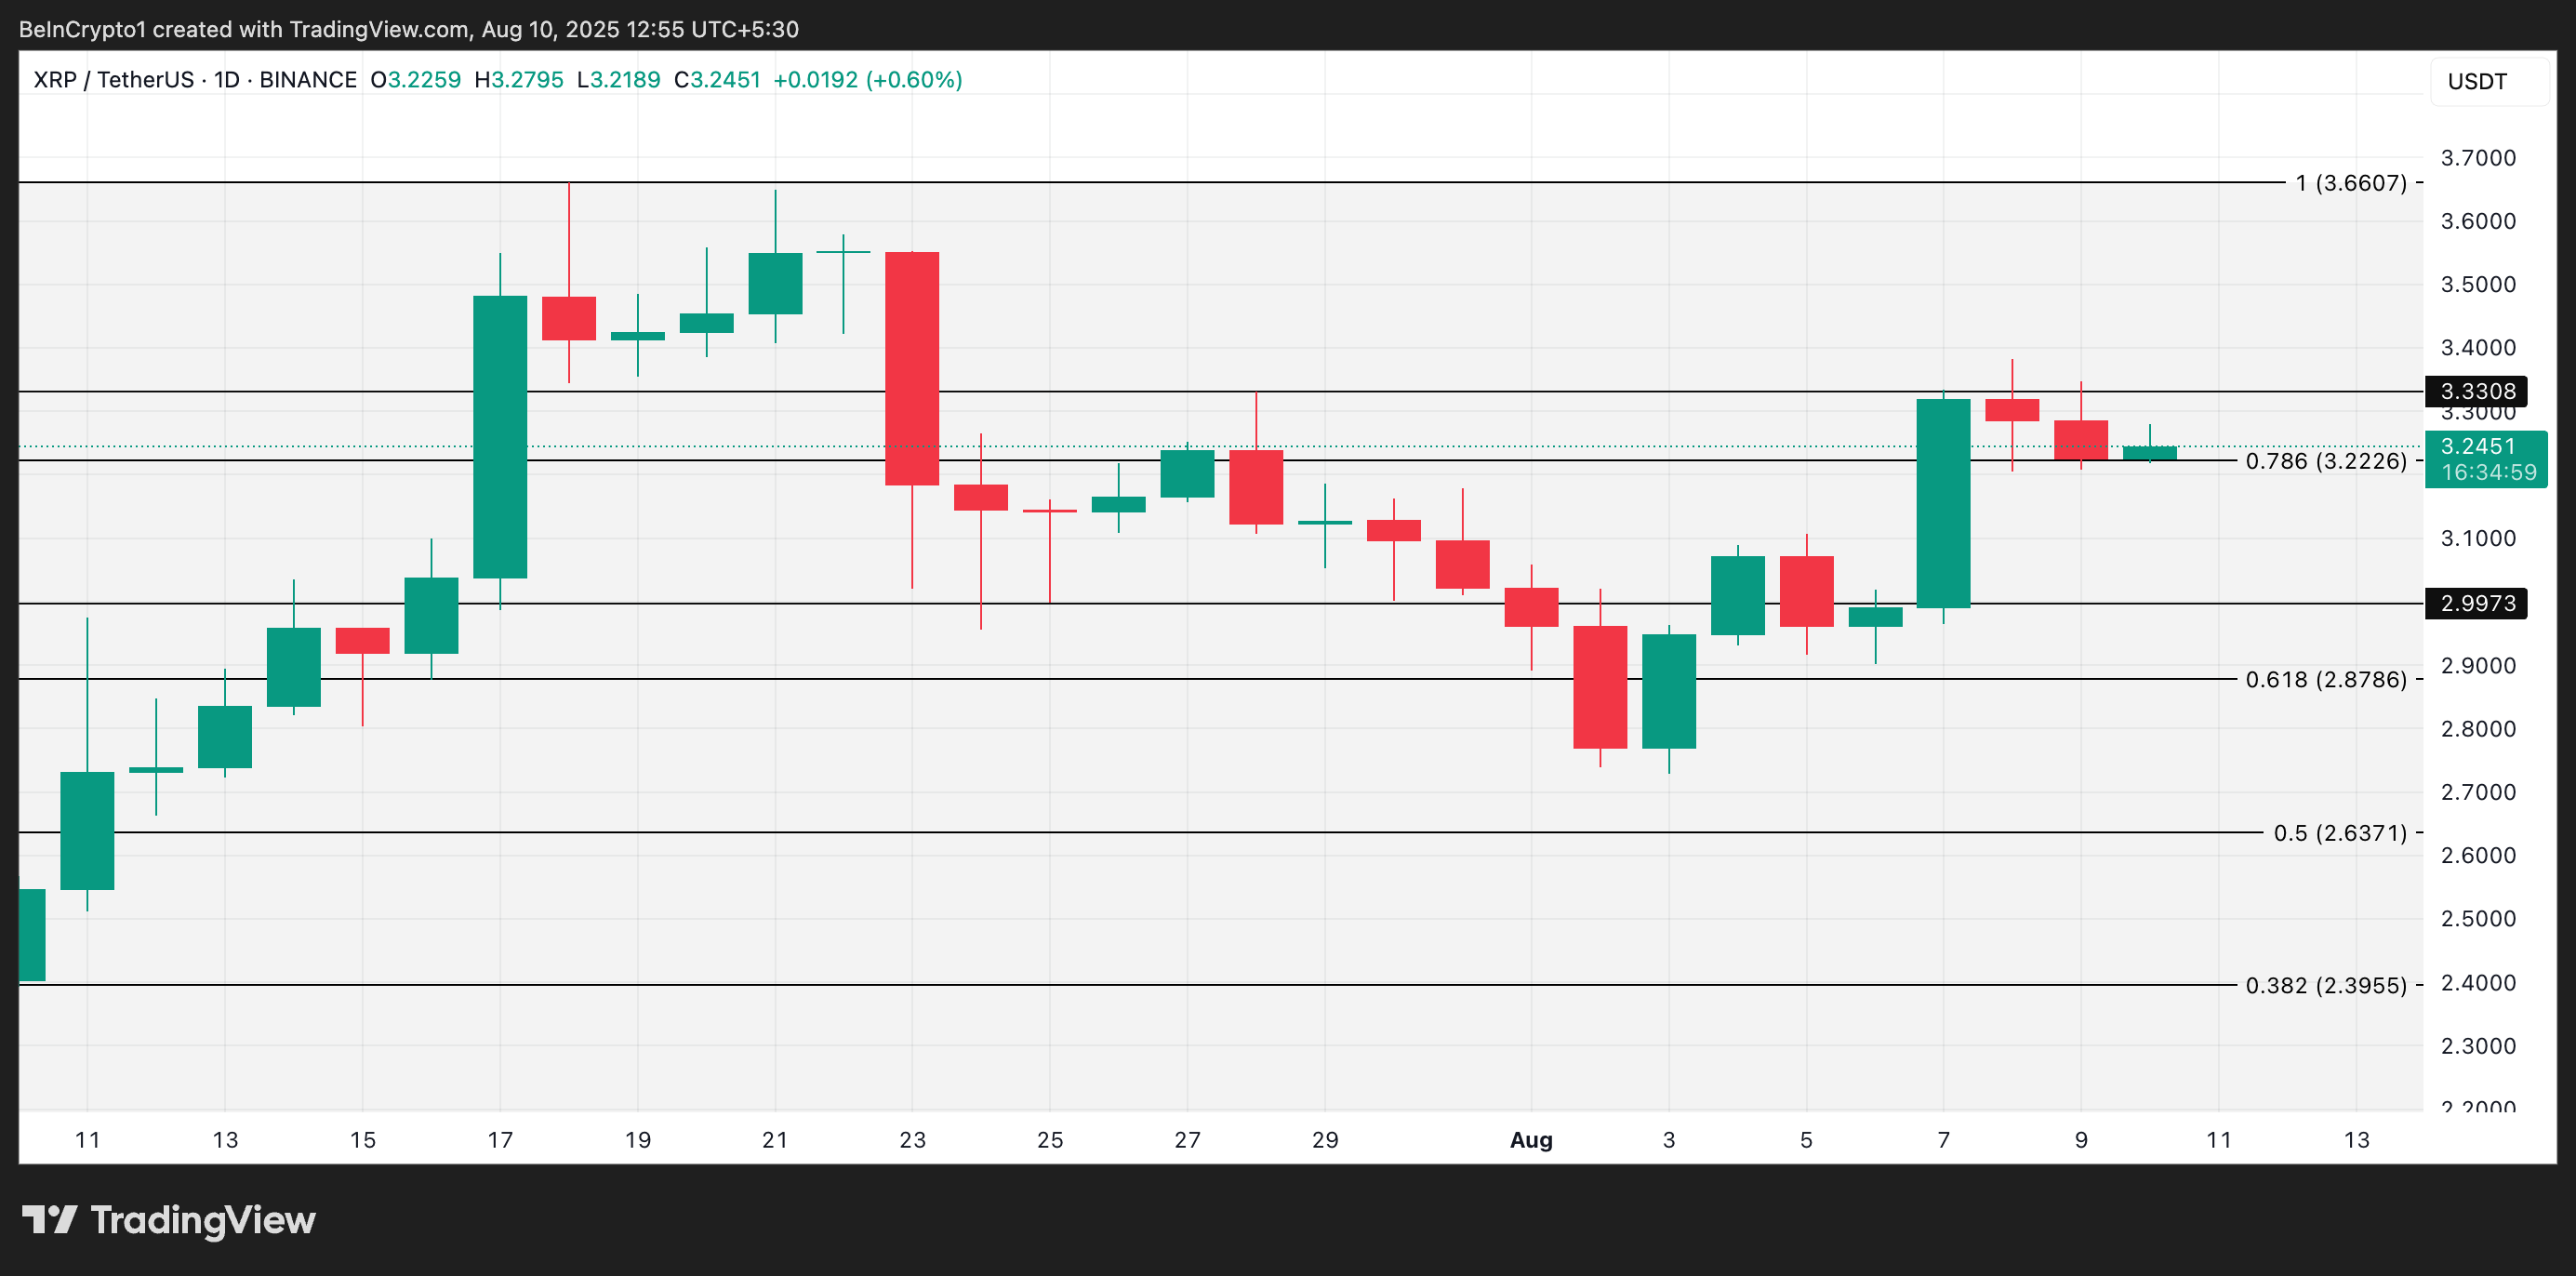
However, XRP could push above the price wall at $3.33 if new demand resurfaces. A successful breakout could open the door for a rally toward $3.66.
