


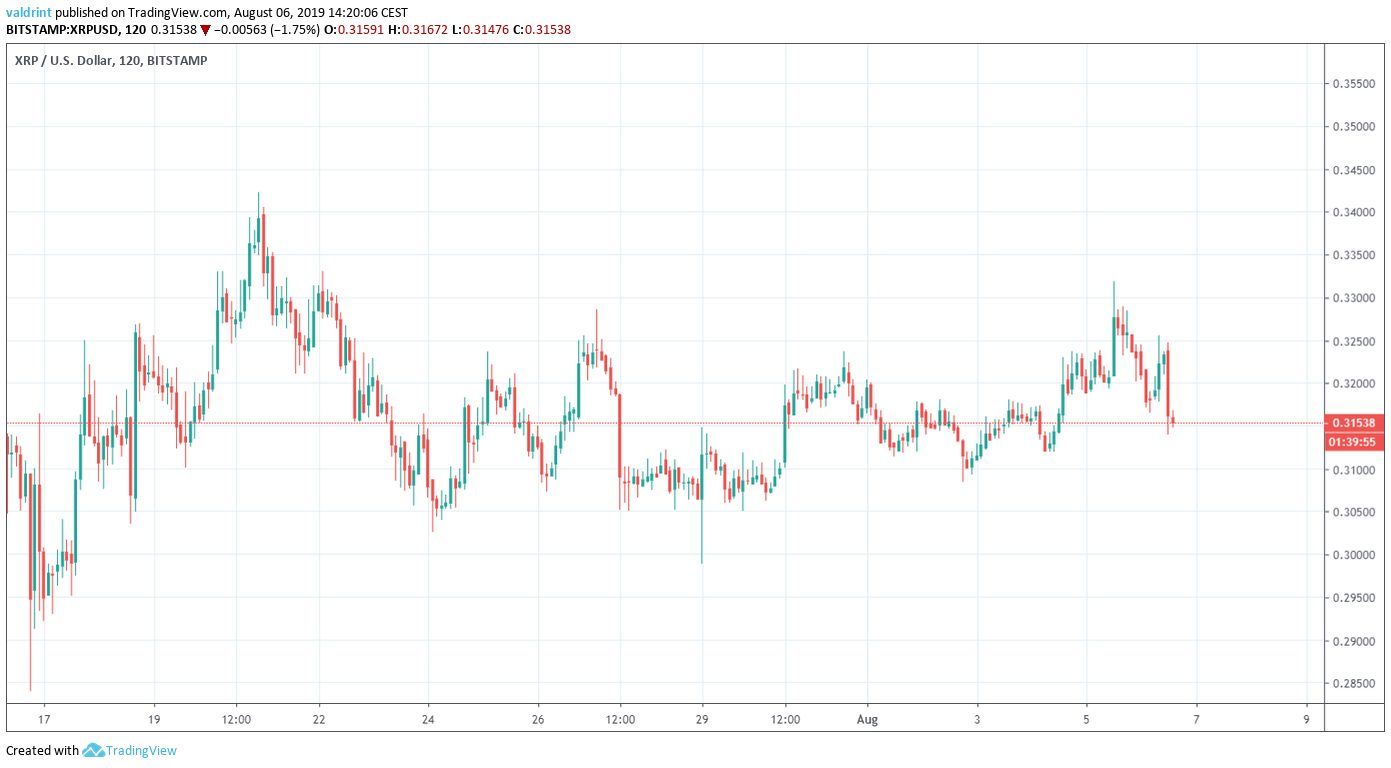
On July 16, 2019, the XRP price reached a low of $0.284. An upward move ensued. On July 20, XRP reached a high of $0.341. Since then, it has been decreasing, trading inside a range between $0.305-$0.33.
How long will XRP continue to trade inside this range? Keep reading below in order to find out.
For our previous analysis, click here.

XRP Price: Trends and Highlights for August 6
- XRP/USD is trading inside a symmetrical triangle.
- The retracement relative to previous decreases has been weak.
- XRP made a bearish reversal candle on August 5.
Current Pattern
A look at the two-hour chart shows that since reaching the aforementioned low on July 16, XRP has been trading inside the symmetrical triangle outlined below.
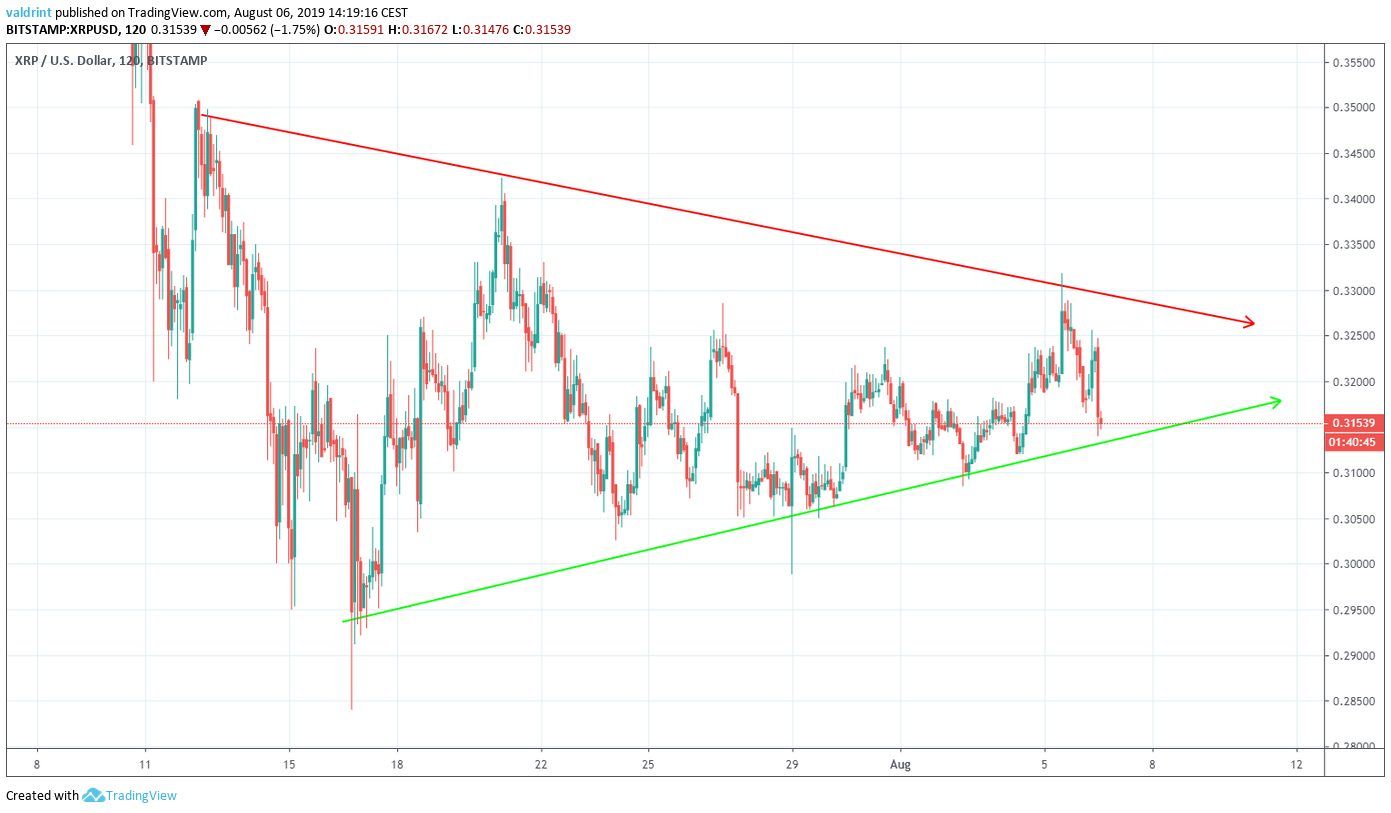
At the time of writing, it was trading right on the support line, which has been touched five times, increasing its significance.
The symmetrical triangle is considered a neutral pattern, making XRP price breakouts and breakdowns equally likely.
Therefore, we will take a look at a longer-term time-frame to see where the price will go next.
Trade XRP and other cryptocurrencies with up to 100x leverage on our partner exchange, BitMEX.
Retracement Level
A look at the daily time-frame shows that the XRP price began its decrease at the end of June, at prices near $0.48
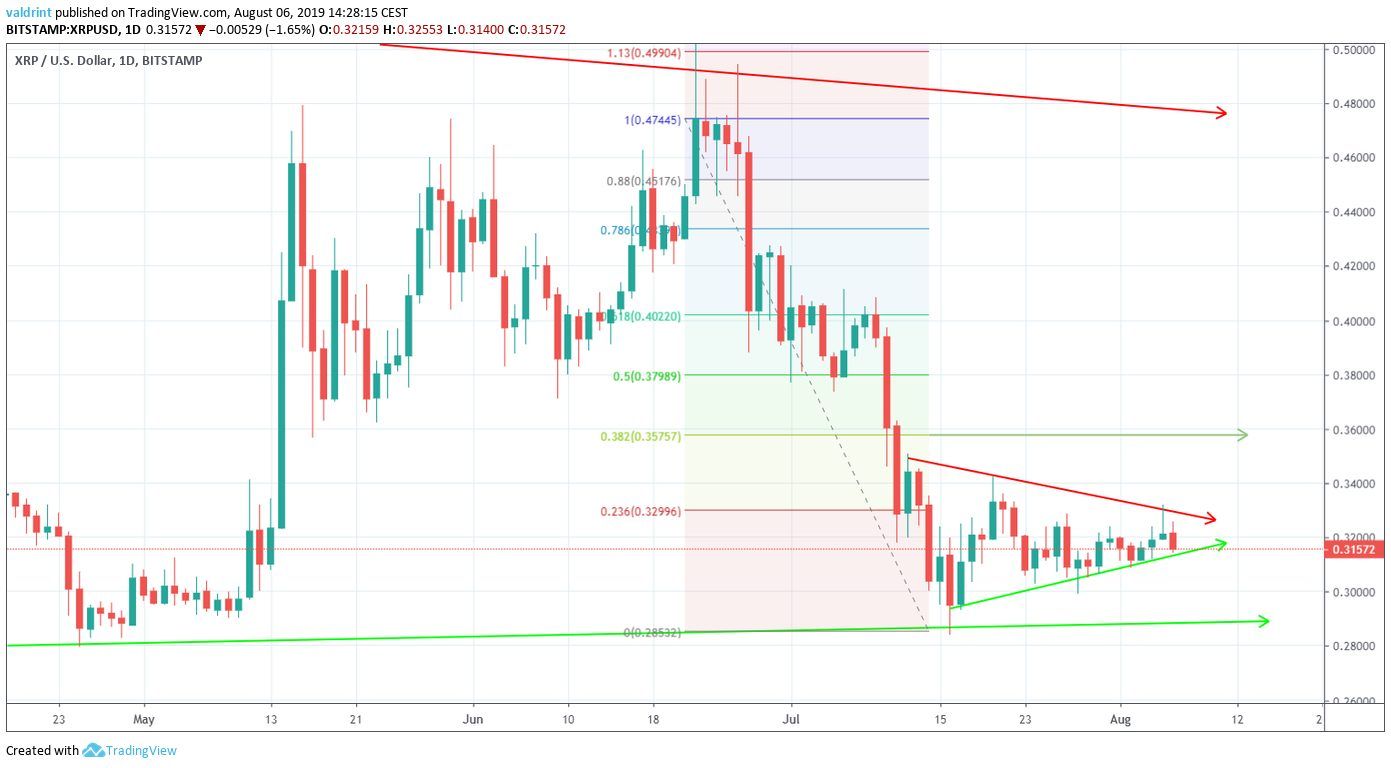
It took the XRP price roughly two weeks to reach a low below $0.30.
An interesting development is that the price has barely retraced.
The 0.382 fib level, which is not an ambitious target for a retracement, has not yet been reached.
Therefore, even if the price were to continue its decrease, we would expect it to make a last gasp upward move and reach the 0.382 level which is at $0.35.
A closer look at the daily candlesticks shows indecision.
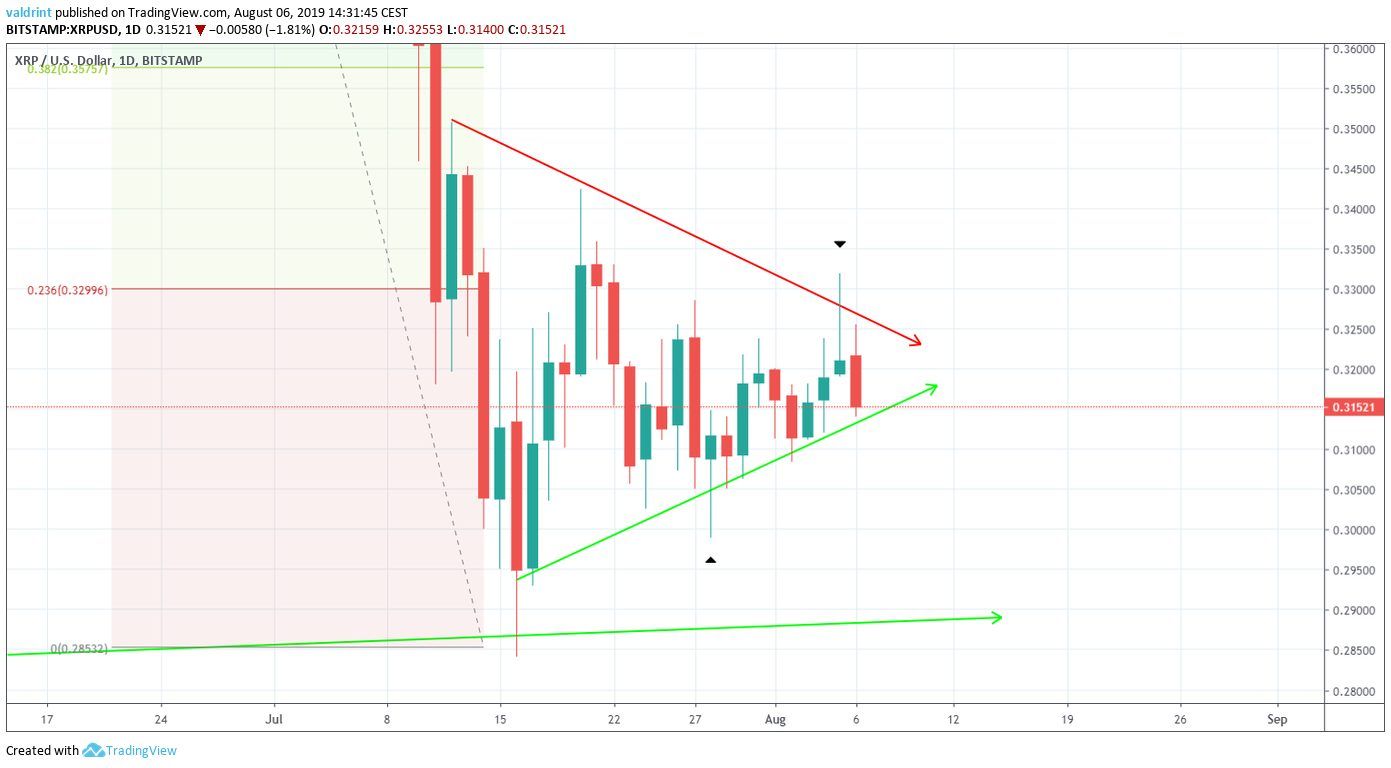
On June 28, the price made a bullish hammer. This is a candlestick with a long lower wick, indicating that there is buying pressure in the market.
However, on August 5, it made a shooting star. It is currently following it with a bearish engulfing candle.
This makes a breakdown more likely.
The XRP price is in a very neutral position, showing both bullish and bearish sentiments which somewhat cancel each other out.
Due to the proximity of the bearish candle, we believe a breakdown is more likely.
XRP Price Summary
The XRP price is trading inside a symmetrical triangle.
Even though the market view is quite neutral, we believe a breakdown to be slightly more likely.
Do you think XRP will reach the support line? Let us know in the comments below.
Disclaimer: This article is not trading advice and should not be construed as such. Always consult a trained financial professional before investing in cryptocurrencies, as the market is particularly volatile.
Images are courtesy of TradingView and Shutterstock.
Interested in trading cryptocurrencies with a multiplier of 100x? Check out our partner exchange, StormGain, to do so!


