


On July 7, 2019, the XRP price reached a high of 3500 satoshis. A rapid decrease ensued. On July 11, the price reached a low of 2779 satoshis. A gradual increase began, which is still ongoing.
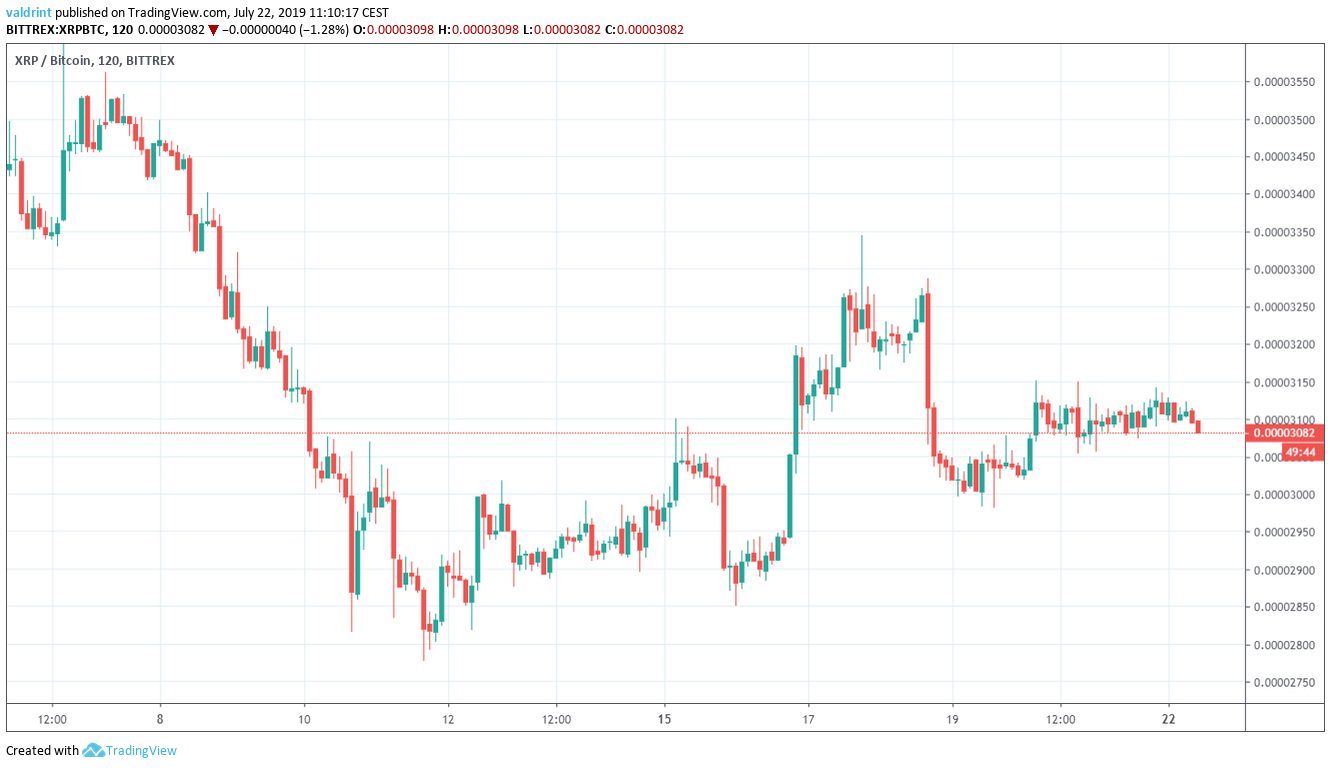
At the time of writing, XRP was trading close to 3100 satoshis.
Where will it go next? Below, we are going to analyze the XRP price in different time-frames alongside technical indicators in order to answer this question.
For our previous analysis, click here.
If you are interested in trading cryptocurrencies with a multiplier of up to 100x on our new partner exchange with the lowest fees, follow this link to get a free StormGain account!
XRP Price: Trends and Highlights for July 22
- XRP/BTC is trading inside a symmetrical triangle.
- There is support at 2850 satoshis.
- There is resistance at 3350 satoshis.
- There is bullish divergence developing in the RSI and the MACD.
- Daily moving averages are slowly turning bullish.
XRP Price in a Symmetrical Triangle
Since reaching a high on July 8, XRP has been trading inside the symmetrical triangle outlined below.
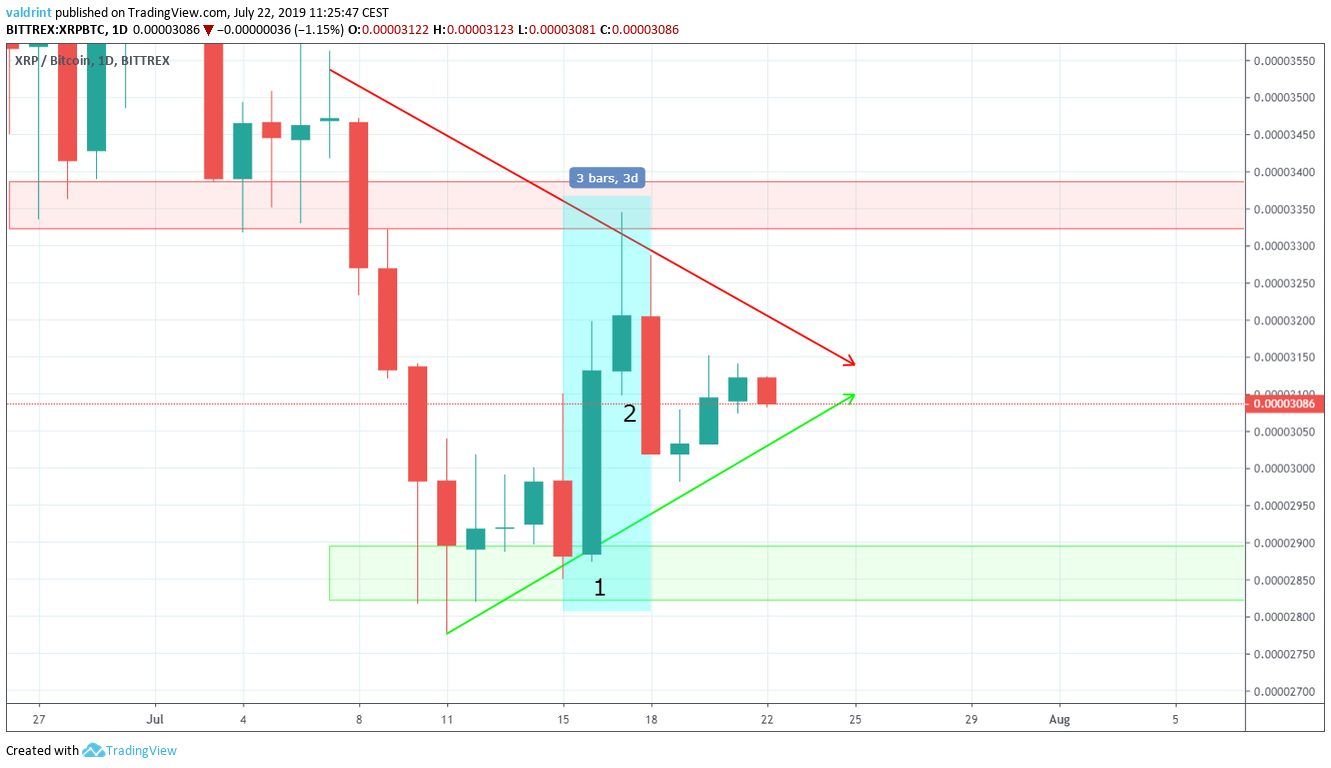
Furthermore, one resistance area is also outlined below:
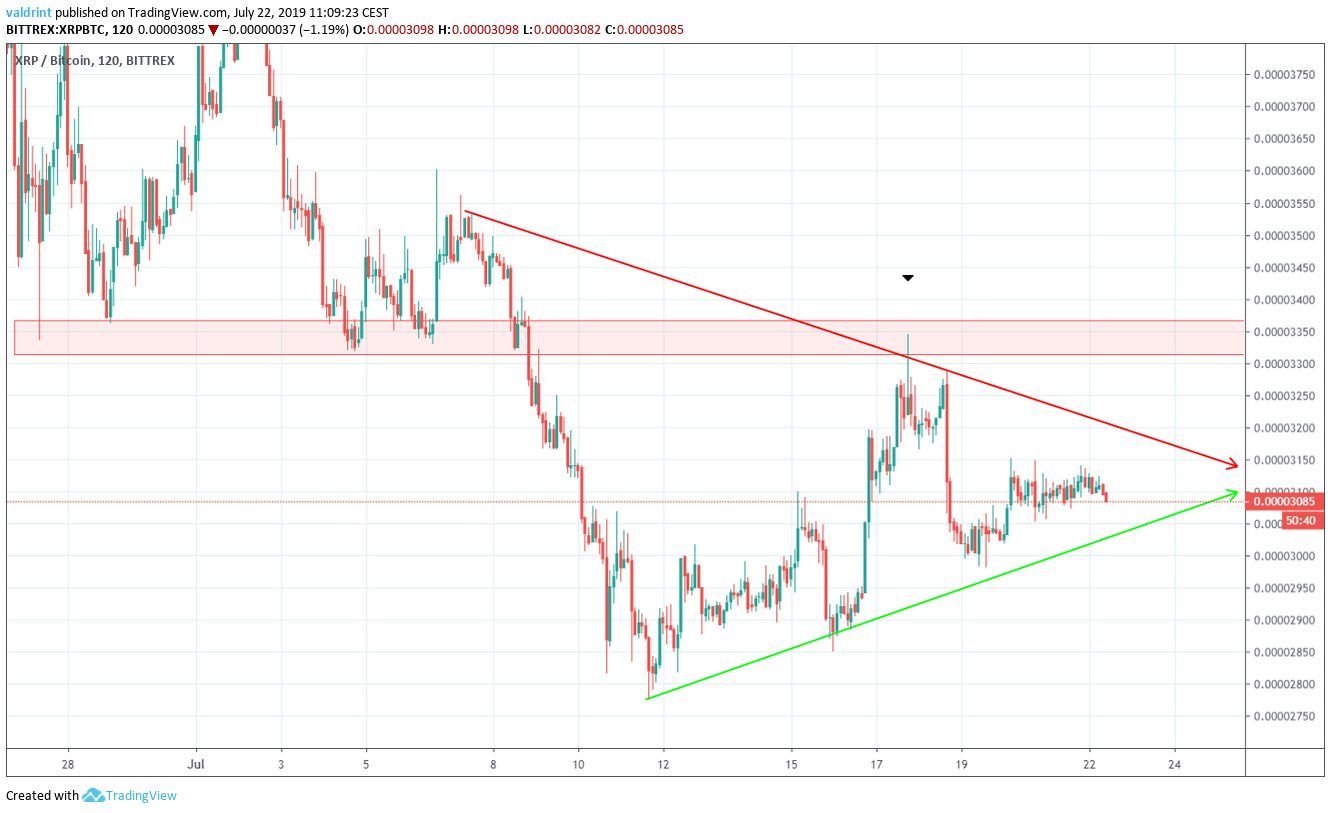
The area is found near 3350 satoshis. It acted as support in the period from June 28 to July 8, before the XRP price broke down.
Afterward, once the price reached this area on July 18, it immediately began to decrease.
Long-Term XRP Price Support
A long-term view shows that the XRP price is trading very close to a significant support area, which is found at 2850 satoshis.
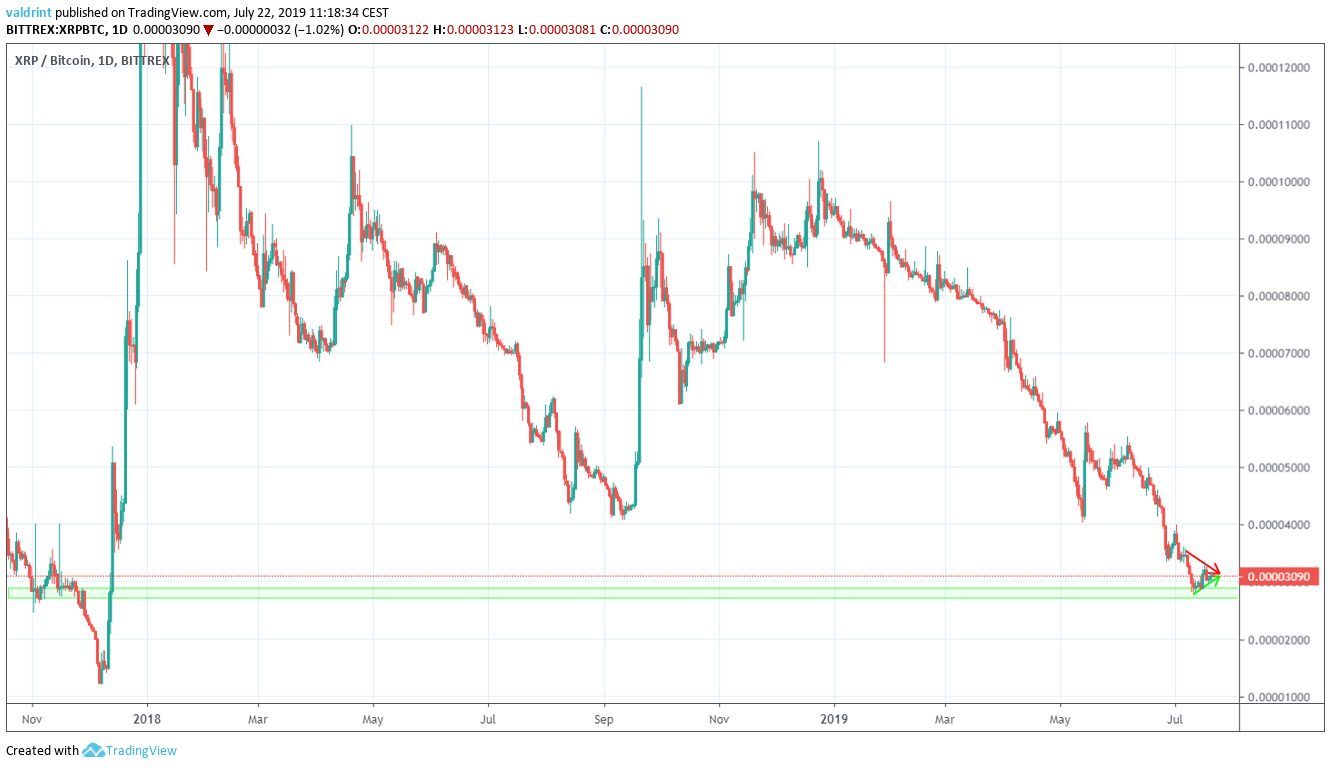
The XRP price has not traded at this level since December 2017.
This area is an optimal place for the initiation of a reversal.
Let’s take a look at some technical indicators and see how likely that is.
Technical Indicators
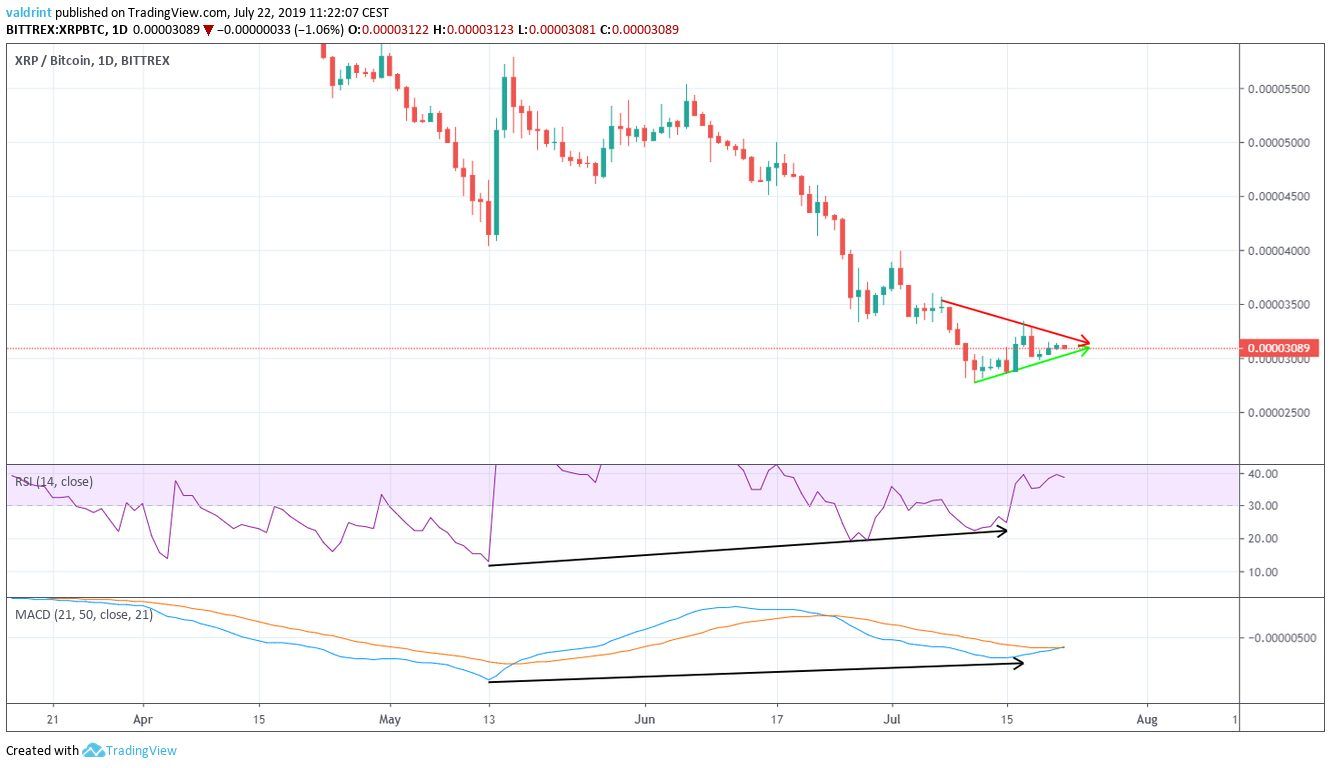
Both indicators have been generating bullish divergence since May 13.
The divergence is very significant and present in both indicators.
Furthermore, a look at the moving averages (MA) suggests that this move may be initiated in the near future.
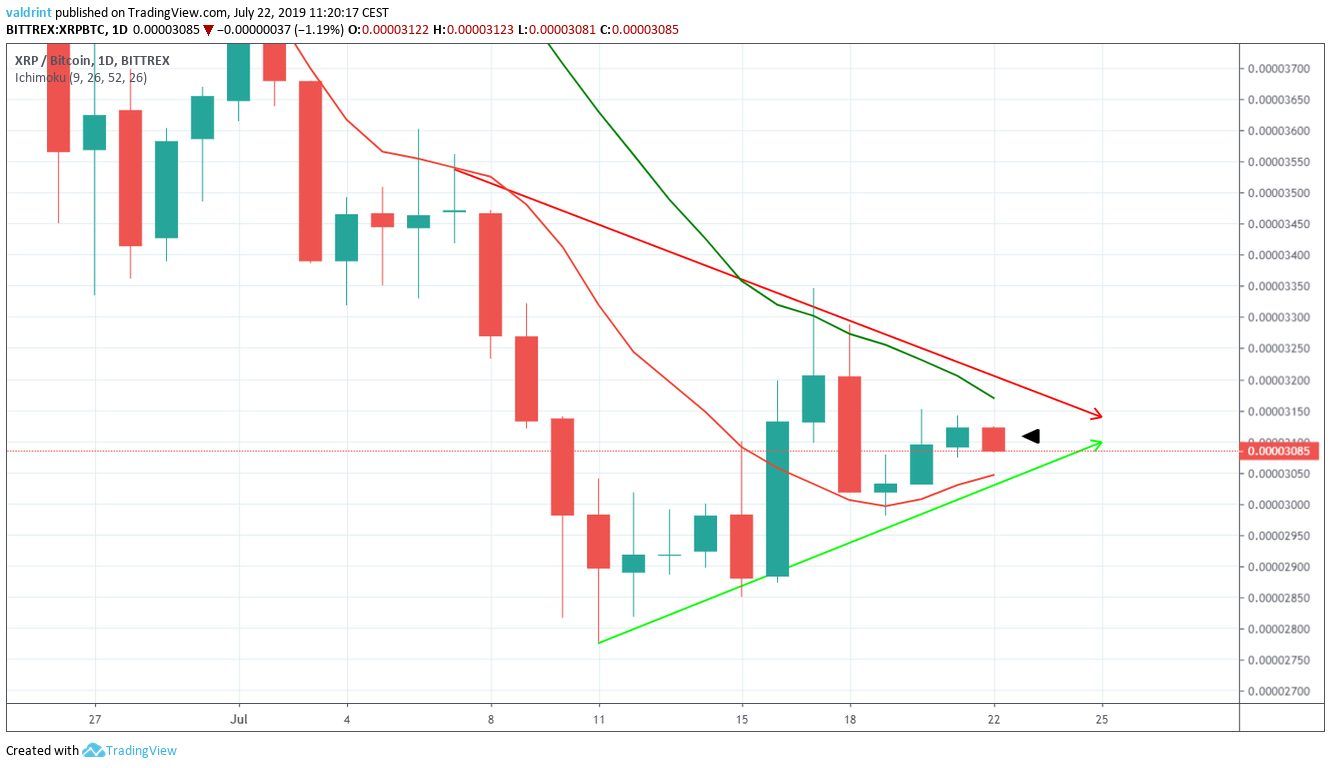
So far, the XRP price has made one attempt at a breakout. However, it was rejected by the 20-day MA.
Now, XRP is trading between the moving averages. The 10-day MA has begun to increase and is providing support to the price.
If it continues following its current trajectory, it will soon make a bullish cross.
If by then the price is trading above both MAs, it would serve as confirmation that the upward move has begun.
Reversal
When a decisive move occurs, the price is likely to eventually meet resistance or support.
Therefore, one resistance and one support area are outlined below. They are likely to provide a reversal.
The support and resistance areas are found at 2850 and 3350 satoshis respectively.
We believe that the XRP price will soon move towards resistance.
Another observation that endorses the possibility of further upward movement is the creation of bullish candlestick patterns.
The daily candle for July 16 was bullish engulfing. Additionally, it reached a close above significant previous resistance areas.
This was succeeded by another bullish candle. The ensuing decrease has been comfortably contained within these two bullish candles.
Summary
The XRP price is trading inside a long-term significant support area.
According to our analysis, XRP will soon break out from this triangle and reach the resistance area outlined above.
Do you think XRP will break out from the triangle? Let us know in the comments below.


