The price of XRP has been a roller coaster ride since July 18, when it reached a low of $0.304 and triggered an upward move. On July 20, it hit a high of $0.342, then proceeded to fall back to a similar relative low on July 24.
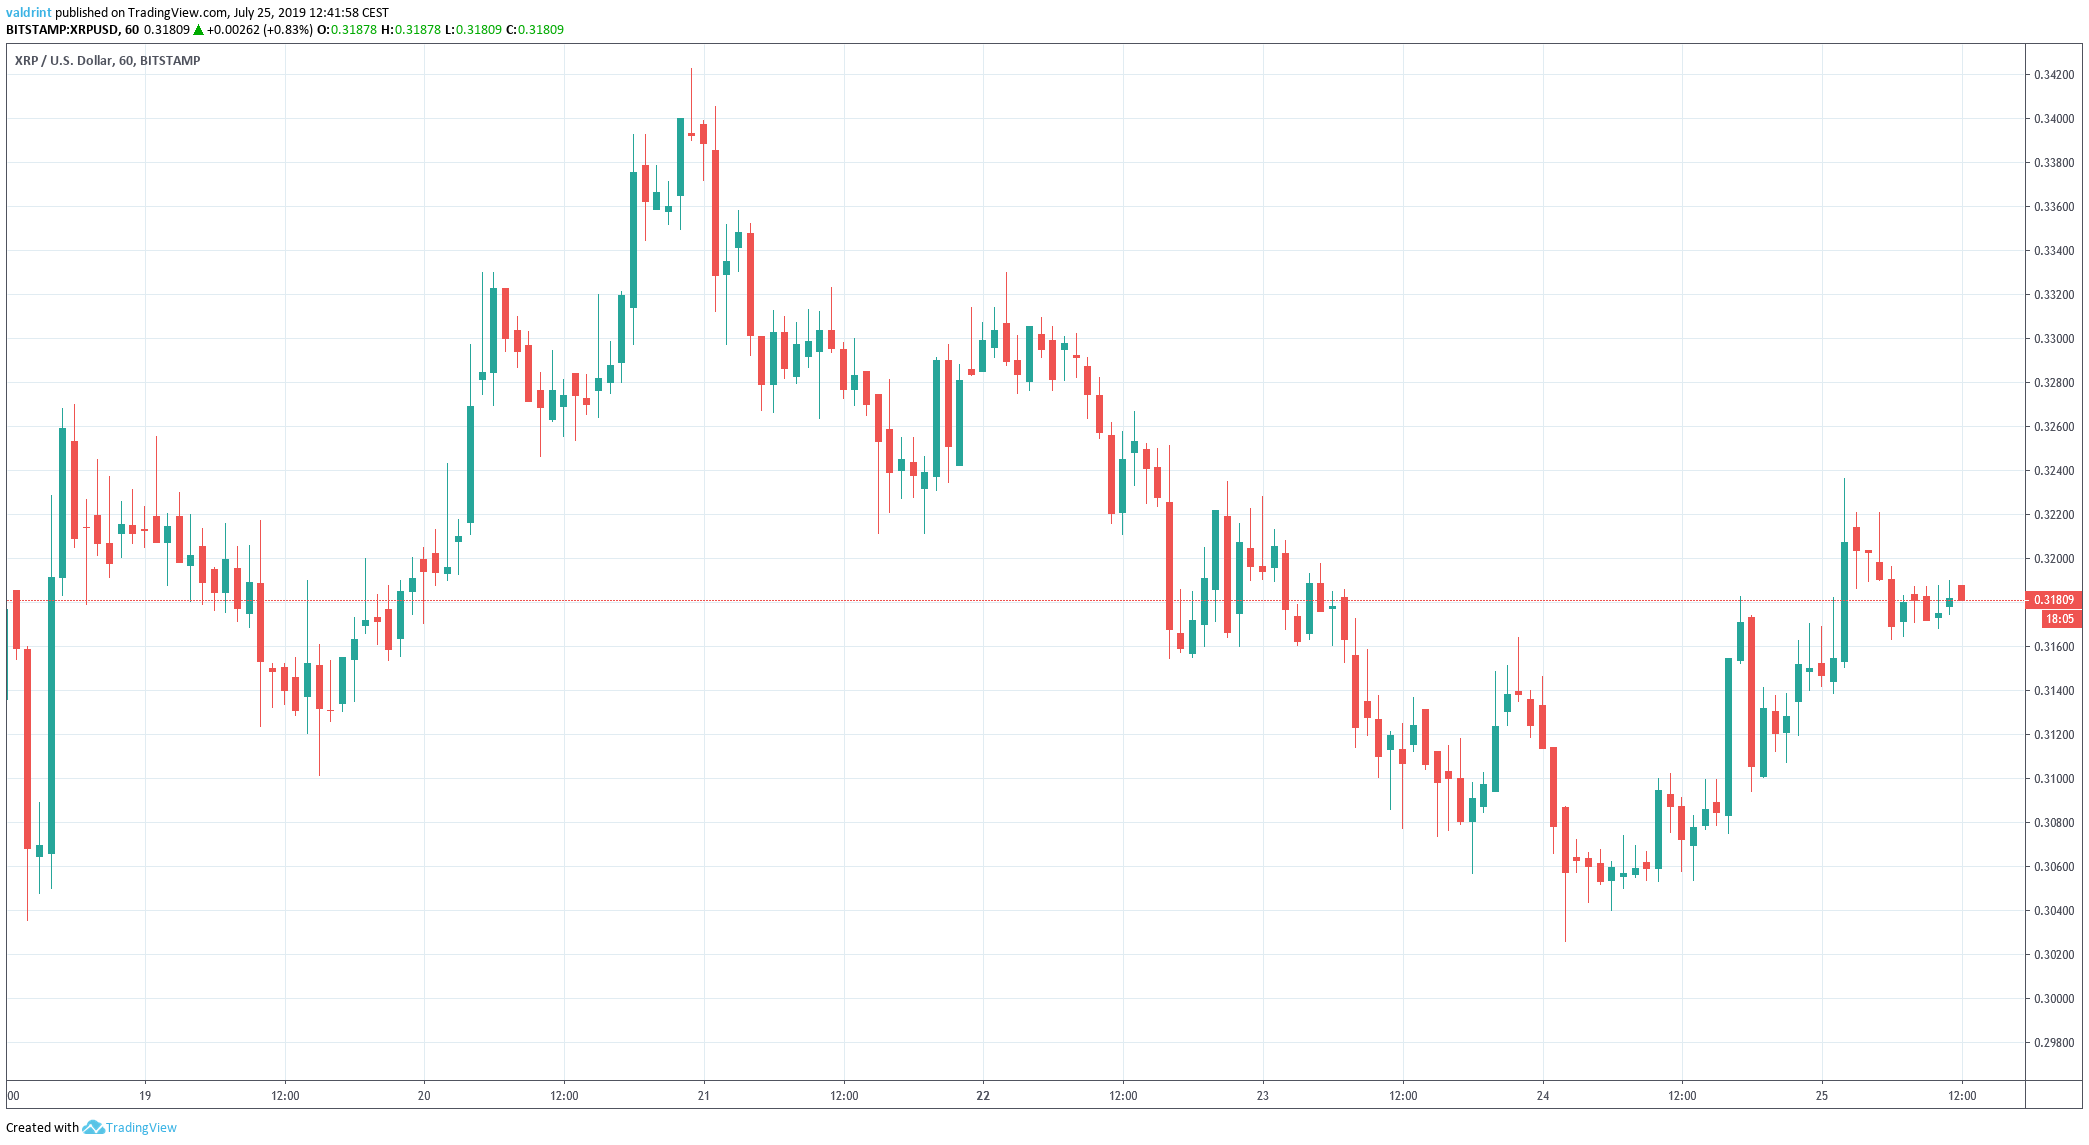 Will XRP initiate another upward move? Keep scrolling below if you want to find out.
For our previous analysis, click here.
If you are interested in trading XRP (XRP) with a multiplier of up to 100x on our new partner exchange with the lowest fees, follow this link to get a free StormGain account!
For those interested in more of a visual analysis, click to watch our video below:
XRP Price: Trends and Highlights for July 25
- XRP/USD broke out from a descending wedge.
- It is following a descending resistance line.
- Moving averages give a bearish outlook.
- XRP is trading inside a long-term symmetrical triangle.
Previous Movement
Since reaching the aforementioned high on July 20, XRP has been decreasing while trading inside the descending channel outlined below.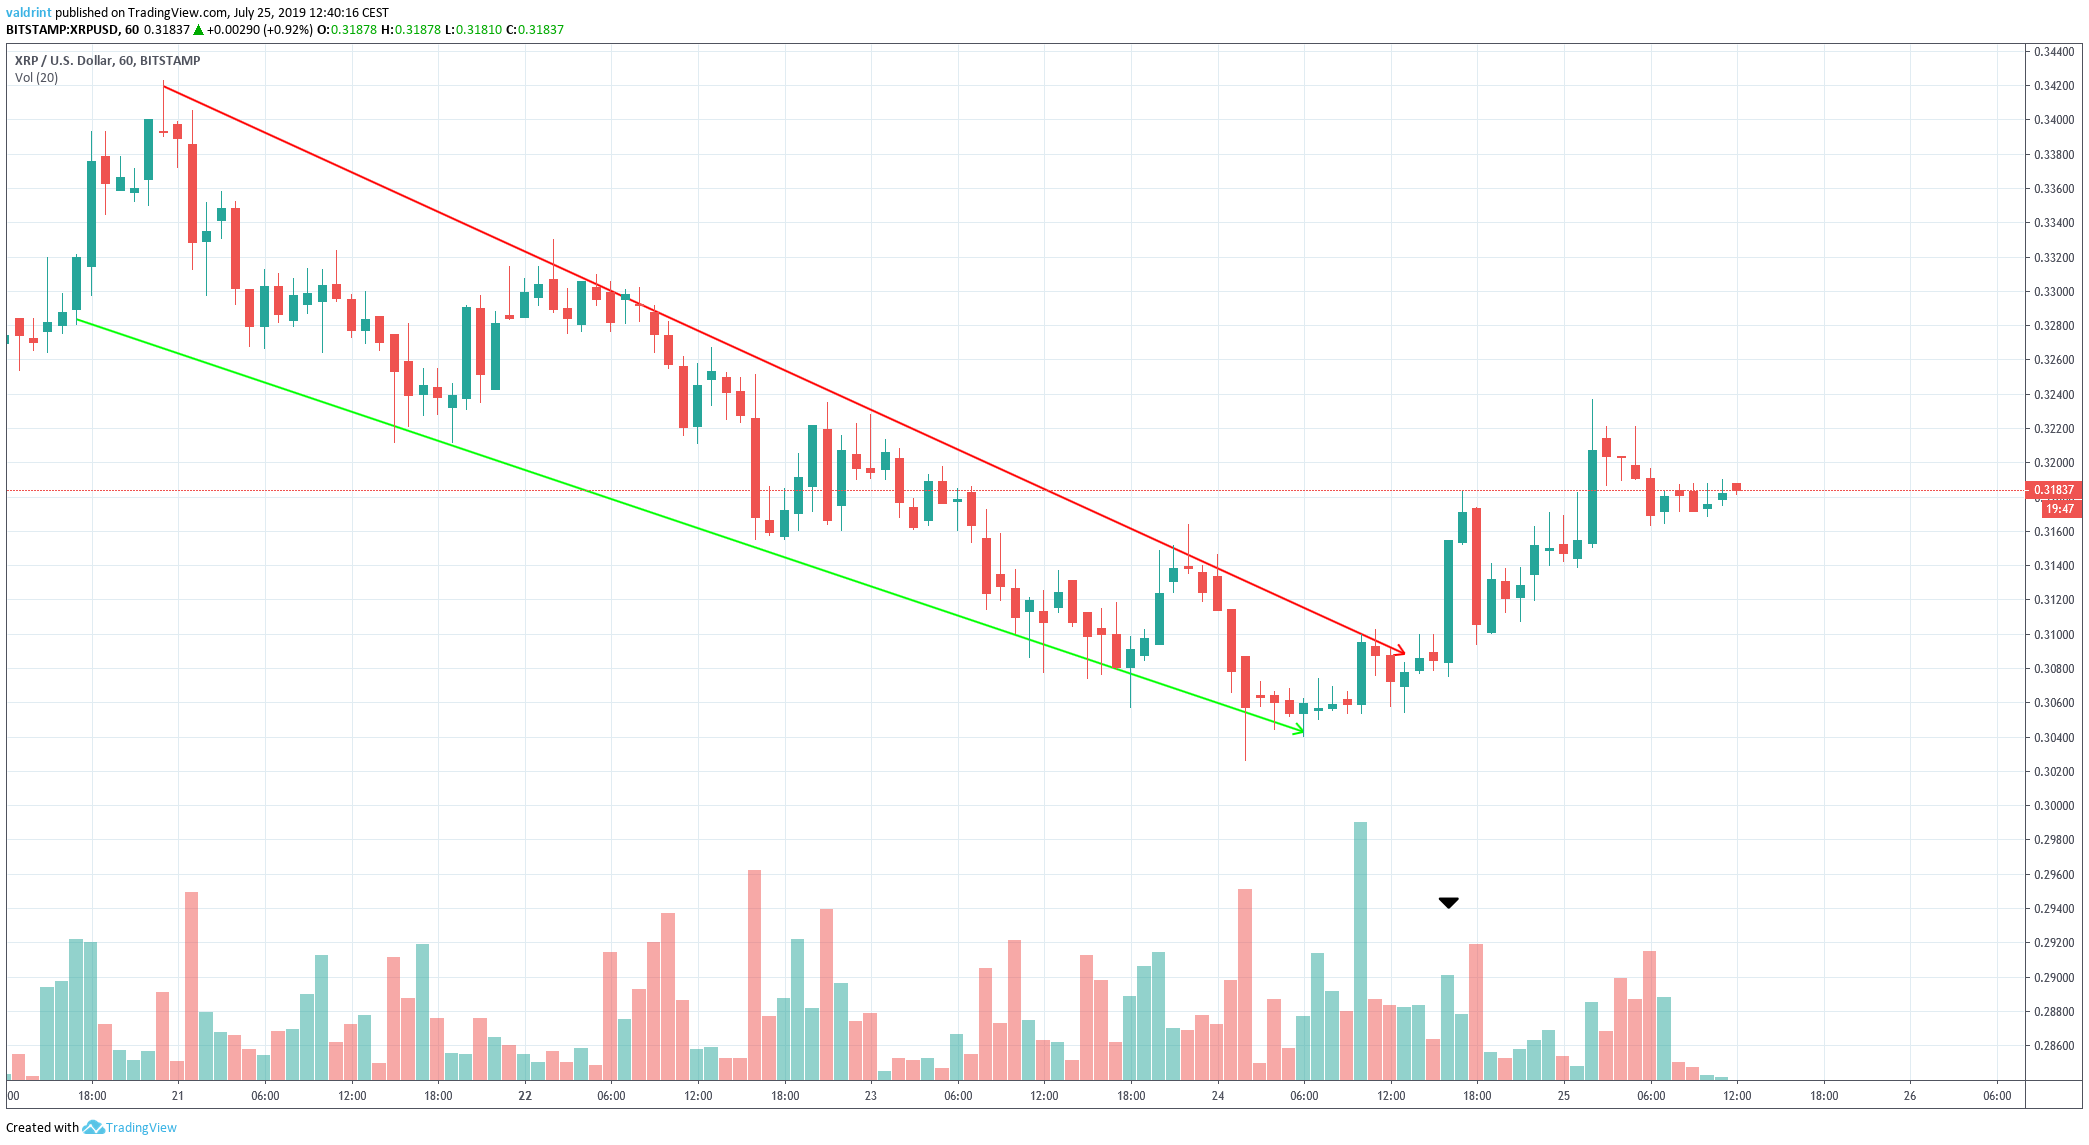 On July 24, the price broke out from the channel.
The breakout transpired with average volume, greatly reducing its significance.
In these cases, it is customary for the price to reverse until it again touches the previous resistance line.
Will it do so this time?
Descending Resistance
A look at the six-hour time-frame shows that the price has been following a descending resistance line.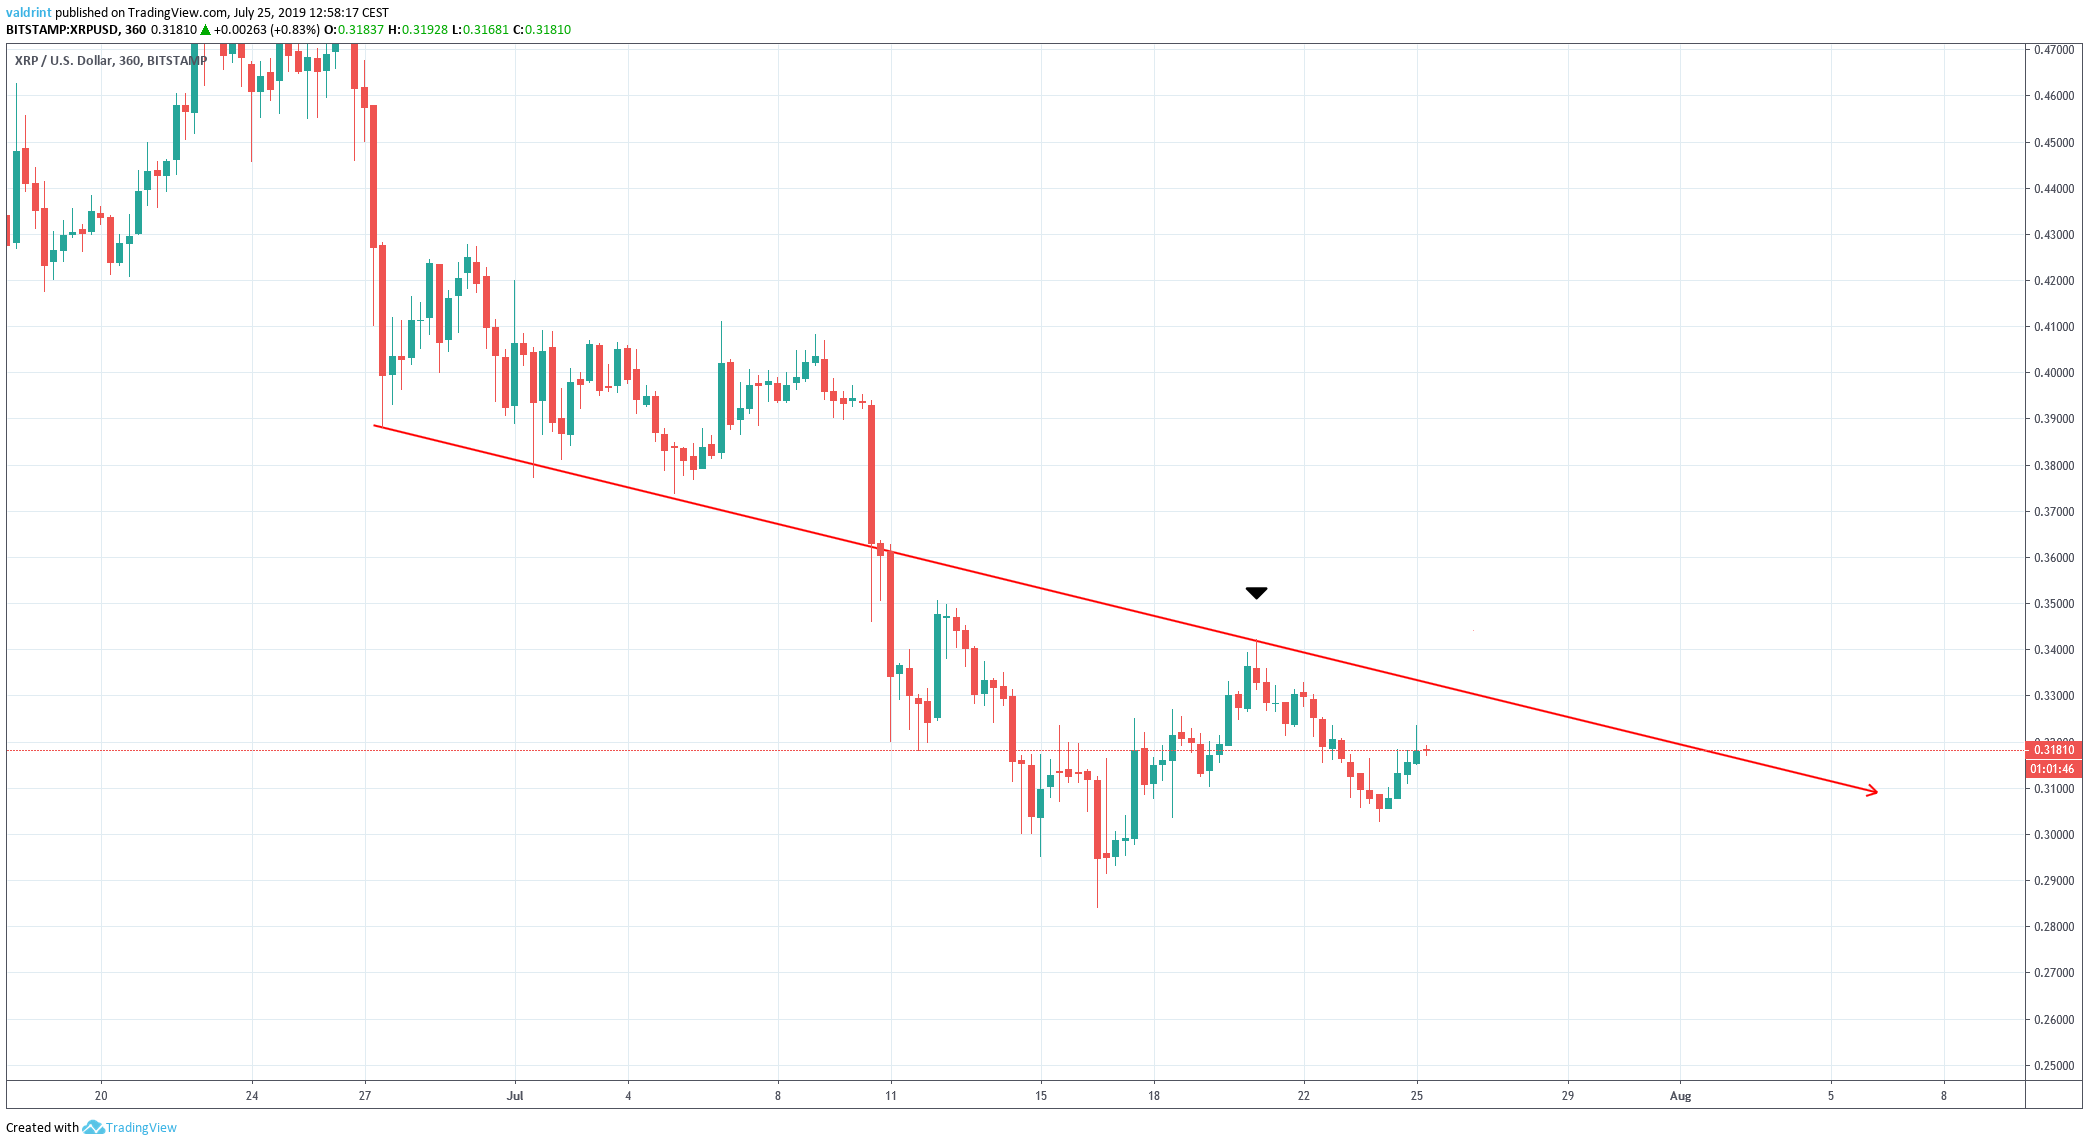 The line acted as support in the period from June 24 to July 8, before the price broke down.
On July 22, the price touched it and validated the level as resistance.
A look at the moving averages (MA) suggests that the price is not yet ready to break out above this resistance.
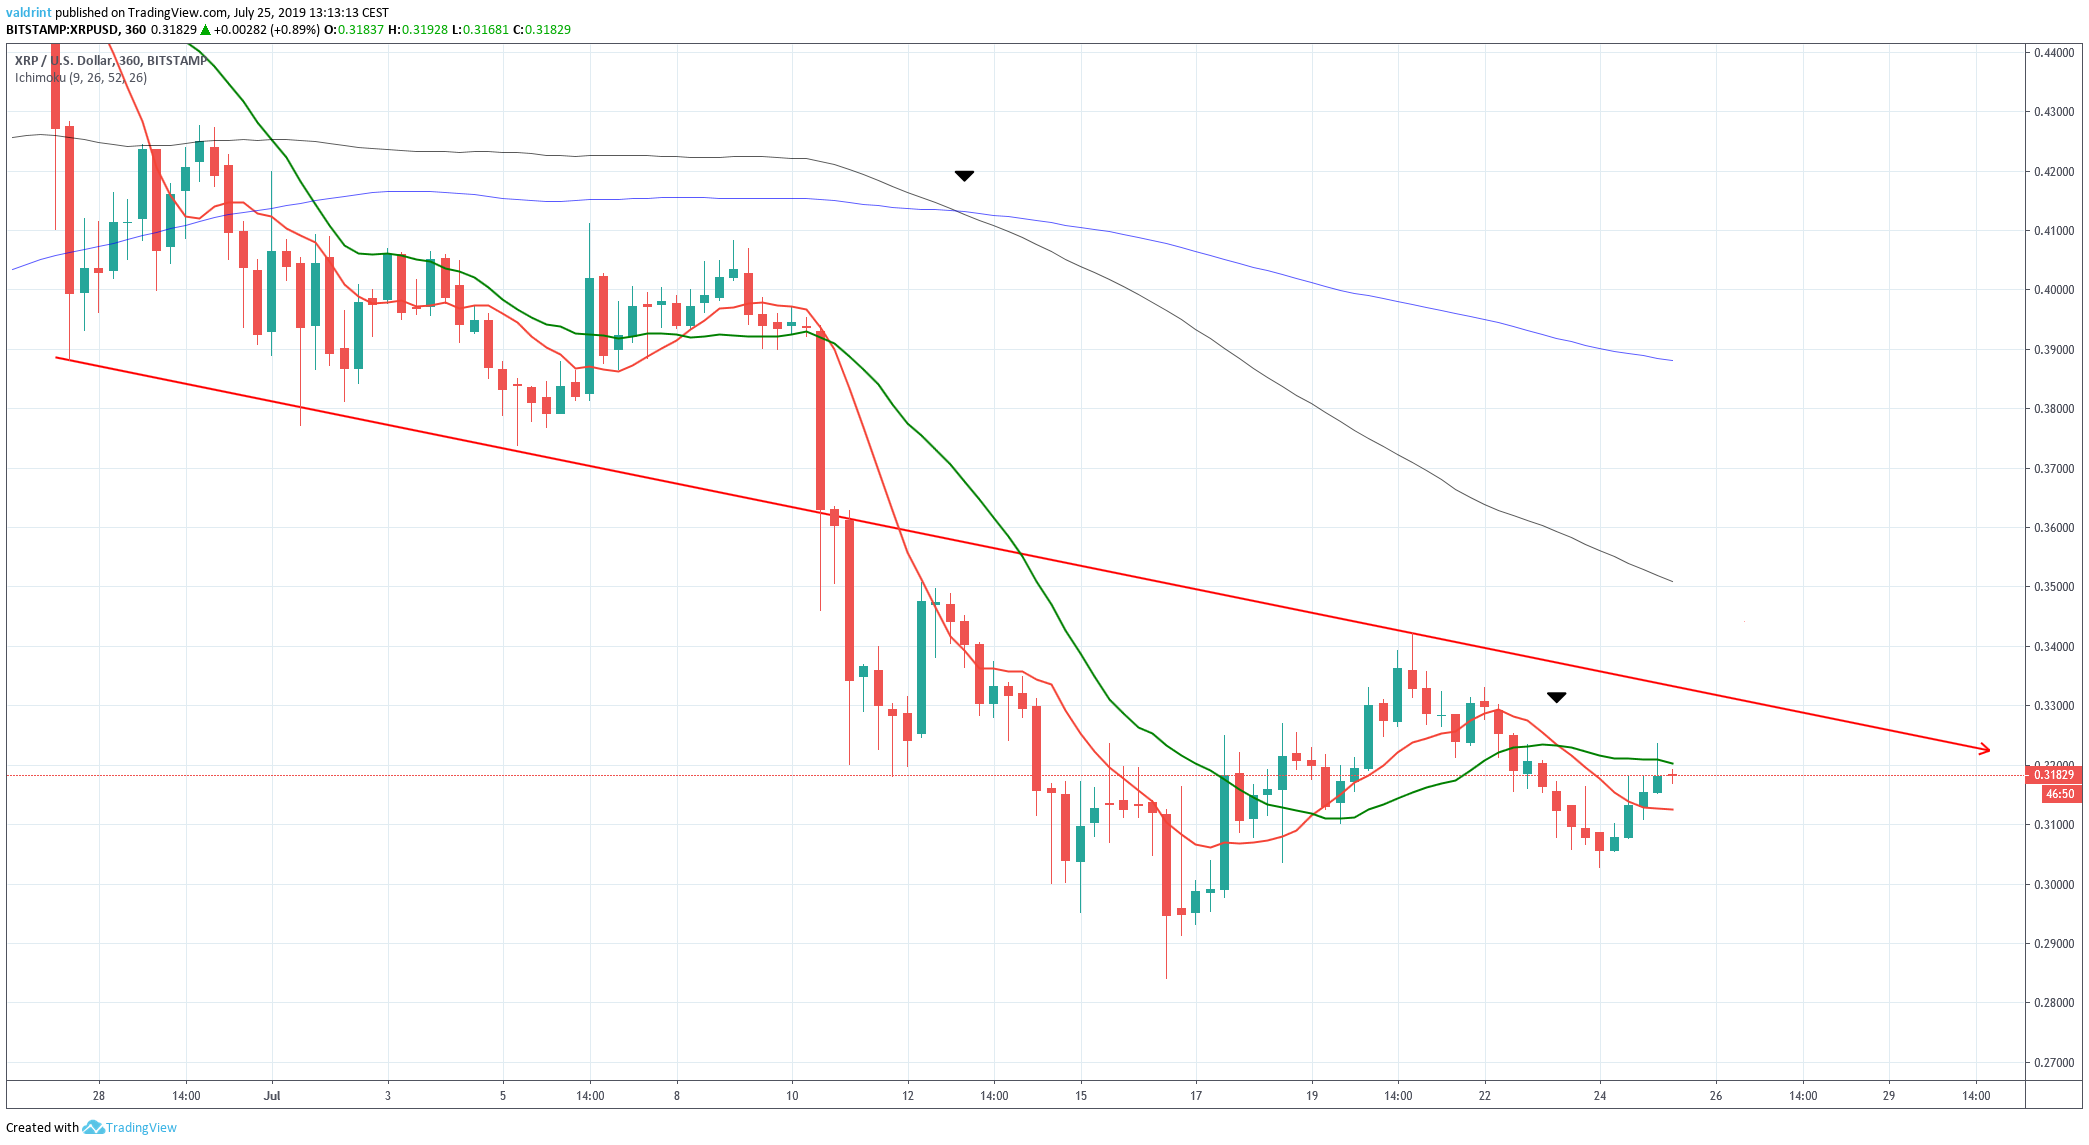 Both long and short-term bearish crosses have transpired.
The 100 and 200-day MAs made a bearish cross on July 12 — and the price is trading below both of them.
The 100-day MA is very close to the descending resistance line, further increasing its significance.
Likewise, the 10 and 20-day MAs made a bearish cross on July 22.
At the time of writing, the price was trading between them, facing close resistance from the 20-day average.
The use of this indicator and previous price movement makes us believe that the price will not be successful in breaking out of the resistance line.
Where will it go?
Long-Term
A look at the daily time-frame shows that the price has been trading inside a symmetrical triangle since August 2018.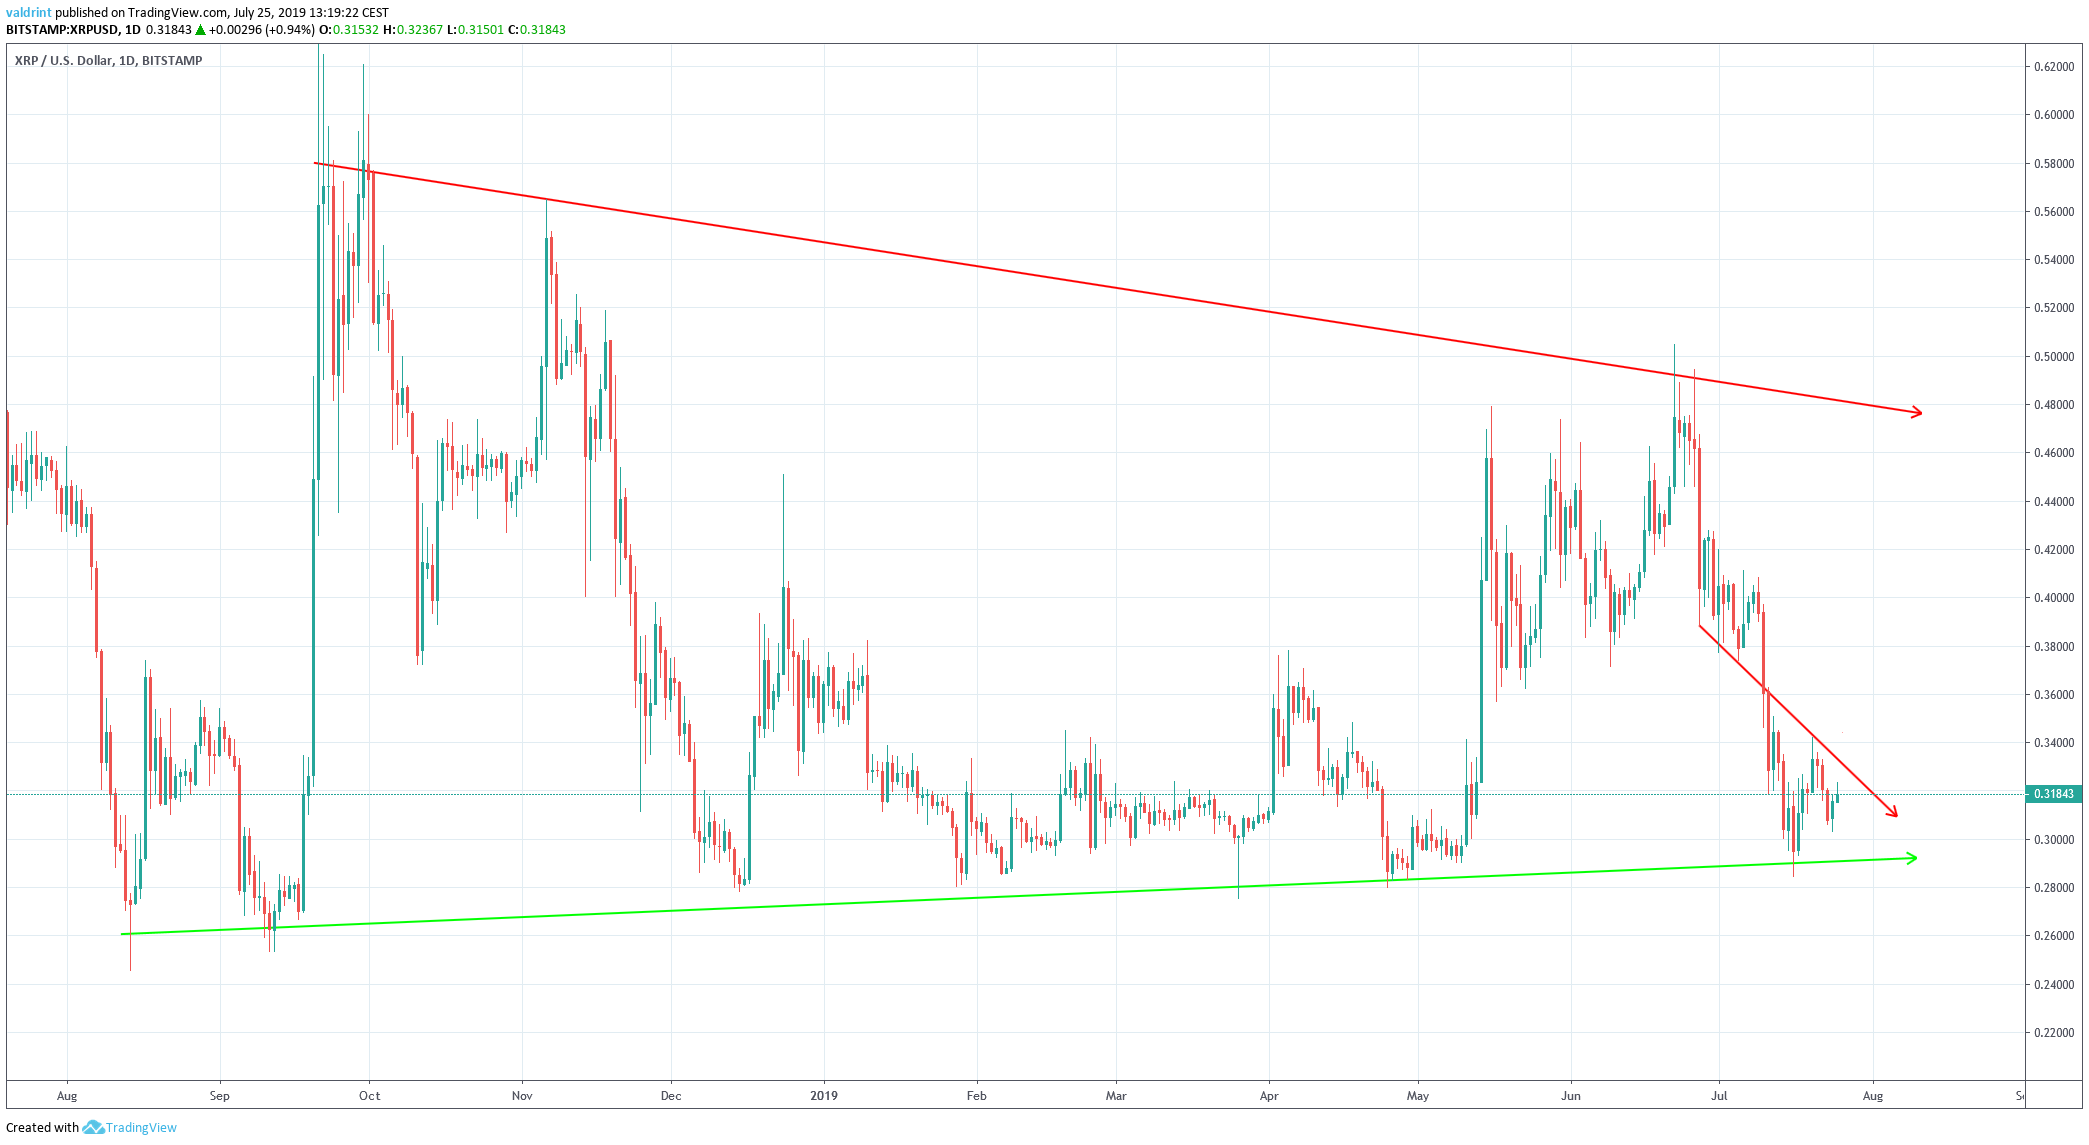 At the time of writing, the price was trading slightly above the support line at $0.30.
According to our analysis, the price is likely to reach that support again in the near future.
Summary
The XRP price is following a descending resistance line. According to our analysis, it is likely to continue decreasing at the rate predicted by the line until it reaches the support outlined above. Do you think XRP will continue its downtrend? Let us know your thoughts in the comments below.Disclaimer: This article is not trading advice and should not be construed as such. Always consult a trained financial professional before investing in cryptocurrencies, as the market is particularly volatile. Images are courtesy of TradingView.


