


Since reaching an all-time high of $3.41, XRP has faced significant downward pressure, causing it to fall below the $3 threshold.
The altcoin’s value has declined 9% over the past week and shows no signs of recovery in the near term as bearish sentiment grows and outflows from spot markets accelerate.
XRP Sellers Dominate Market
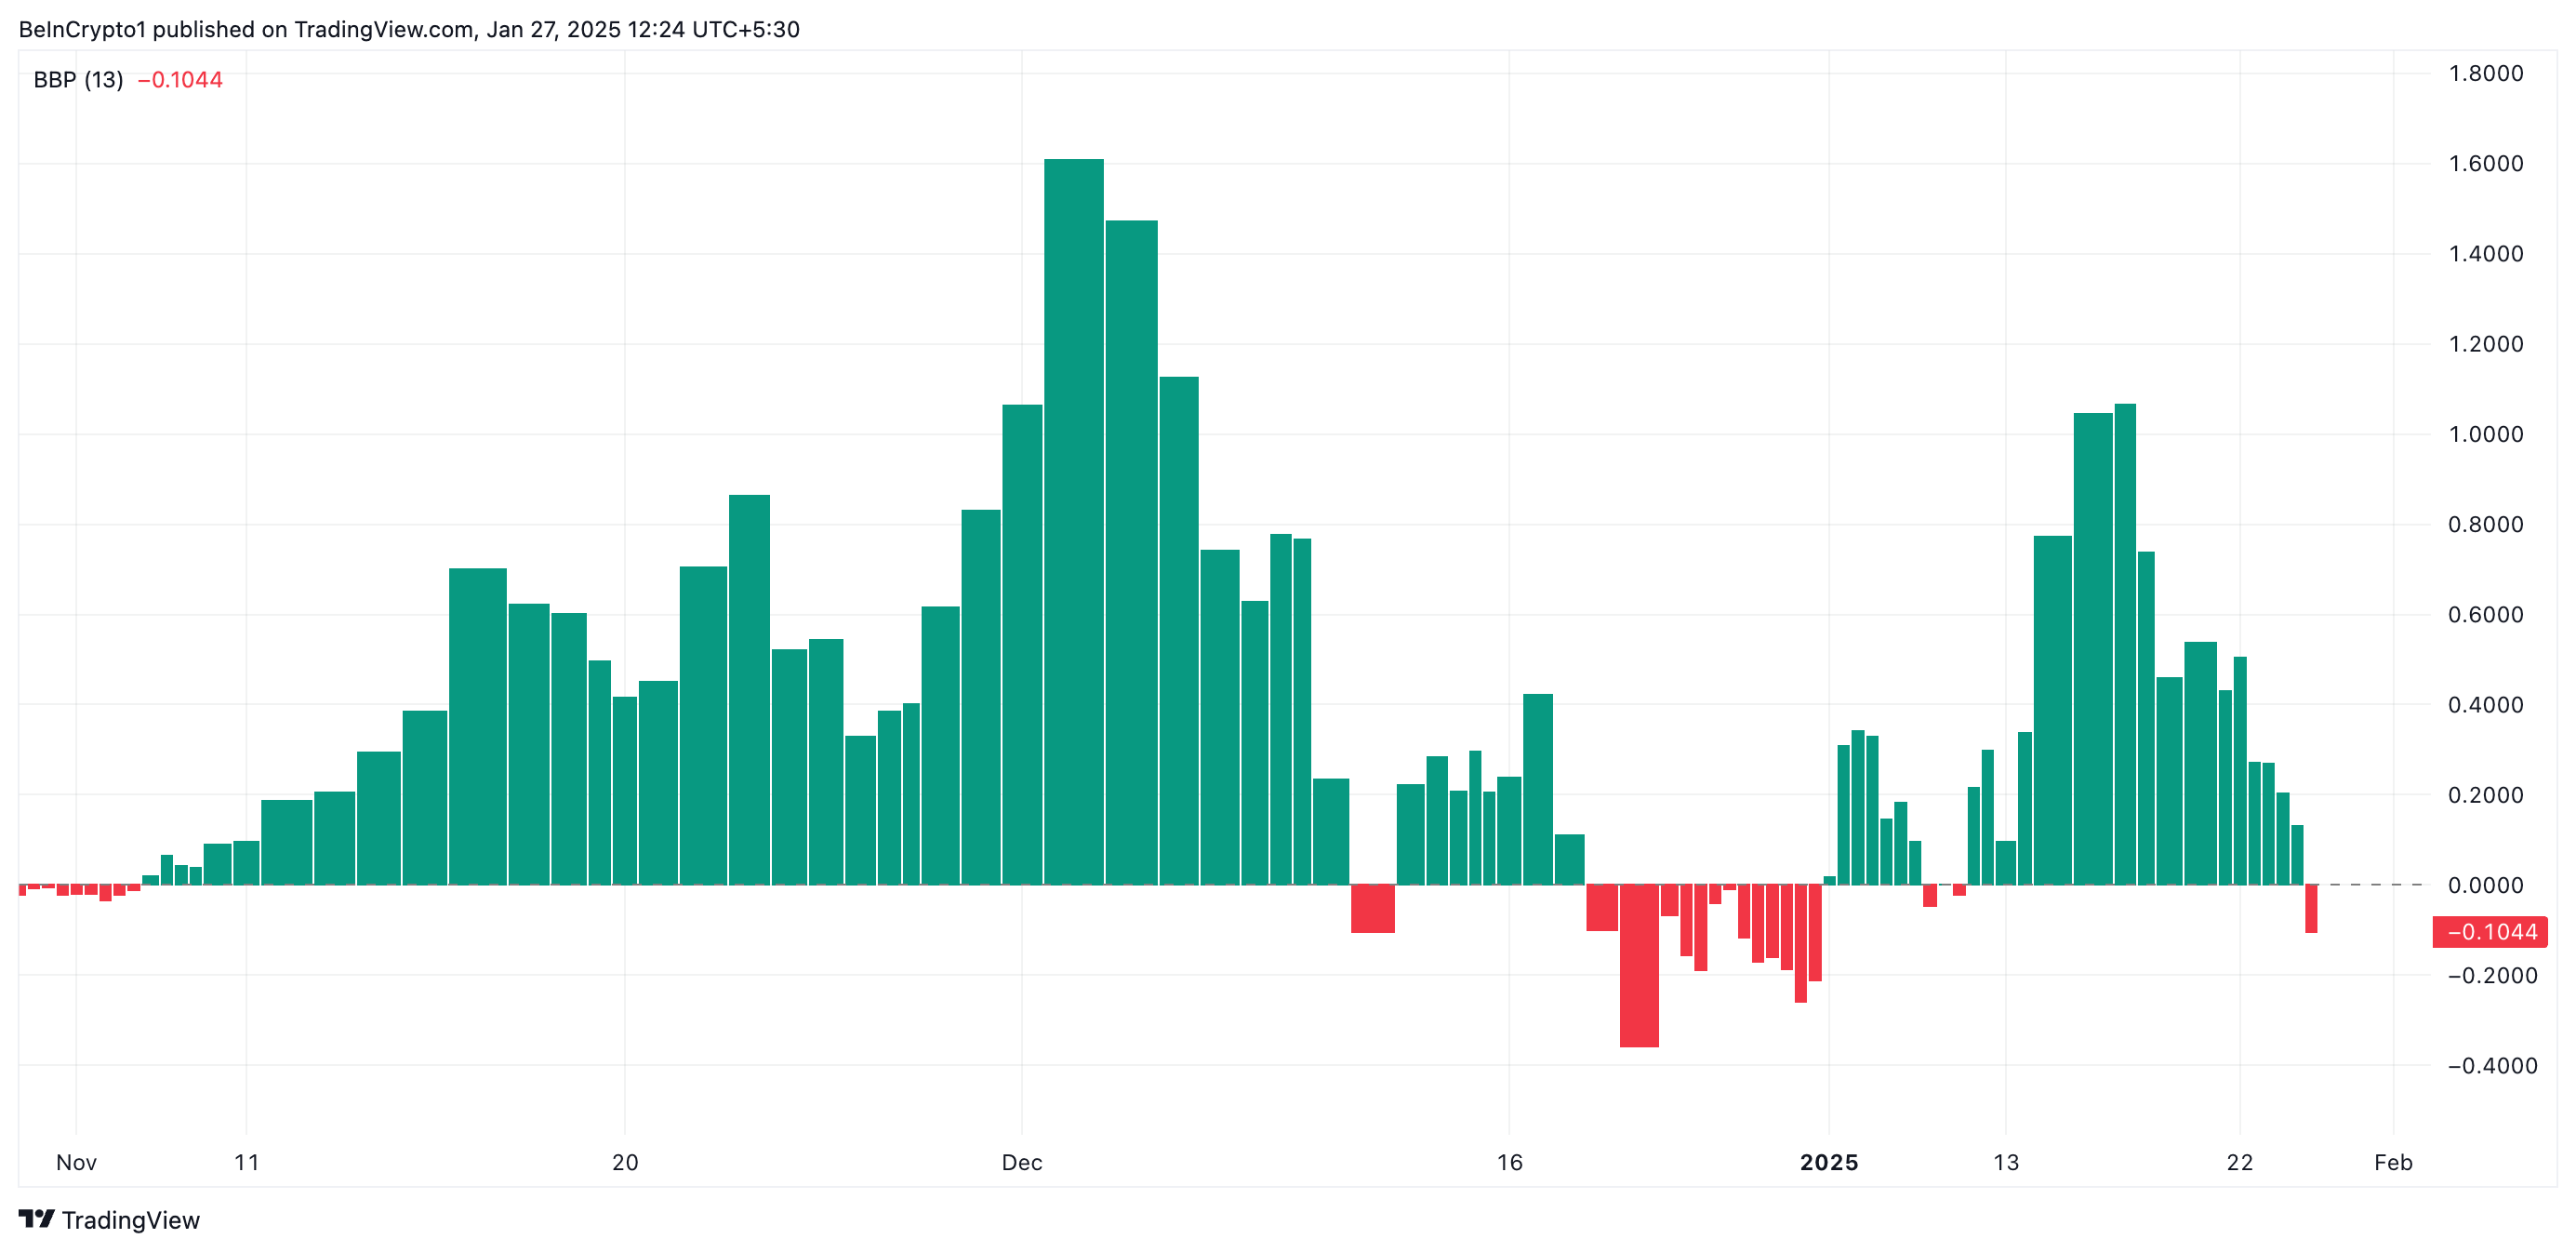
An assessment of the XRP/USD one-day chart reveals the growing bearish bias against the altcoin. For example, its Elder-Ray Index has posted a red histogram bar for the first time in 15 days, reflecting the market selloffs. At press time, the indicator is at -0.10.
An asset’s Elder-Ray Index measures the relationship between its buying and selling pressure in a market. When the index is negative, it indicates that bearish momentum is dominant, suggesting that sellers are in control and the asset’s price is likely to face downward pressure.
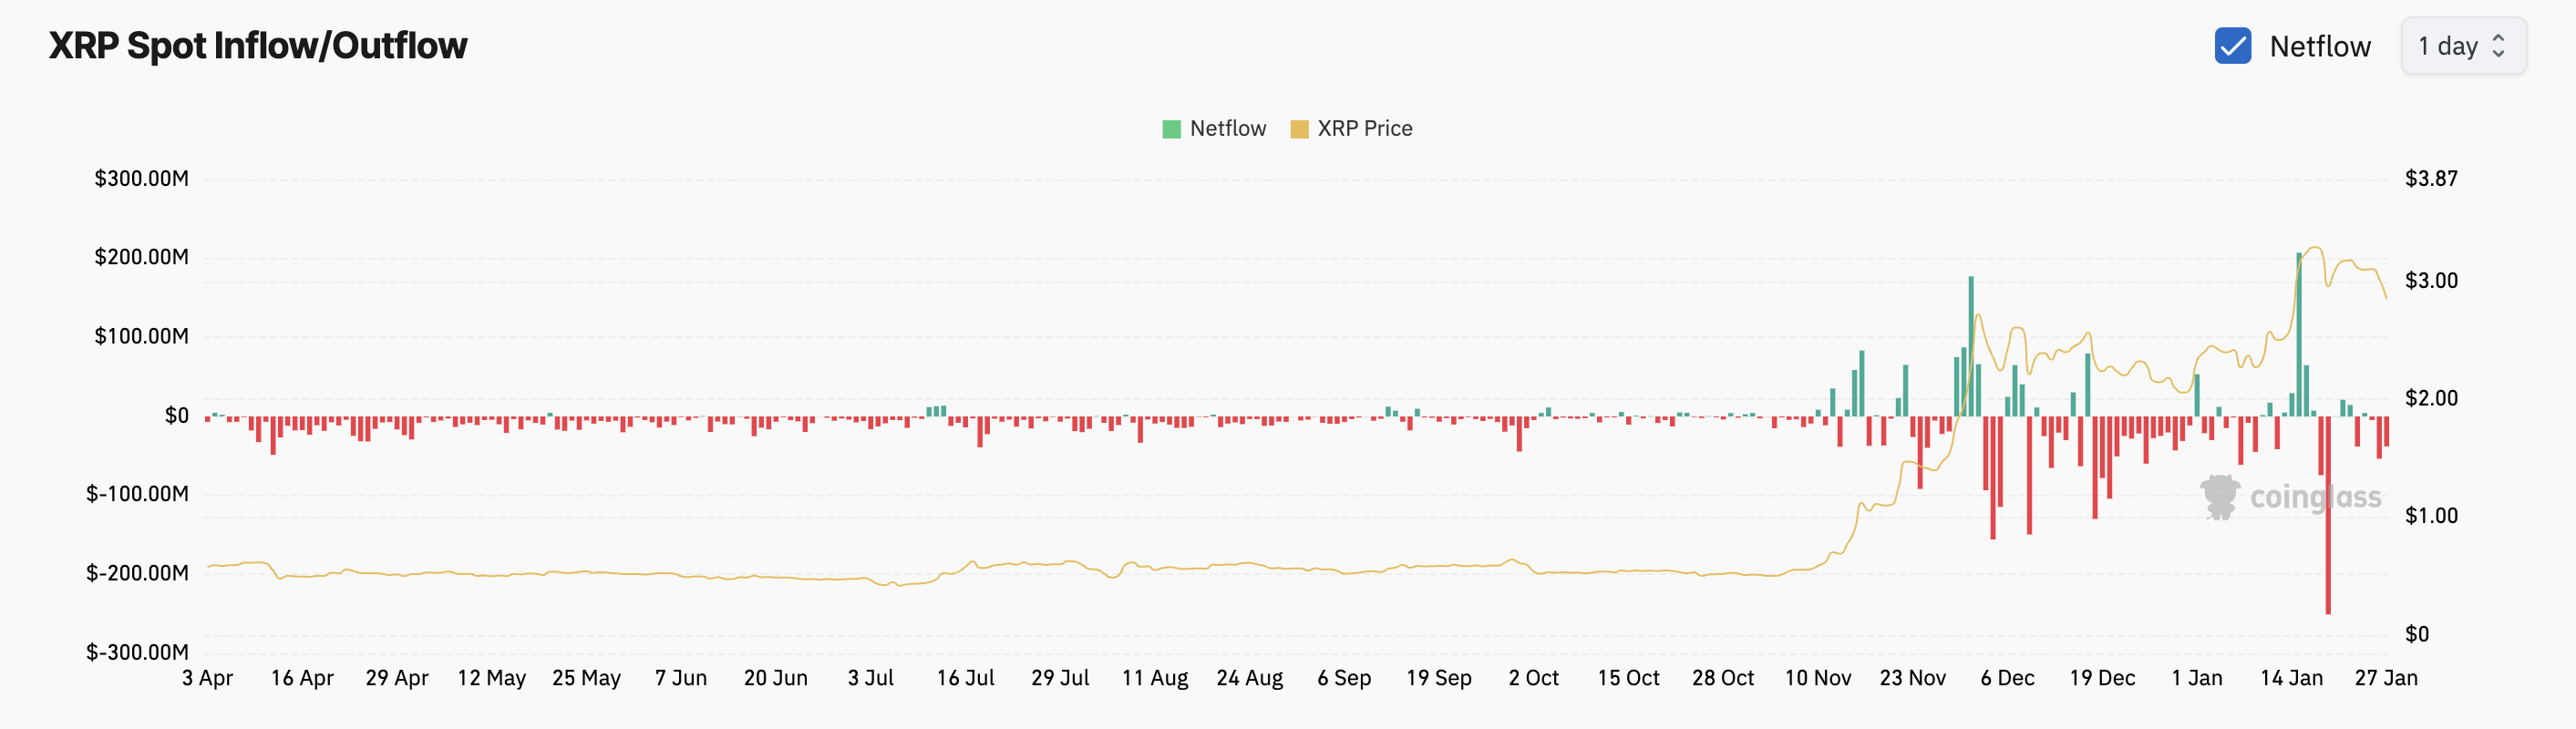
Moreover, the steady outflows from XRP spot markets confirm the high selling pressure. According to Coinglass, in the past three days, outflows from XRP spot markets have totaled $96 million.
Spot outflows such as this signal declining confidence or profit-taking, often leading to downward pressure on the asset’s price.
XRP Price Prediction: Will It Drop Further or Rally Back to $3.41?
On the technical side, readings from XRP’s Moving Average Convergence Divergence (MACD) indicator confirm this bearish outlook. The altcoin’s MACD line (blue) currently rests below its signal line (orange).
When this indicator is set up this way, it indicates a bearish trend. This means that selling activity exceeds accumulation among market participants, hinting at the possibility of an extended decline. If this trend continues, XRP’s price could plummet to $2.45.
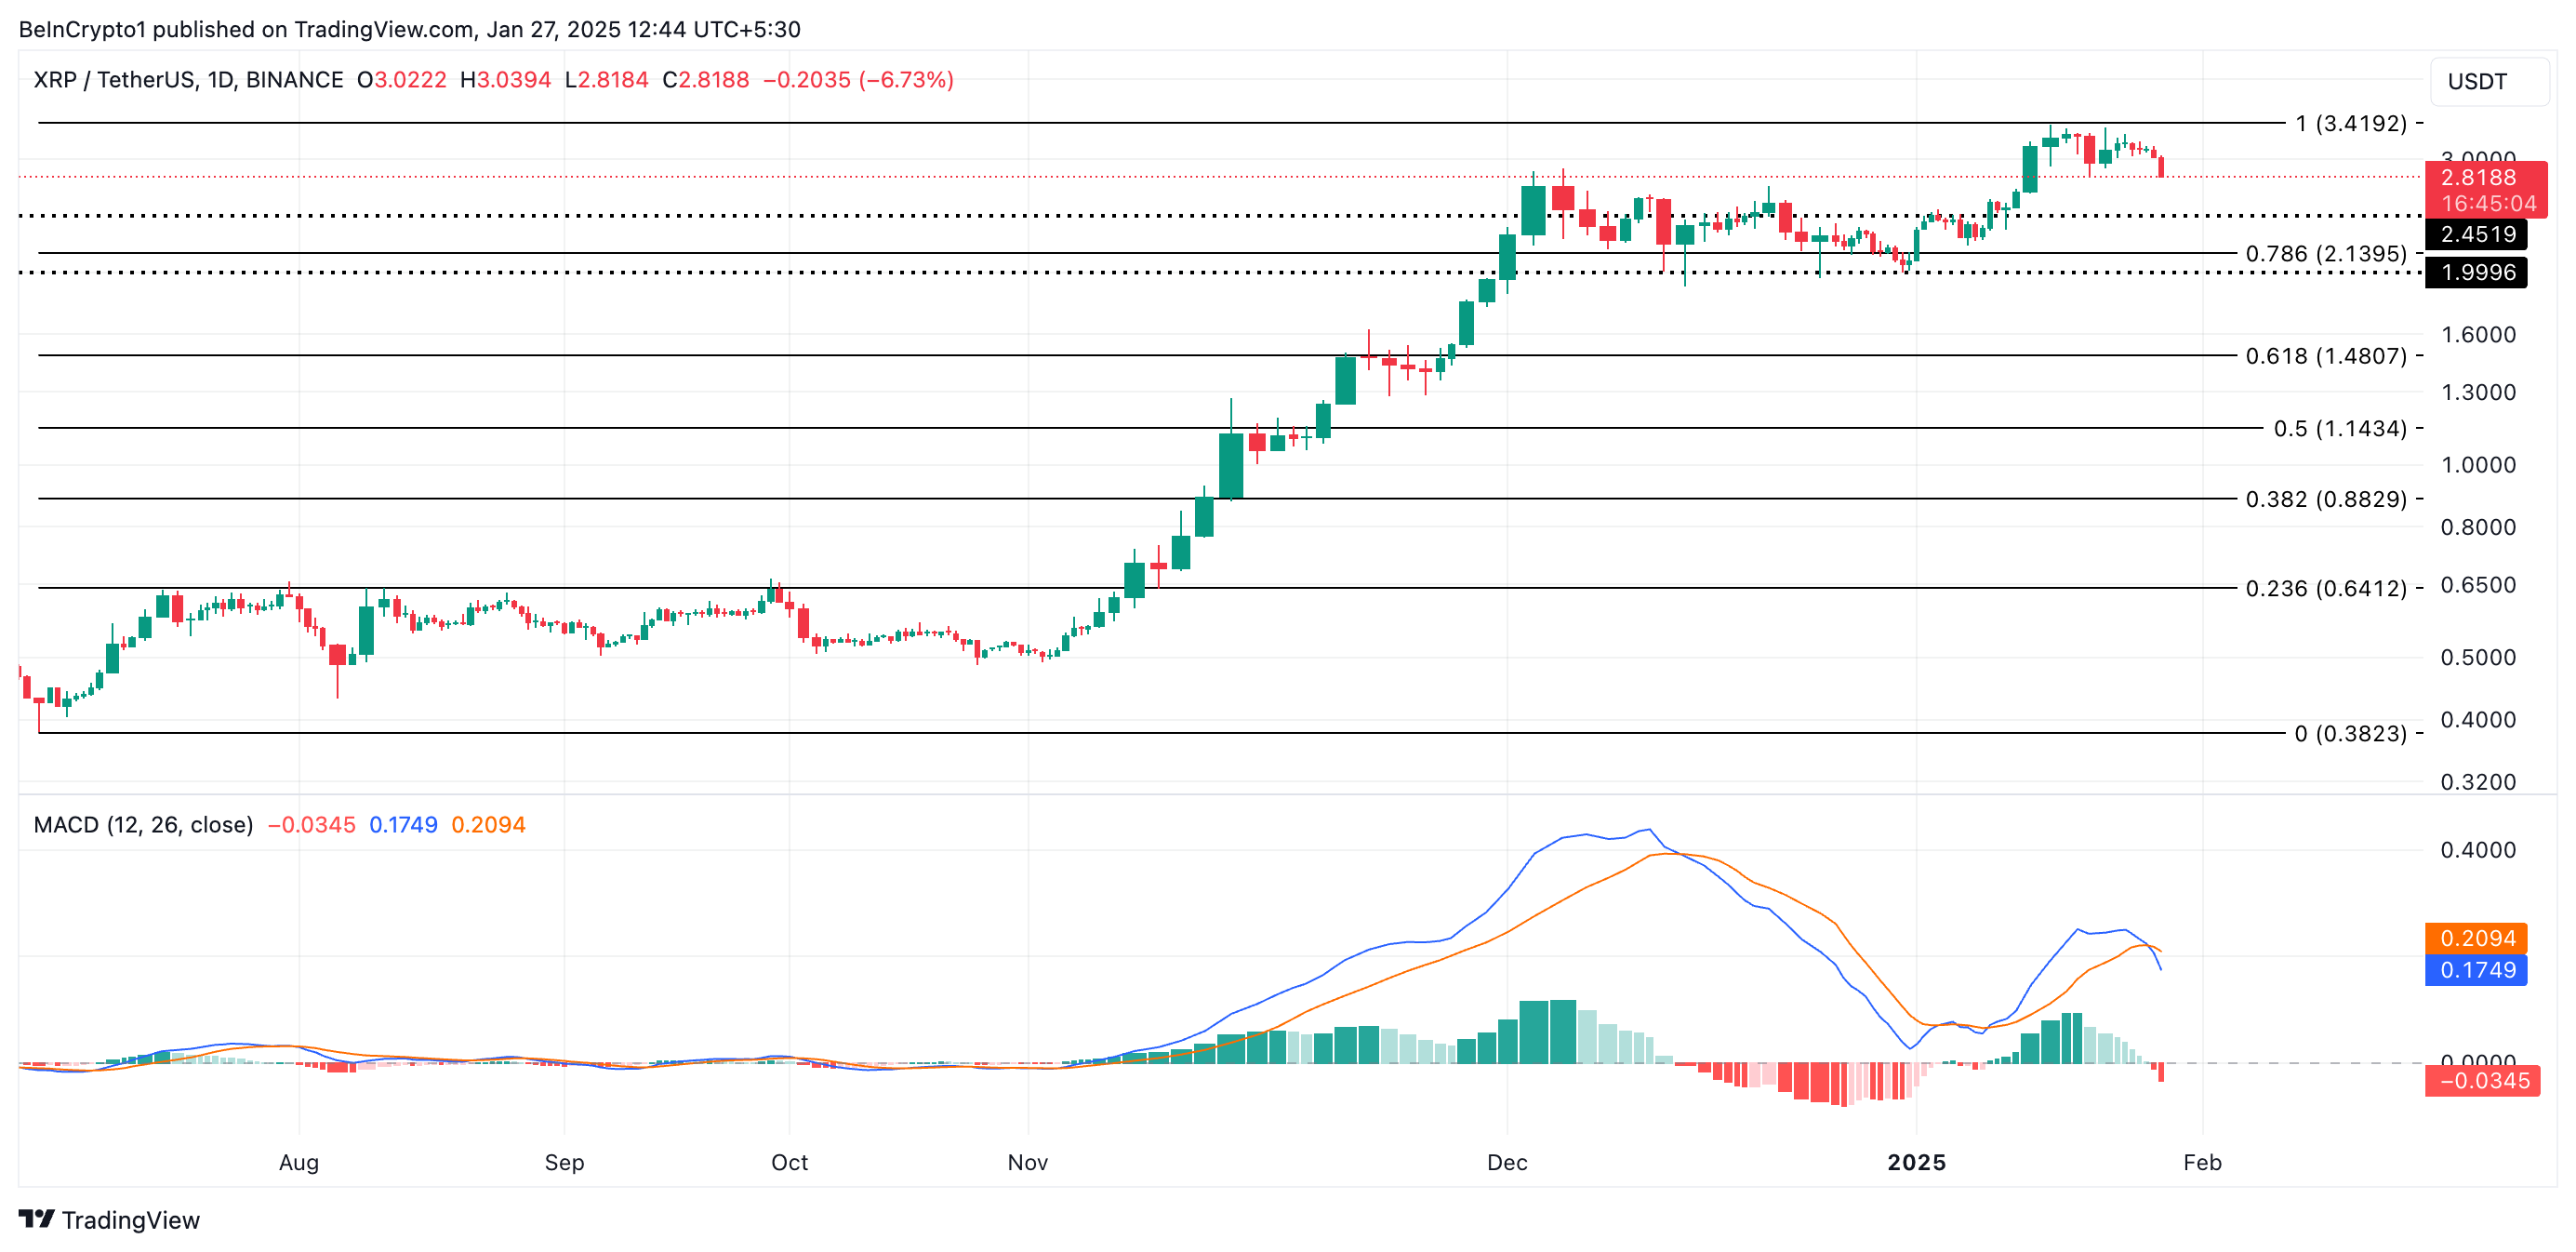
On the other hand, a resurgence in XRP demand could drive it to revisit its all-time high of $3.41.



