


On July 28, the XRP (XRP) price broke out from a long-term resistance area that had previously been in place since March 2019.
As long as the price is trading above this level, the trend is bullish, with XRP likely to move towards the next resistance area outlined below.
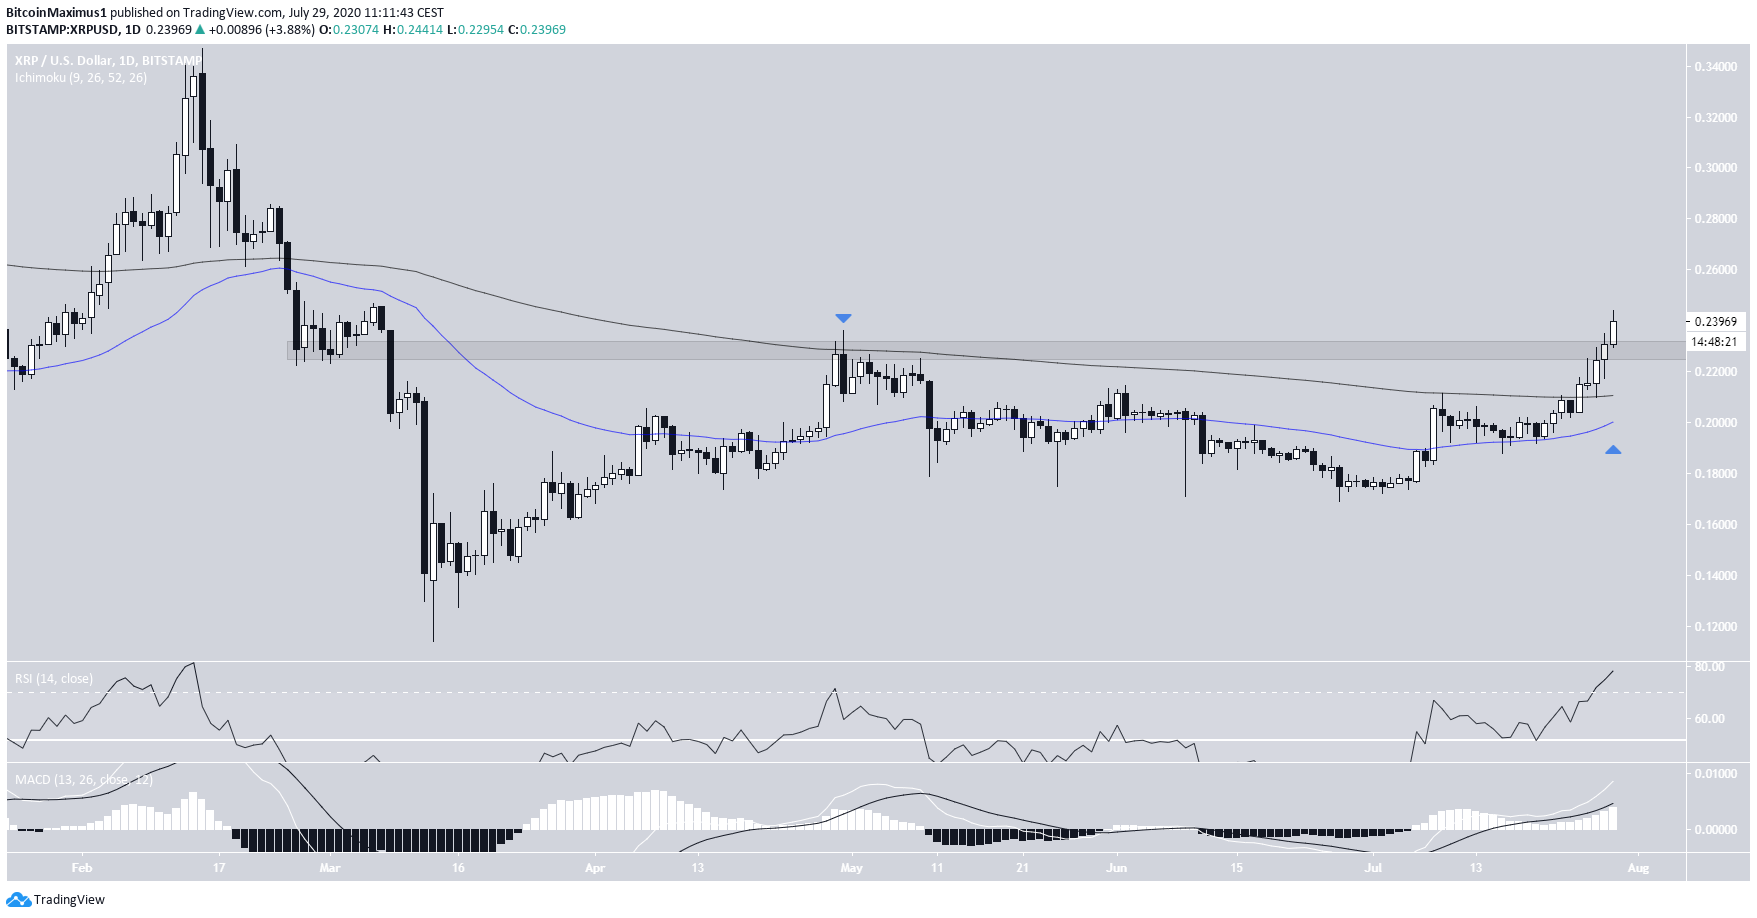
XRP’s Long-Term Breakout
Since the beginning of March 2019, the XRP price had been trading below the $0.230 area. The price reached this area on April 30, validating it as resistance after which it fell. Yesterday, the price finally broke out successfully. This same area should now act as support.
Technical indicators are bullish. The price has broken out above the 50 and 200-day moving averages (MA), the latter of which previously coincided with the $0.230 resistance area. The MAs are close to making a bullish cross.
The daily RSI is overbought, but there is no bearish divergence yet, while the MACD is growing. Therefore, the outlook for the daily time-frame remains bullish.
If the price continues to rally, the next resistance area would be found at $0.270, the February 2019 support levels.
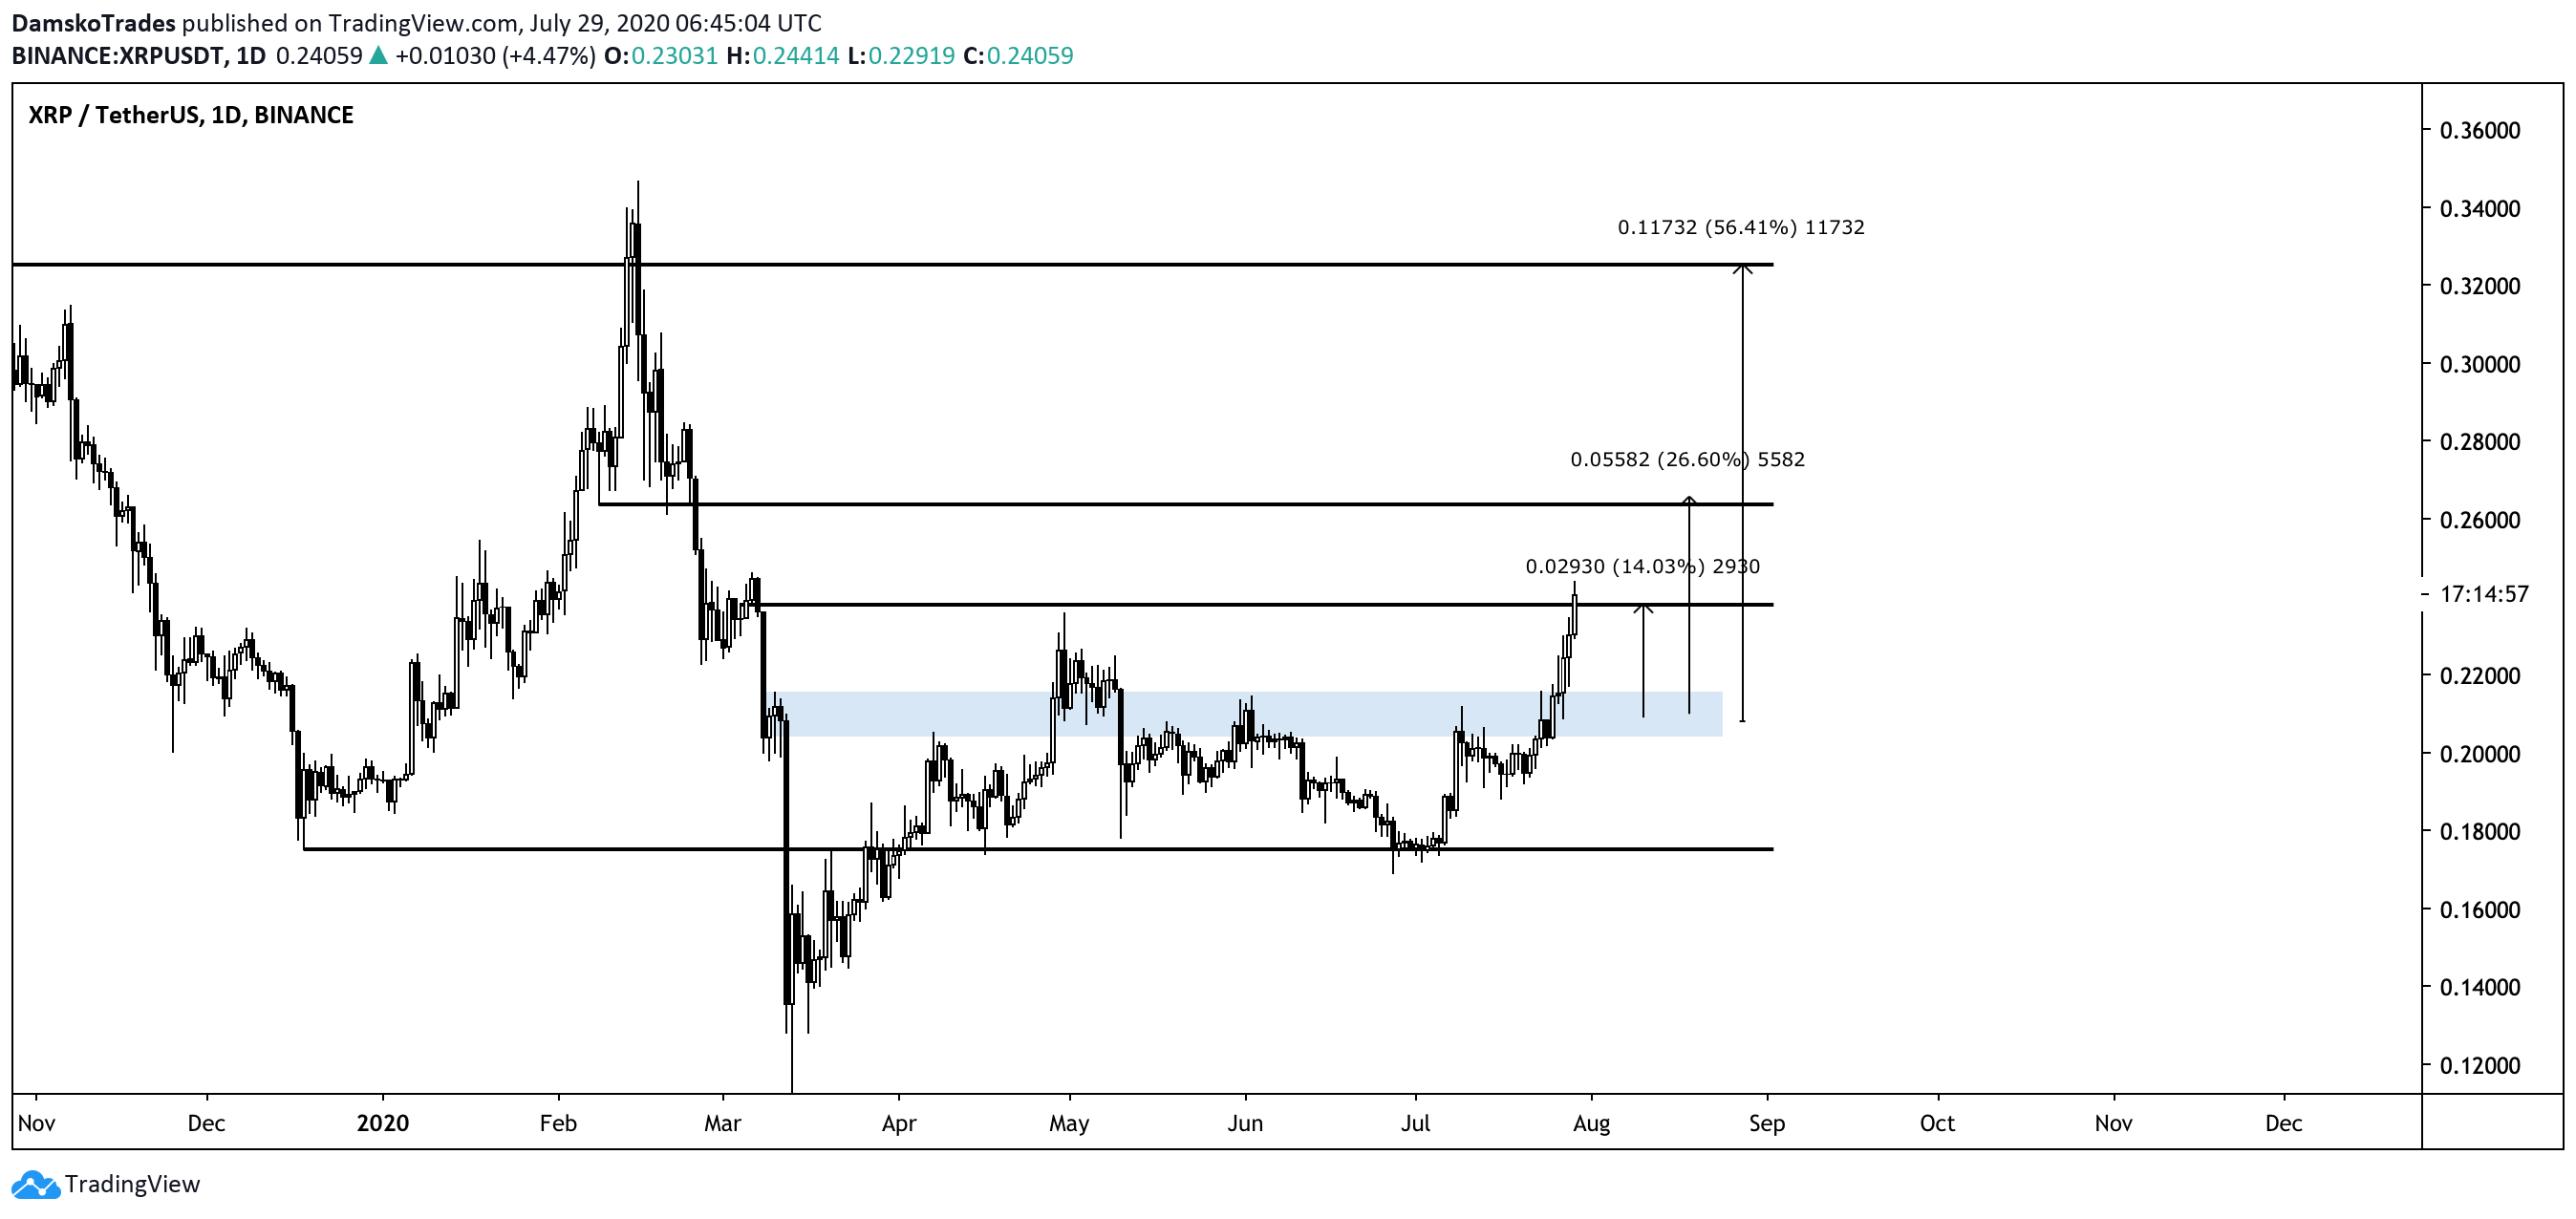
Cryptocurrency trader @Damskotrades outlined an XRP chart that shows several targets above the current price, at $0.270 and $0.335, respectively, the former of which is the closest resistance area outlined above.
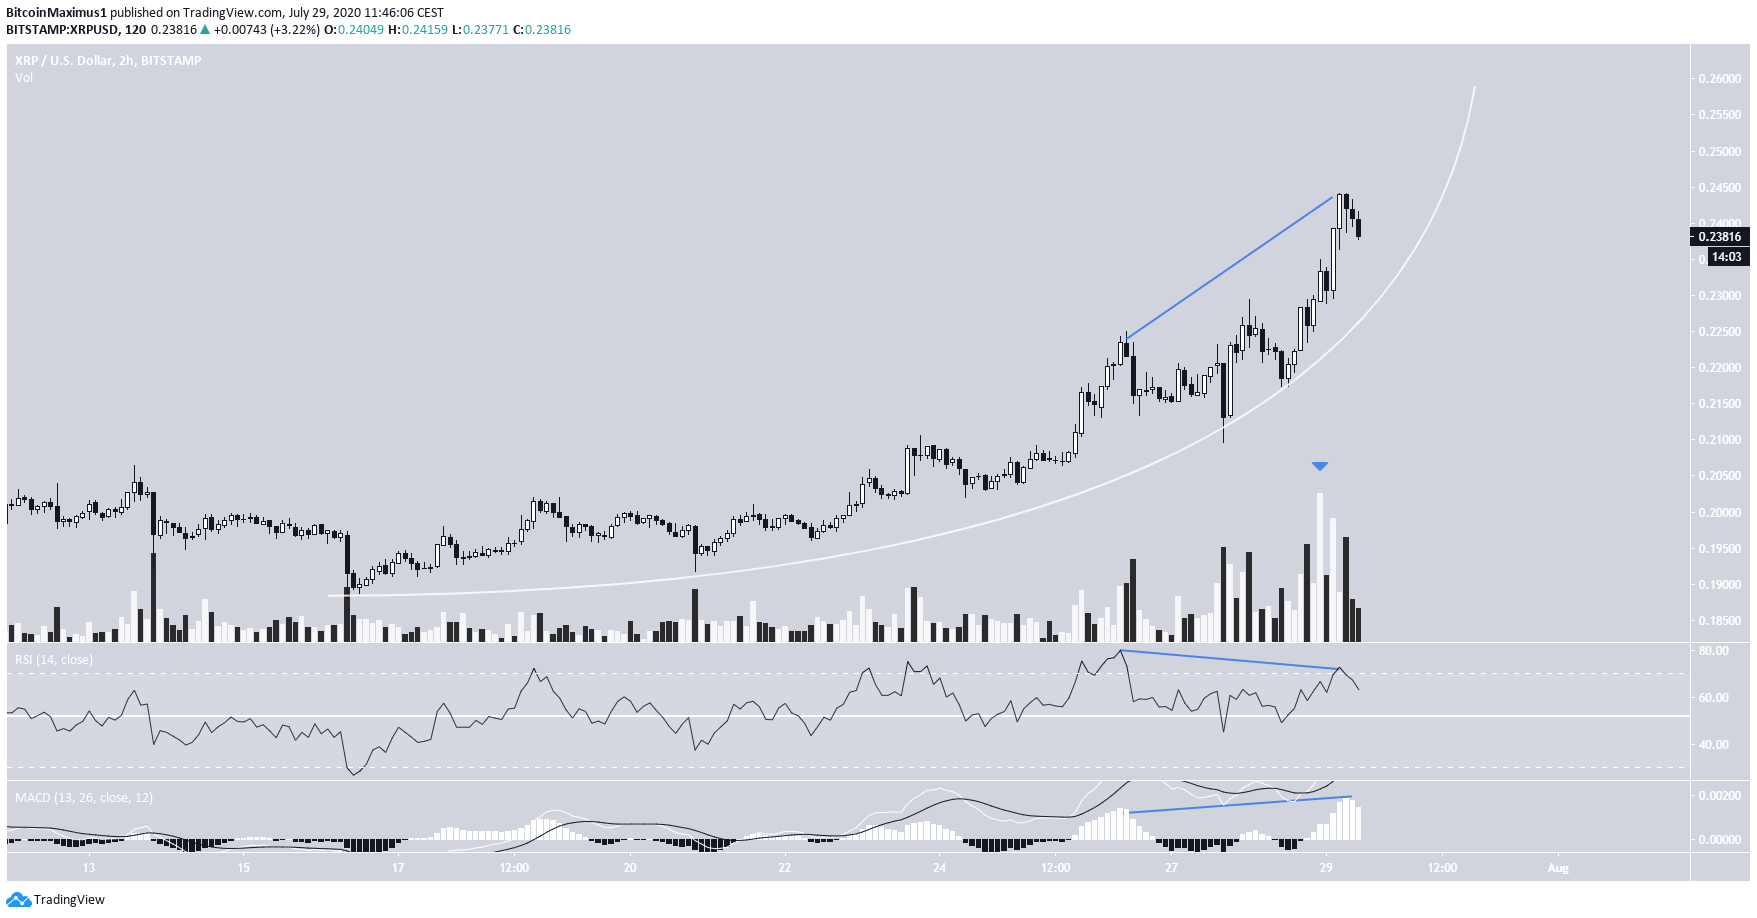
Parabolic Rise
Since July 16, the XRP price has been rising alongside a parabolic ascending support line. While this rise is unsustainable in the long-run, XRP can continue increasing alongside it for a while.
Technical indicators show some weakness, more specifically the bearish divergence on the RSI, but volume is increasing, and so is the MACD.
Therefore, after a possible drop to validate the parabolic line once more, XRP could continue rallying and reach the previously outlined $0.27 resistance area.
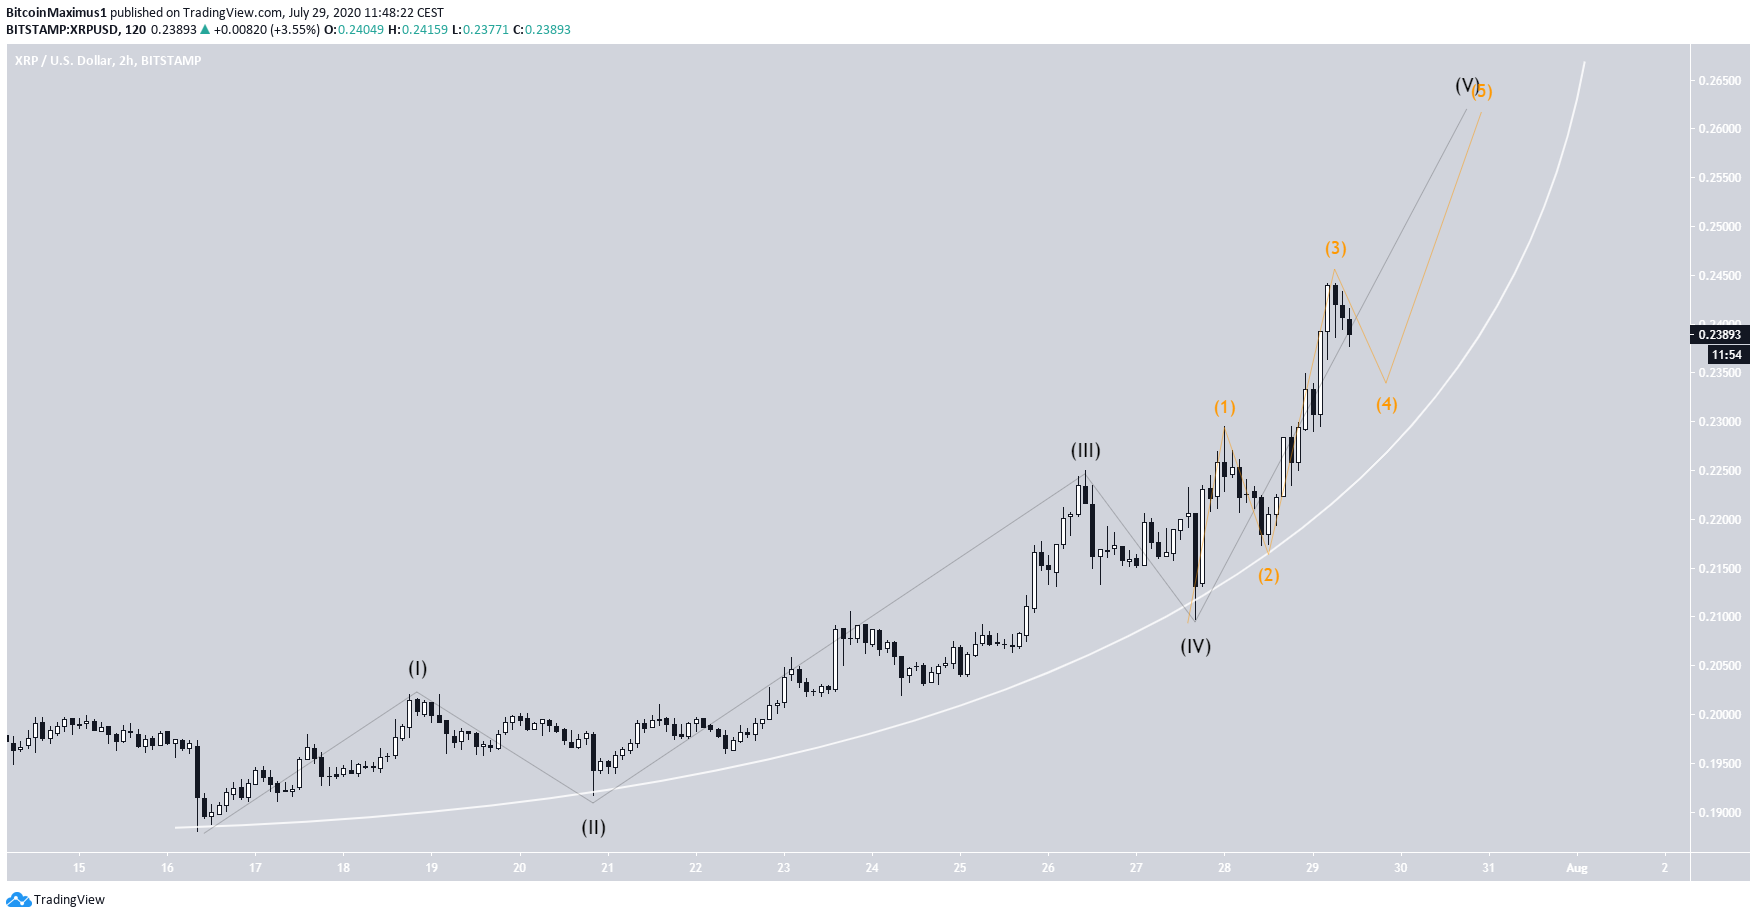
We have outlined a five-wave Elliott formation since the parabolic line began, with an extended fifth wave, inside which the price is currently trading.
The proposed decline would be sub-wave 4 of this wave, and then the final rise would take the price to $0.270.
To conclude, the XRP price has likely begun a new bullish trend. While a short-term retracement is possible, the price should reach the resistance area outlined above.


