


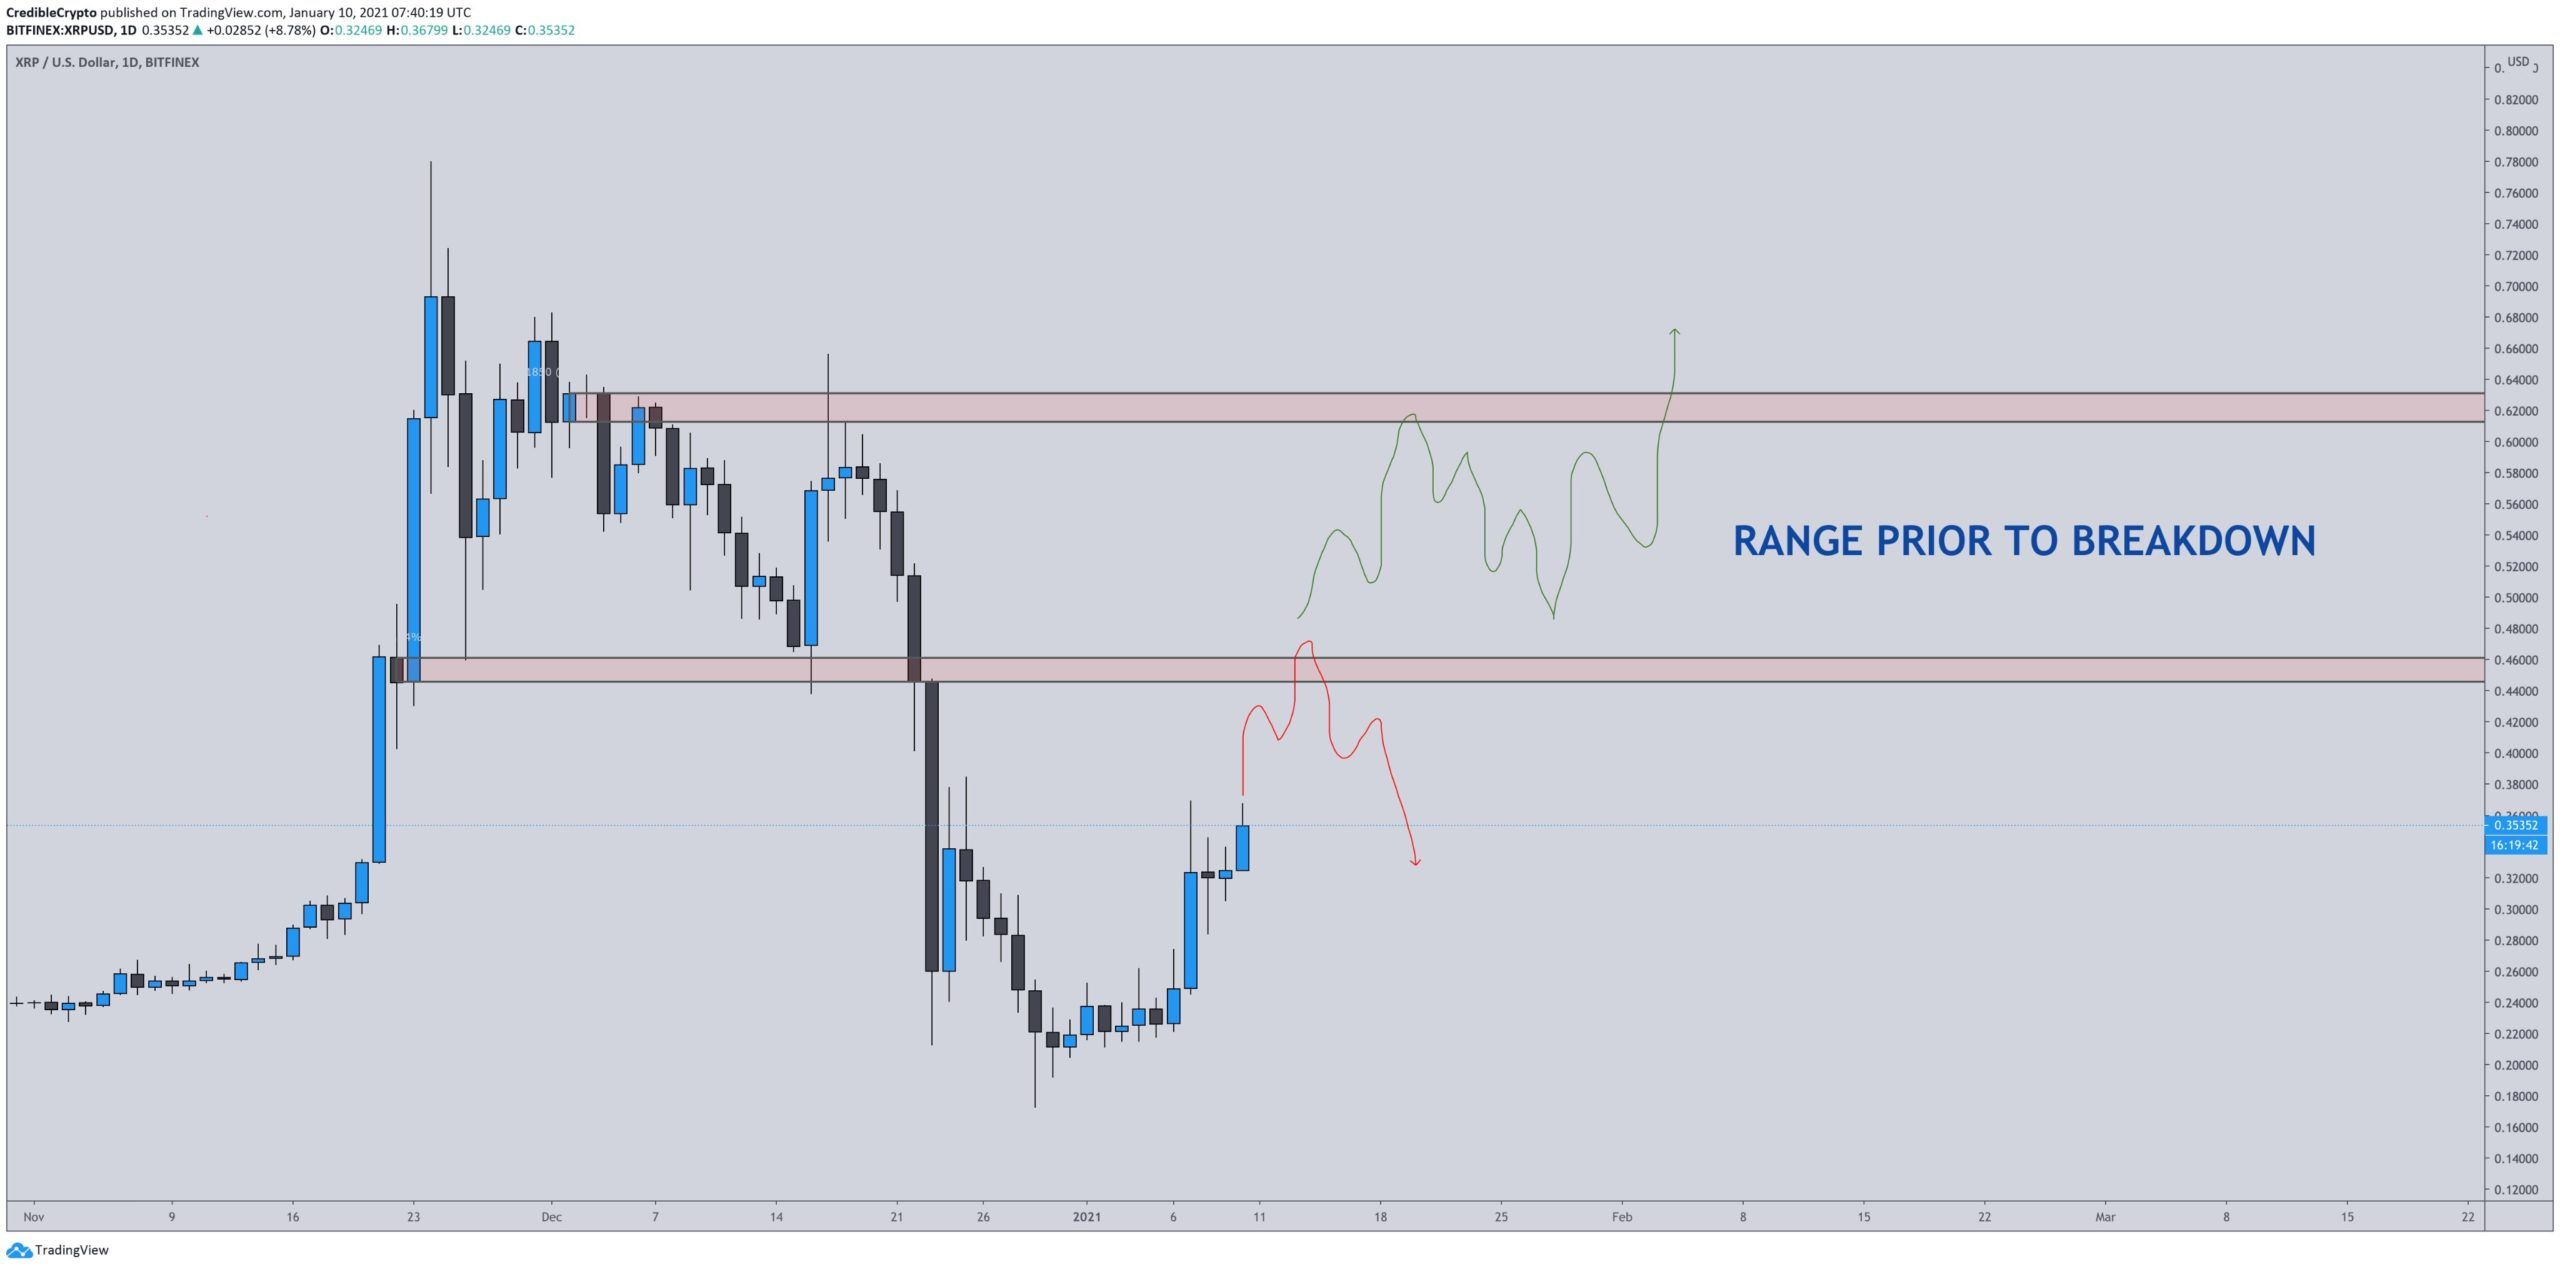
The XRP price has been increasing since Dec. 29. Nevertheless, the increase may only be a retracement in response to the rapid decline between 19-23 Dec.
We cannot consider the XRP trend bullish unless it reclaims $0.45.
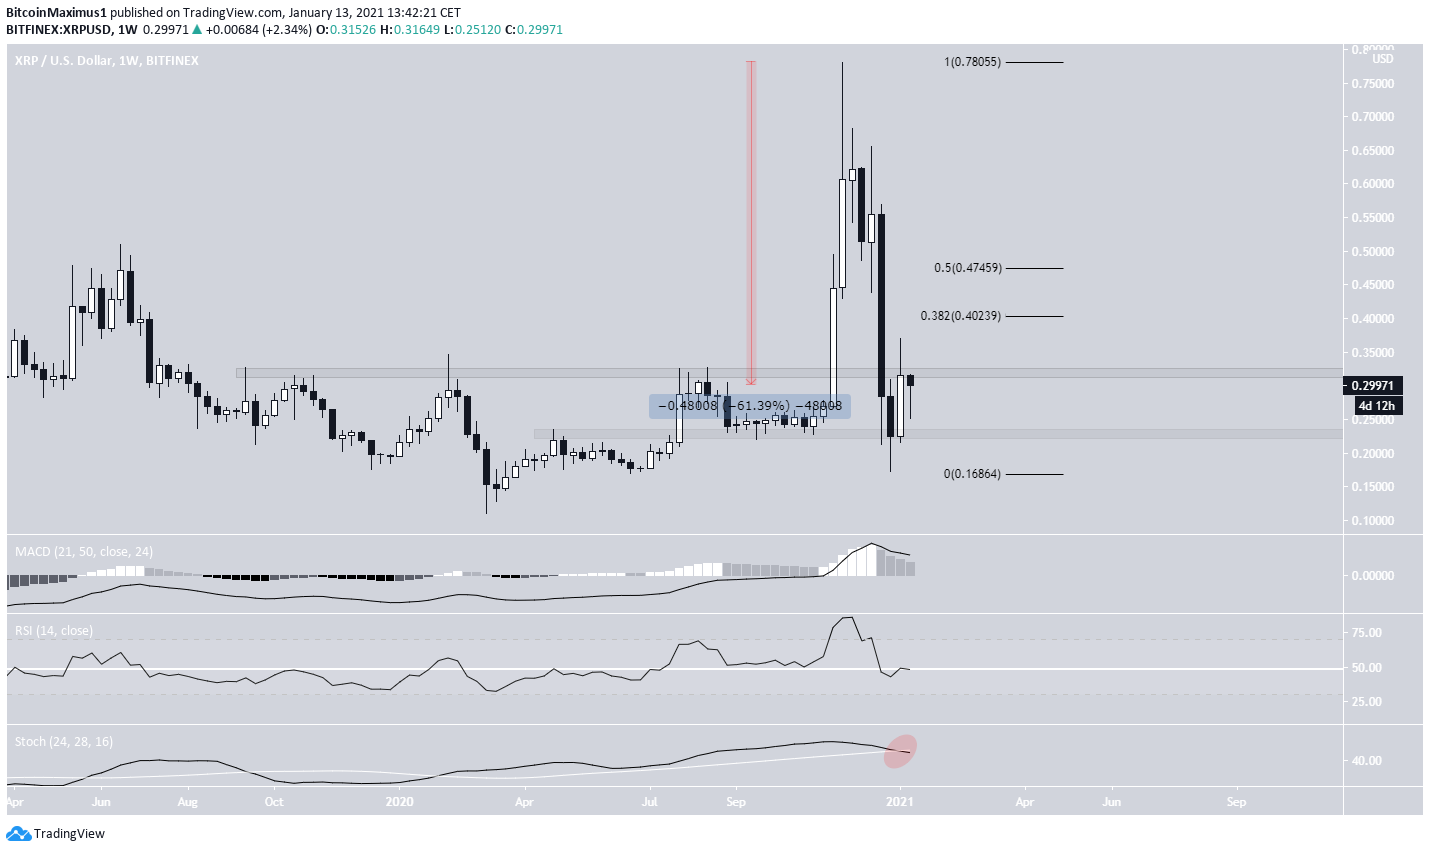
Long-Term Levels
Since reaching a high of $0.78 on Nov. 24, XRP has decreased by a massive 61%. However, it has been increasing since reaching a low of $0.172 on Dec. 29.
The fall took XRP to the $0.23 support area before initiating a bounce. XRP is currently trading in a range between $0.23-$0.30.
Even though weekly technical indicators are bearish, it has not retraced significantly since the drop.
The 0.382 Fib retracement level, which is often the minimum amount a move retraces, is at $0.40 while the 0.5 Fib retracement level is at $0.47
A reclaim of the latter would go a long way in suggesting that the XRP trend is now bullish.
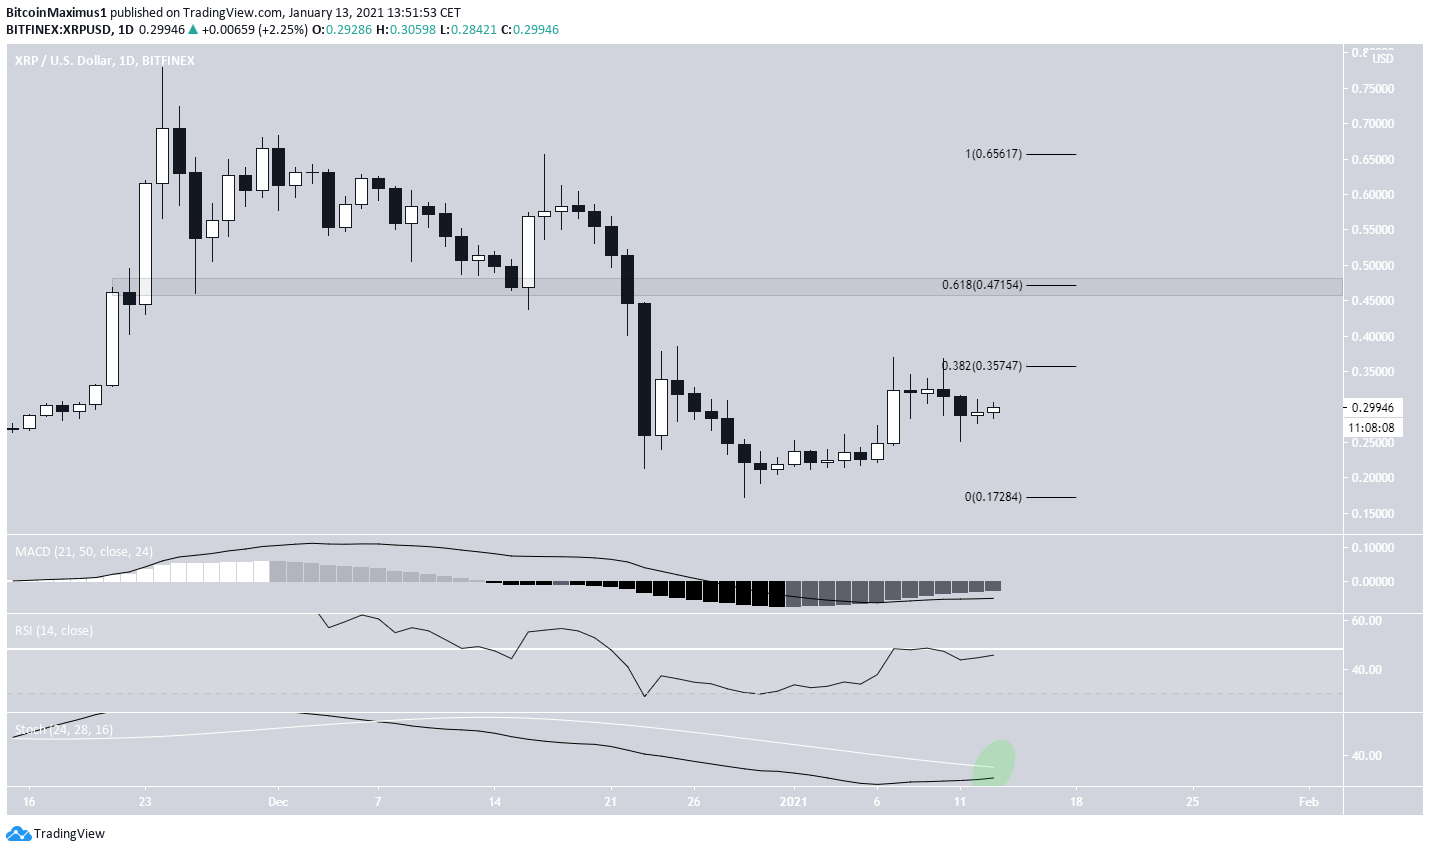
Cryptocurrency trader @Crediblecrypto outlined an XRP chart, stating that it’s likely to rally towards the $0.46 area.
Whether it reclaims it or gets rejected will be a major determinant in the direction of the trend. This fits with our analysis and resistance areas.
XRP’s Future Movement
A look at the daily chart further reiterates the importance of the $0.47 resistance area since it’s both the 0.618 Fib retracement level of the second portion of the downward move and was previously a support area.
The current upward move was preceded by significant bullish divergence in the daily RSI. All three of the: MACD, RSI, and Stochastic Oscillator are increasing, supporting a possible upward continuation.
A bullish cross in the Stochastic Oscillator and an RSI cross above 50 would likely predict a trend reversal.
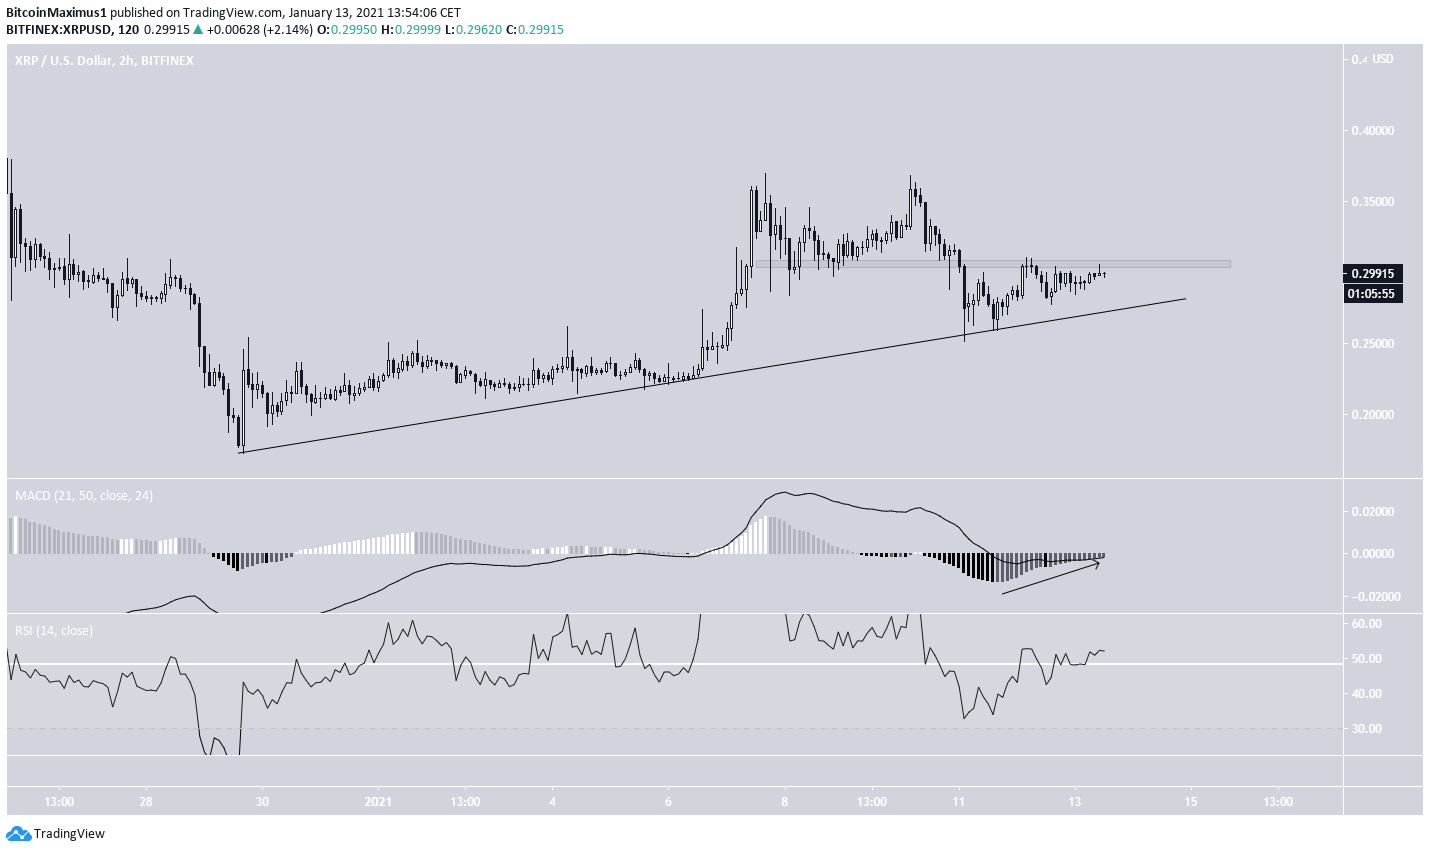
The shorter-term two-hour chart shows that XRP has followed an ascending support line since the previous Dec.29 bottom.
As long as XRP is trading above this line, the short-term trend is bullish. Technical indicators are also bullish, supporting a continuation of the upward movement.
If XRP manages to reclaim the minor $0.30 resistance area, the rate of increase should accelerate.
Conclusion
To conclude, while XRP is likely to continue retracing upwards, the long-term trend isn’t bullish until the $0.47 area is reclaimed.
For BeInCrypto’s latest Bitcoin (BTC) analysis, click here!
Disclaimer: Cryptocurrency trading carries a high level of risk and may not be suitable for all investors. The views expressed in this article do not reflect those of BeInCrypto.


