


Jed McCaleb founded Ripple Labs in 2012. This is the company that now produces XRP—formally called “Ripple.” McCaleb also co-founded Stellar in 2014.
While McCaleb is a common denominator, these are two very different cryptocurrencies. In this price comparison, we analyze both and determine which is best poised for long-term gains.
We begin with a technical analysis of Stellar Lumens (XLM) before performing one for XRP (XRP). We offer a brief analysis of the two together and noting similarities and differences.
Which will make it to the moon first?
Let’s find out.
Stellar Lumens (XLM) Analysis
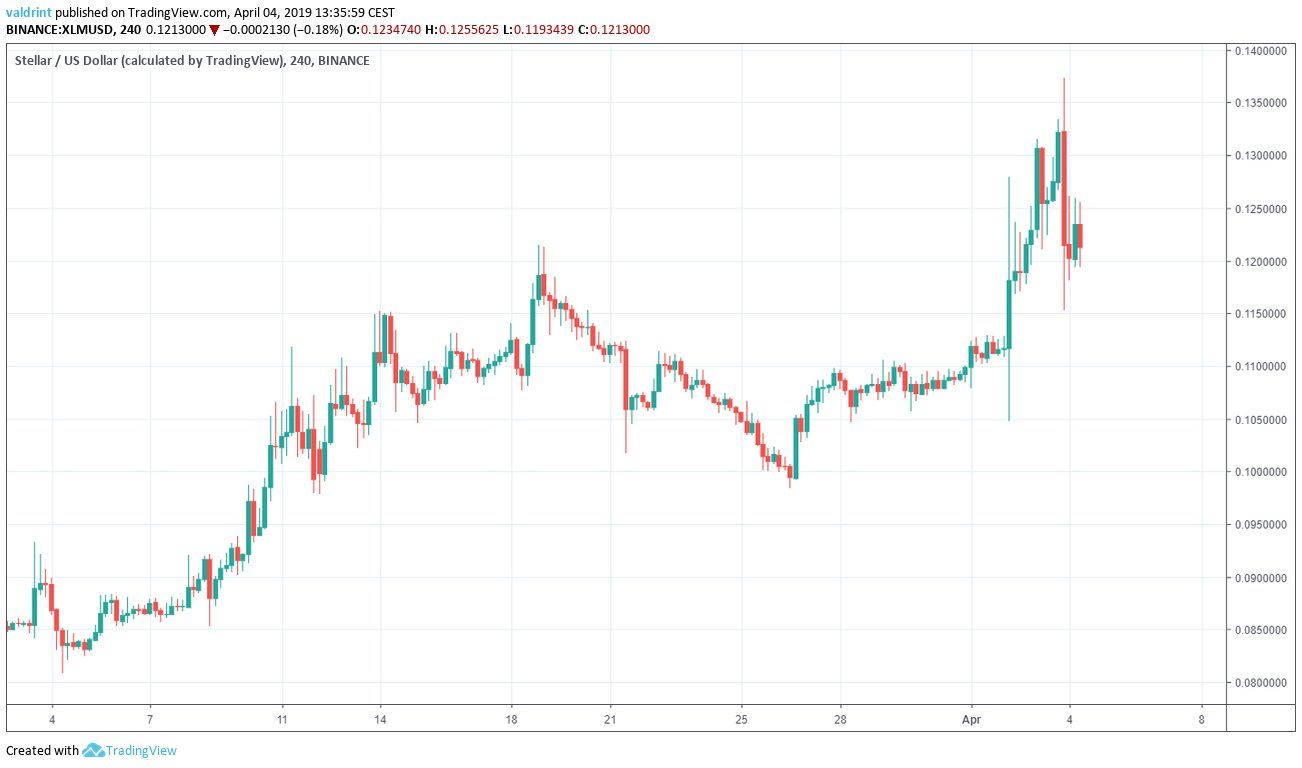
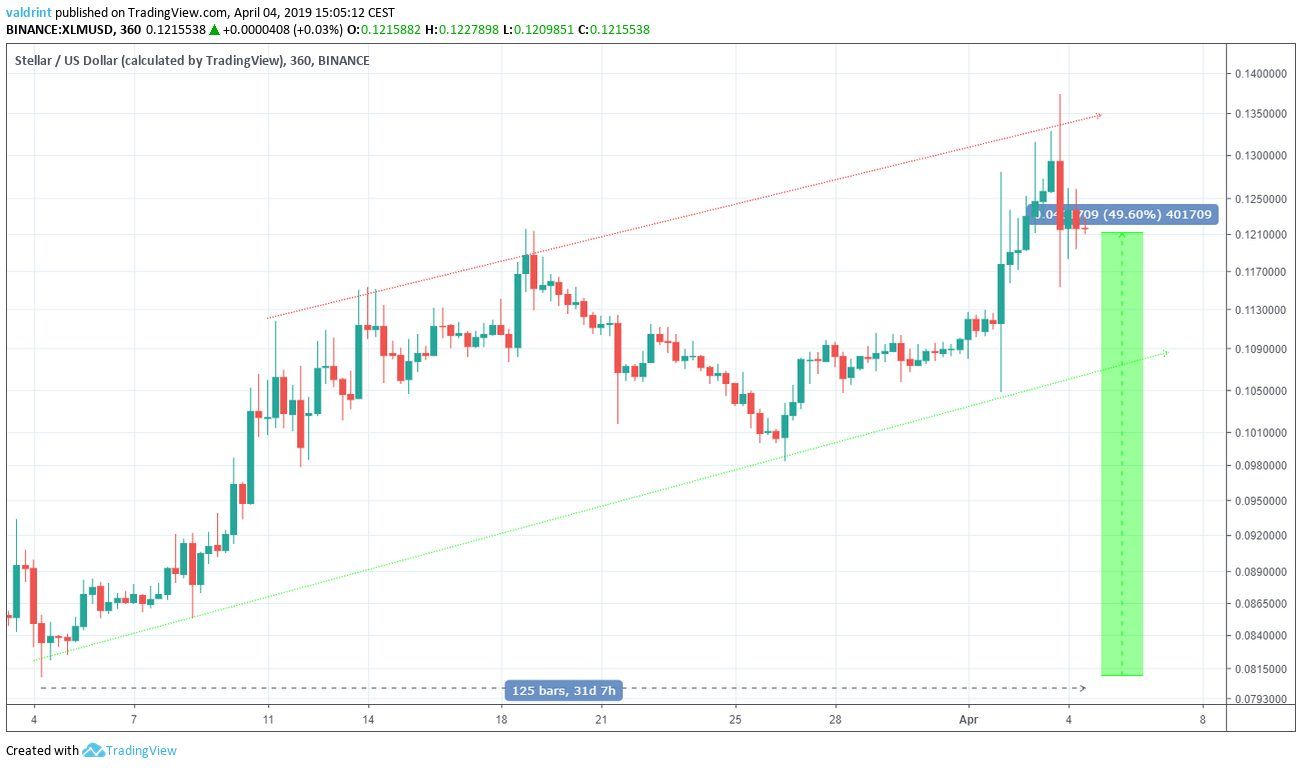
On Mar 4, the price made a low of $0.08. It has been on an uptrend since. At the time of writing, the highest price recorded was $0.137 on Apr 3.
What is going to happen next? Scroll below to find out.
Stellar Lumens (XLM): Highlights and Trends For April 4
- The price of XLM/USD has been on an uptrend since Mar 4.
- Stellar lumens are trading inside an ascending channel.
- Price is trading above the 50-period MA but below the 100- and 200-period MAs.
- Bearish divergence is developing in the RSI.
Ascending Channel
On Mar 4, the price made a low of $0.08. A gradual increase followed.
Several market cycles have been completed with each low being higher than the preceding one.
Tracing these lows gives us an ascending support line:
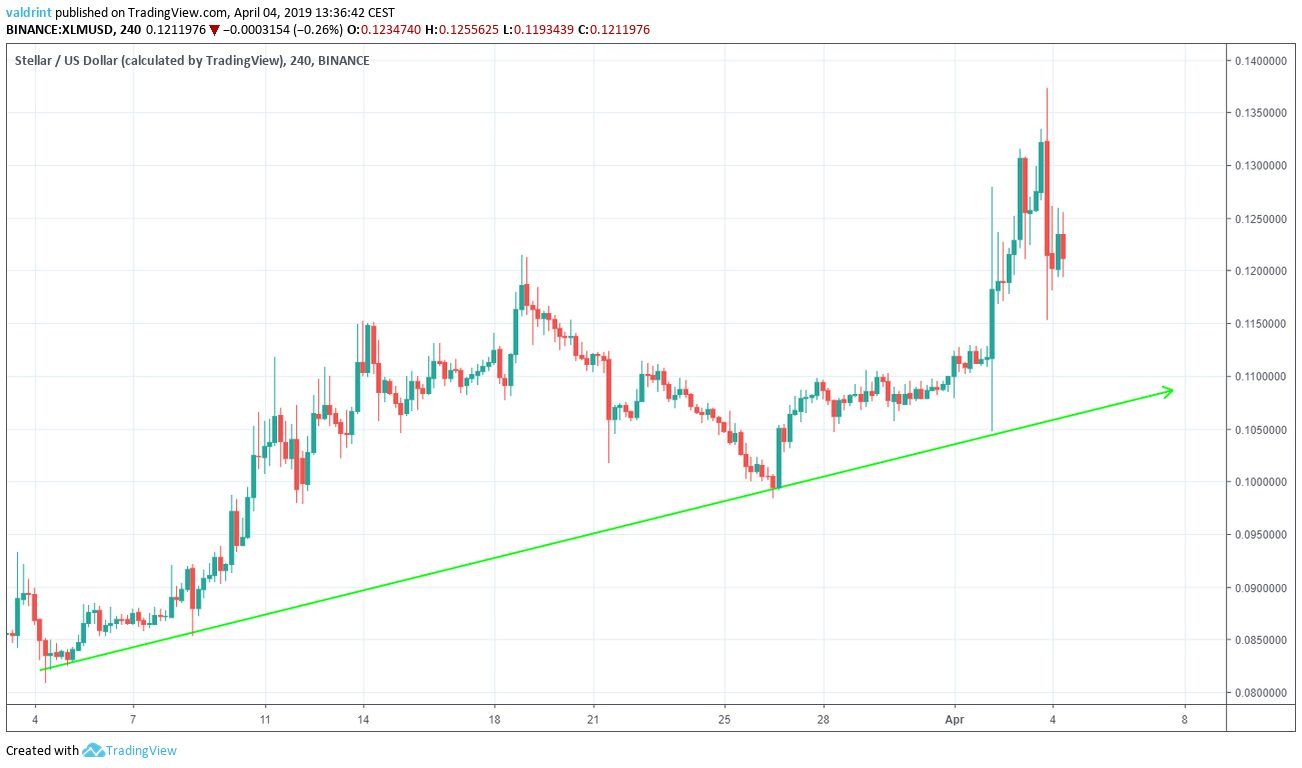
On Apr 11, the price reached a high of $0.111. Since then, it has been making successive higher highs.
Tracing these highs gives us an ascending resistance line.
The resistance and support lines combine to create an ascending channel:
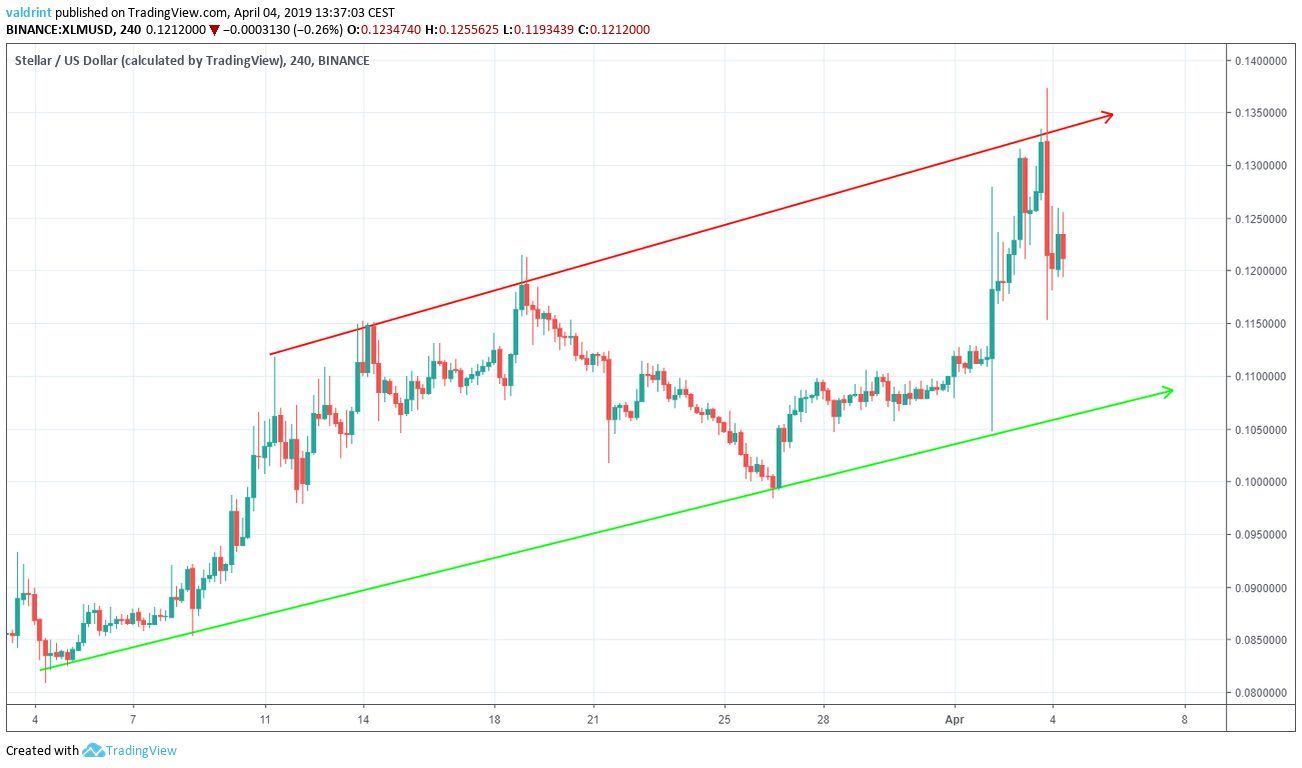
The price of XLM/USD has risen and fallen within this trend since March. Prices have gradually increased during this period despite volatility.
Technical Indicators
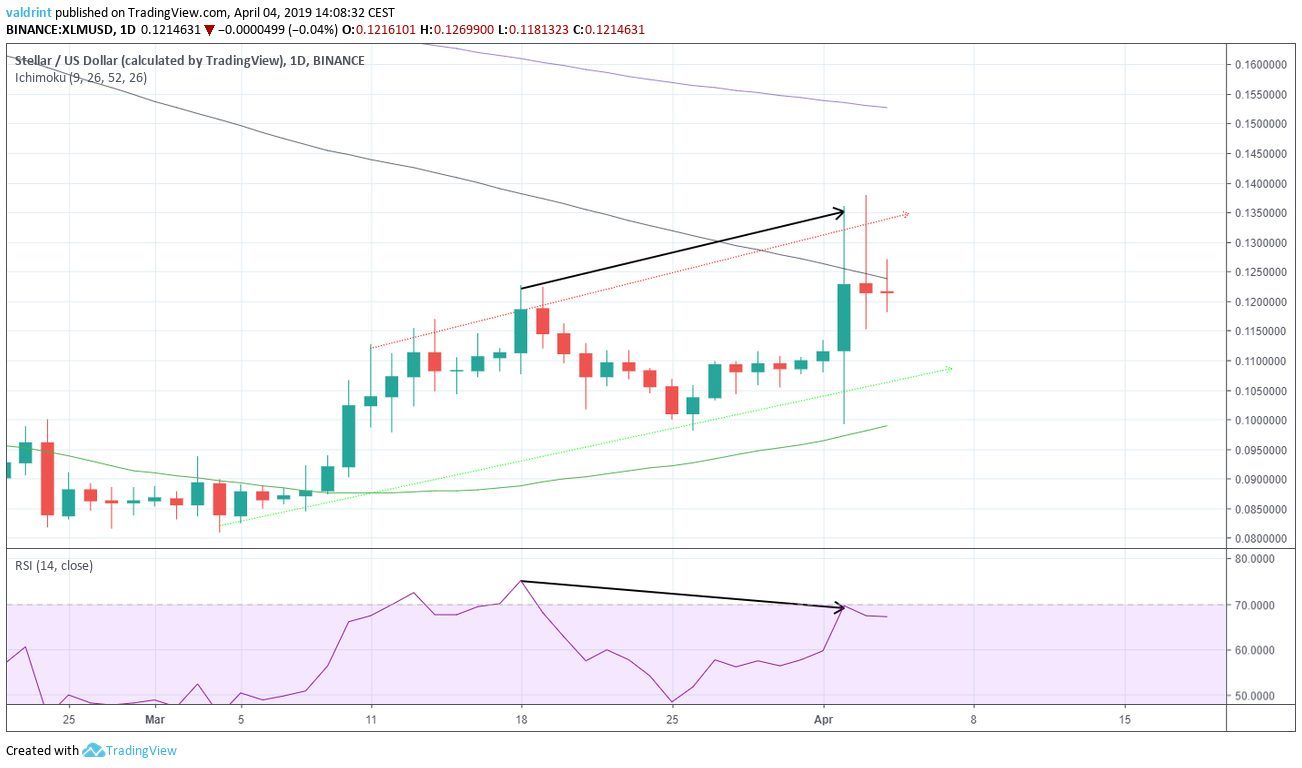
On Mar 9, the price moved above the 50-period moving average (MA). It unsuccessfully attempted to move past the 100-period MA on Apr 2 and 3. Furthermore, Stellar lumens are trading well below the 200-period MA.
In addition, the price reached a high of $0.122 on Mar 11. It proceeded to make a higher high of $0.136 on Apr 2. Similarly, the RSI reached the first high on Mar 11. However, it has proceeded to generate lower values since.
This is known as bearish divergence and often precedes price decreases. During the market-wide spike in early April, XLM reached the resistance line. A drop toward support is both suggested by the channel and these indicators.
XRP (XRP) Analysis
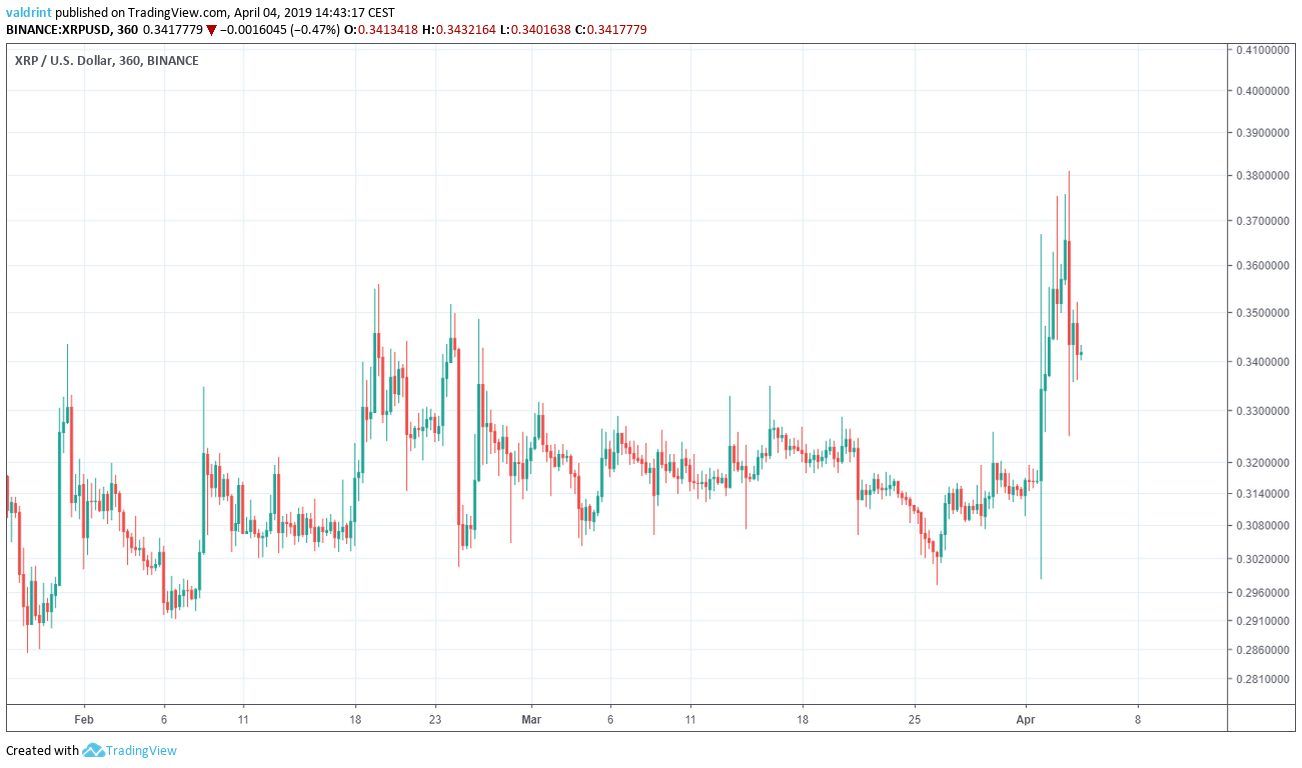
On Jan 28, the price of XRP reached a low of $0.285. It has been on an uptrend since.
At the time of writing, the highest price recorded was $0.381 on Apr 3.
XRP (XRP): Highlights and Trends For April 4
- The price of XRP/USD has been on an uptrend since Jan 28.
- XRP is trading inside an ascending channel.
- In addition, XRP is trading above the 50-period MA but below the 100- and 200-period MAs.
Ascending Channel
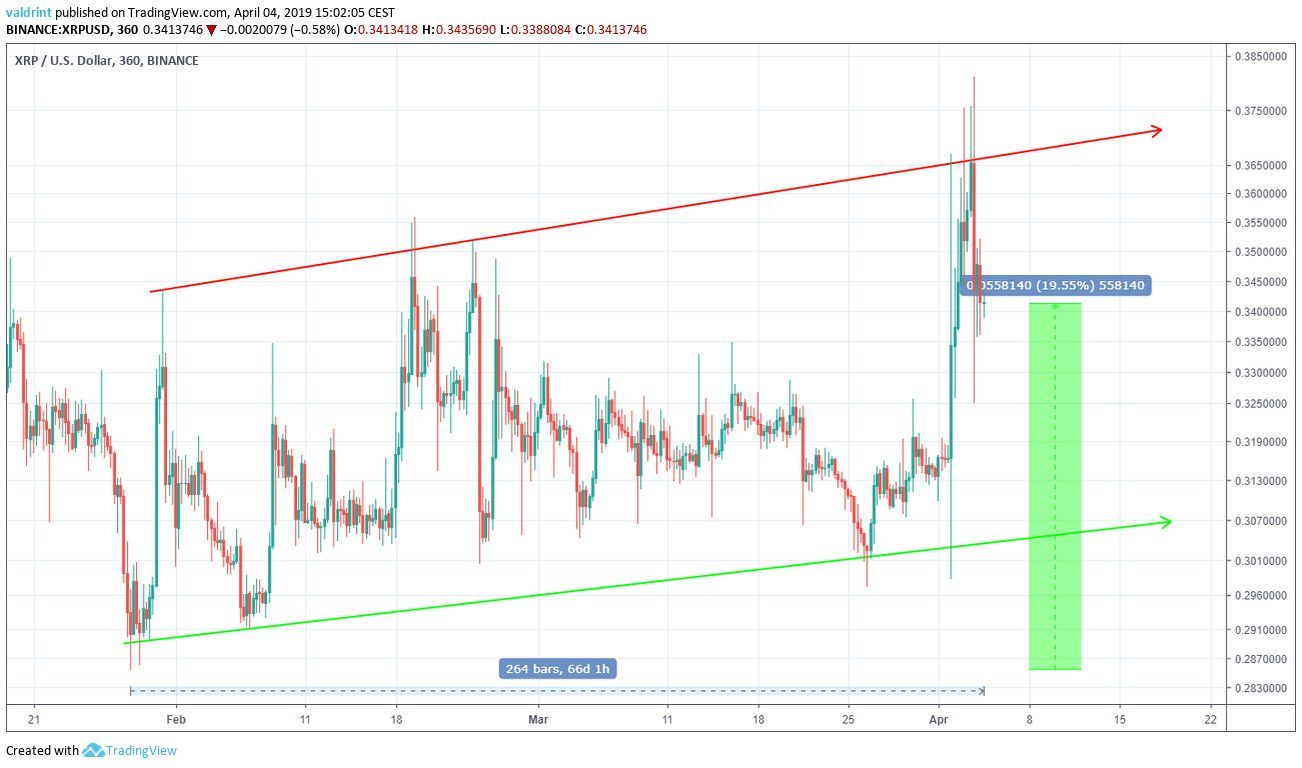
The price of XRP/USD is analyzed at six-hour intervals from Apr 1 to Apr 3 to help determine current trading patterns.
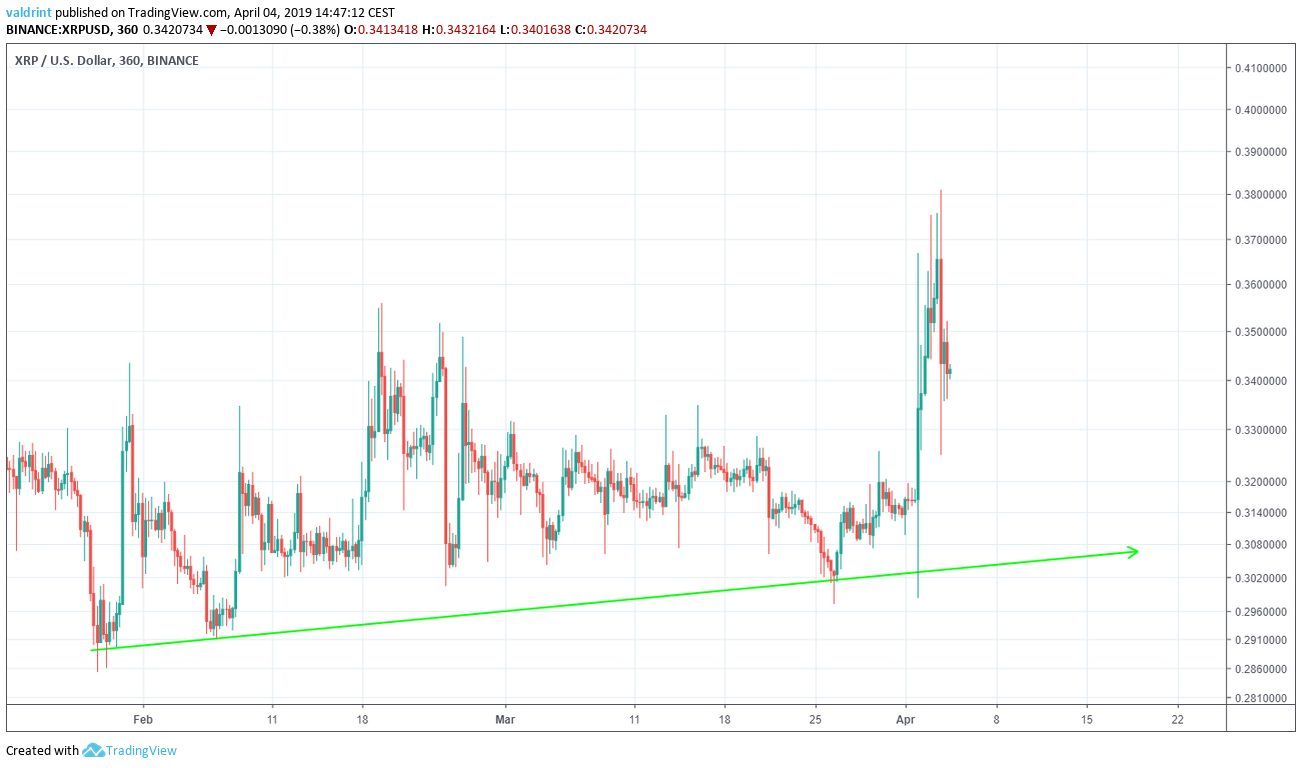
On Jan 28, the price reached a low of $0.285. Several market cycles have been completed with each low being higher than the preceding one.
Tracing these lows gives us an ascending support line:
On Jan 31, the price reached a high of $0.343. Since then, it has been making successive higher highs.
Tracing these highs gives us an ascending resistance line.
The resistance and support lines combine to create an ascending channel:
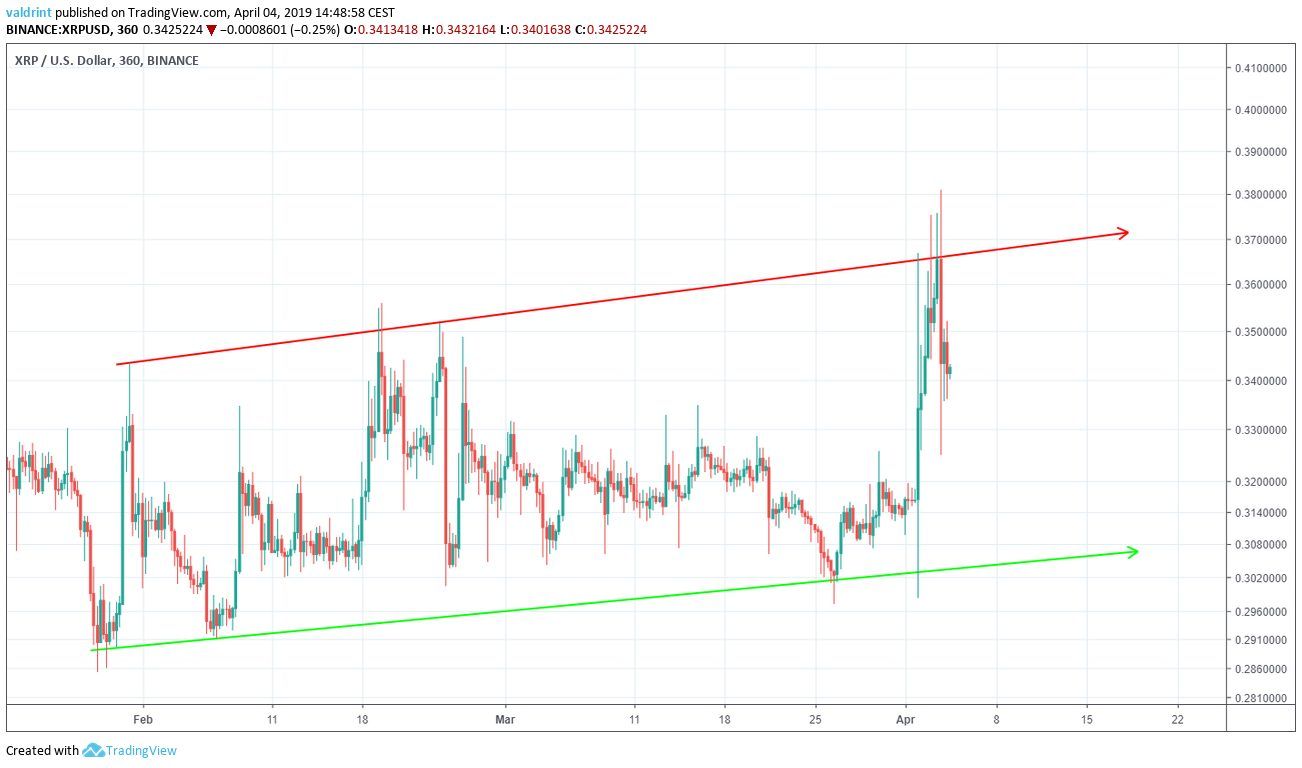
Since the channel is upward facing, price increases at the rate predicted by the channel are likely. The same is true of Stellara lumens.
Technical Indicators
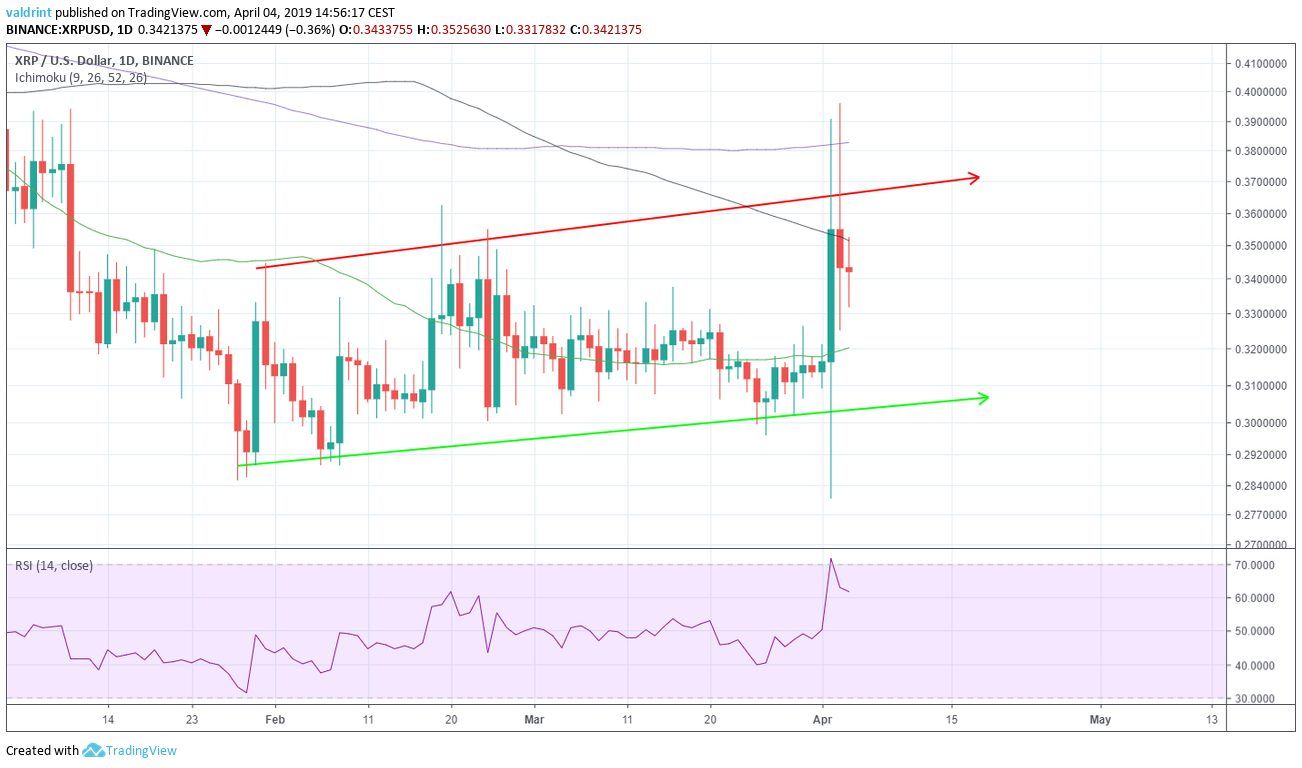
On Feb 19, the price moved above the 50-period moving average (MA).
On Apr 2, the price began a rapid upward move, and briefly moved above the 100 and 200-period MAs. However, it got pushed back and is currently trading below both.
On Apr 2, the RSI moved above 70, indicating overbought conditions. However, there is no divergence developing yet.
XLM vs. XRP: Price Trend Comparison
The price of XRP has been trading in an ascending channel for the past 66 days.
The difference between the Jan 28 price of $0.285 price—which was experienced at the beginning of the channel—and the current price is 19.55%
XLM has been trading inside an ascending channel for the past 31 days.
The difference between the $0.08 price—which occurred at the beginning of the channel on Mar 4—and current price is 49%.
In other words, StellarlLumens have seen greater price increases in a short period than XRP.
However, while past price gains are important, future price fluctuations may be a more valuable indicator as to whether or not lumens will win this battle.
Future Movements of XLM and XRP
The price of XLM/USD is trading above the 50-period moving average, but below the 100 and 200-period MAs.
It has made an attempt to break out above the 100-period MA, but has never reached the 200-period MA.
Furthermore, there is significant bearish divergence developing in the RSI.
The price of XRP/USD is trading above the 50-period moving average but below the 100 and 200-period MAs.
It has made an attempt to break out above the both the 100 and 200-period MAs, but it was rejected and dropped below them.
There is no divergence developing in the RSI.
This might suggest that Stellar lumens are at a greater risk of future price losses than XRP. Of course, lumens are significantly exceeding XRP in terms of price gains. While losses may be expected for the former, overall gains may still be higher once a reversal is initiated.
In short, Stellar lumens appears to be the victor over XRP despite XRP’s higher market cap.
Do you think XRP will outperform XLM in the month of April? Let us know in the comments below.
Disclaimer: This article is not trading advice and should not be construed as such. Always consult a trained financial professional before investing in cryptocurrencies, as the market is particularly volatile.


