


The EOS (EOS) price has once again reached the $3.1 resistance area, above which it has not traded since March. An eventual breakout should take the price towards $3.9.
Will EOS Break Out?
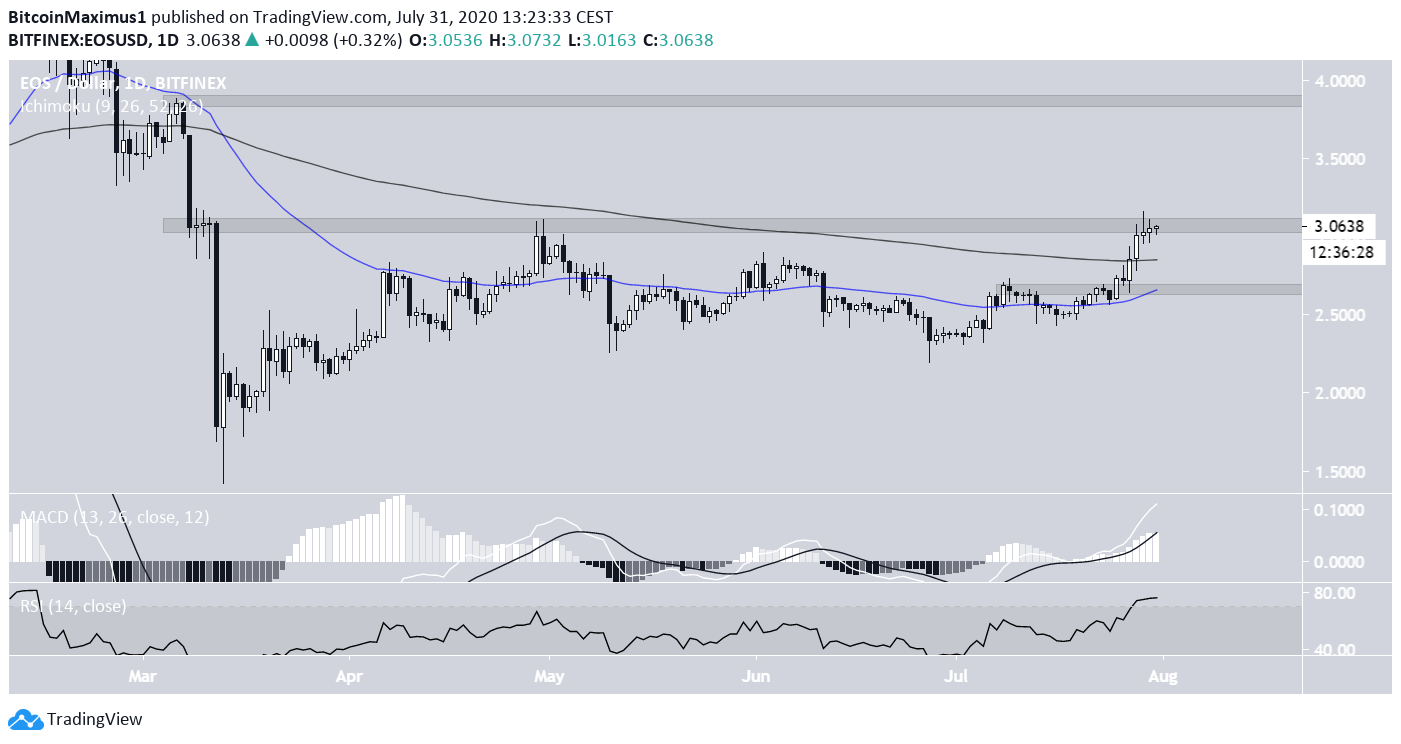
The EOS price has been increasing since March 13. The price reached the $3.10 resistance area on April 29 and began a downward move that lasted until July. Afterward, the price initiated an upward move that is still ongoing and has taken the price to the $3.10 resistance area again.
While the price has created several long upper wicks inside this area, technical indicators are bullish. The MACD is increasing, and so is the RSI, even though the latter is overbought.
The price is trading above both the 50 and 200-day moving averages (MA), which are close to making a bullish cross. If successful in breaking out, the next resistance area would be found at $3.90, while the nearest support area is located at $2.72, coinciding with the 50-day MA.
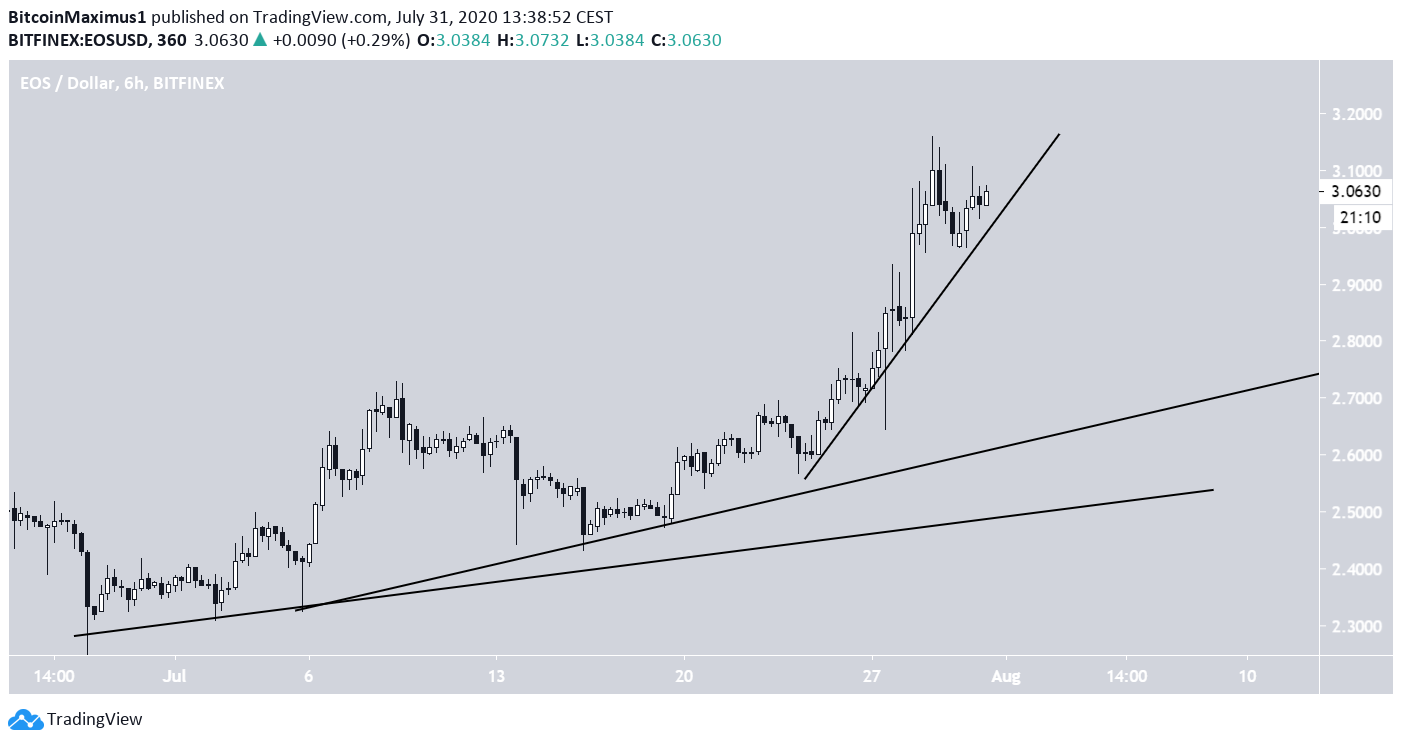
The shorter-term chart reveals that since June 18, the price has created a steeper ascending support line each time it initiated an upward move.
Neither of the lines has been broken yet, so the move is liable to continue.
Wave Count
Cryptocurrency trader @TheEWguy outlined a five-wave formation that began in March and would take EOS all the way to $8.3
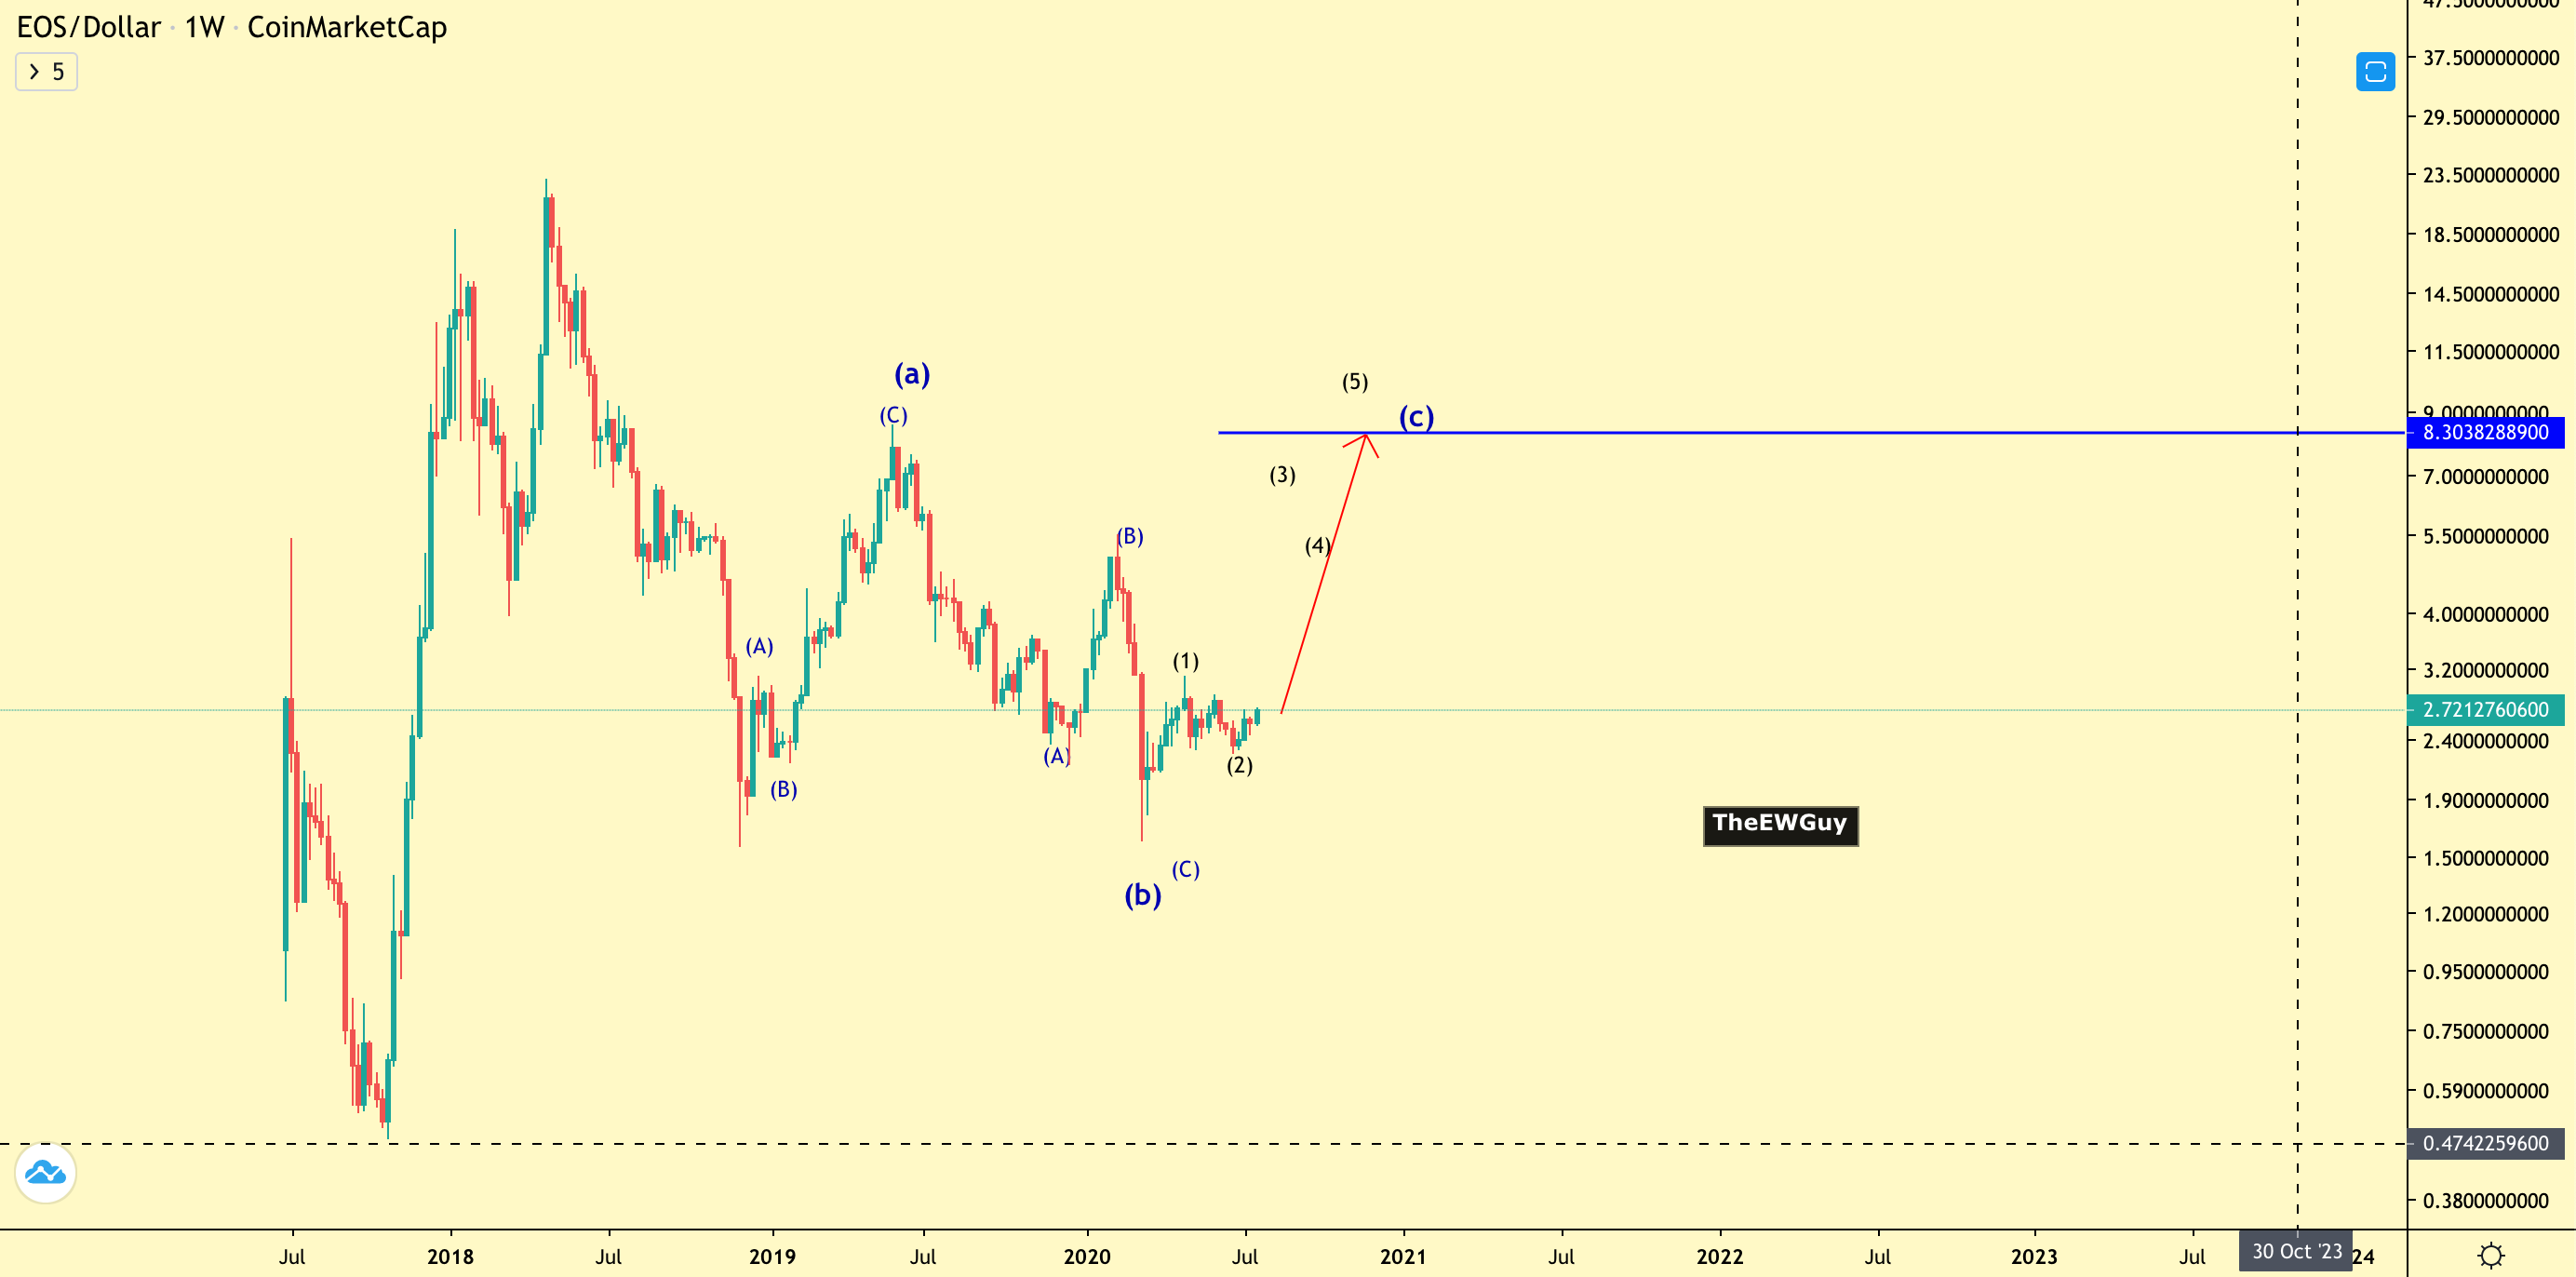
Using the same beginning point for the impulse, we can assume that we are already in wave 3 (black) and the fifth sub-wave (green).
While it’s too early to determine the exact highs of each wave, it would make sense for the third wave to end near the resistance area at $3.90. This depends on the EW rule which states that wave 3 cannot be the shortest.
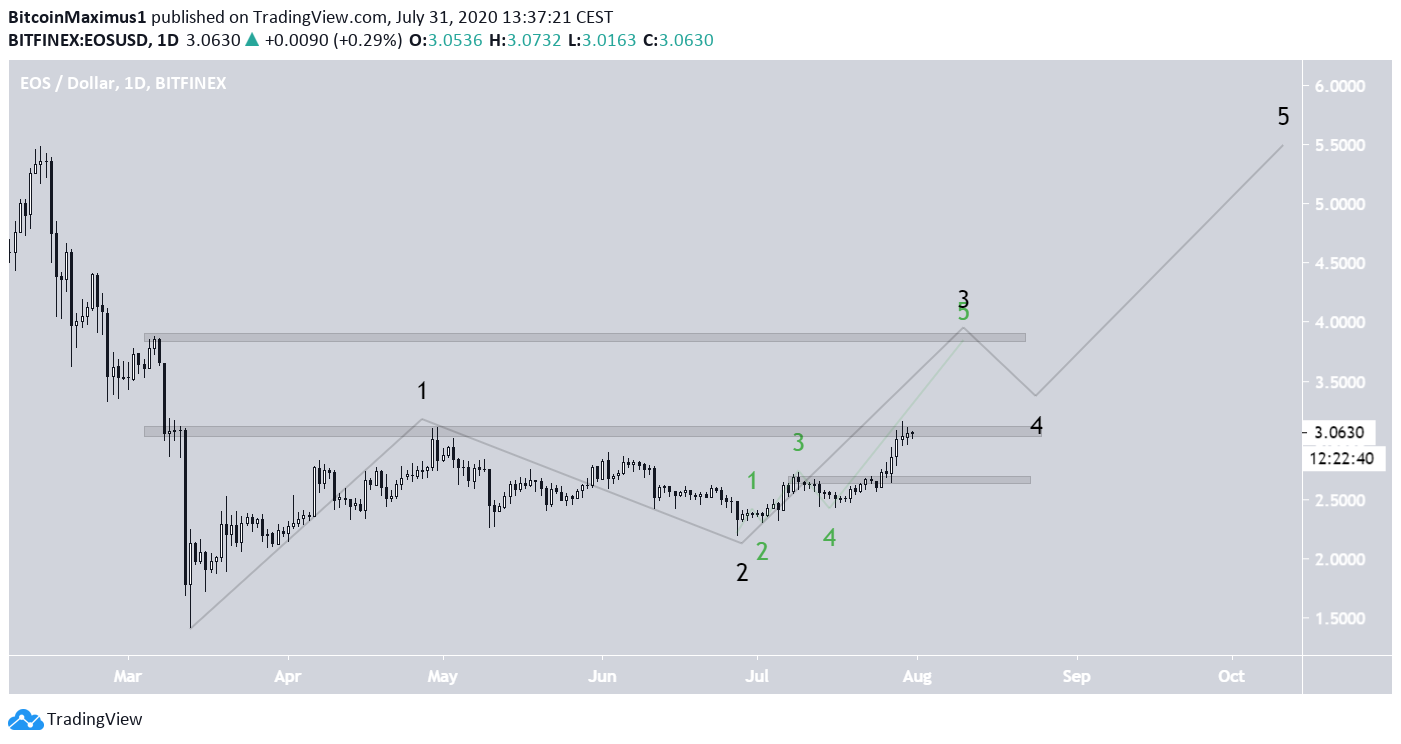
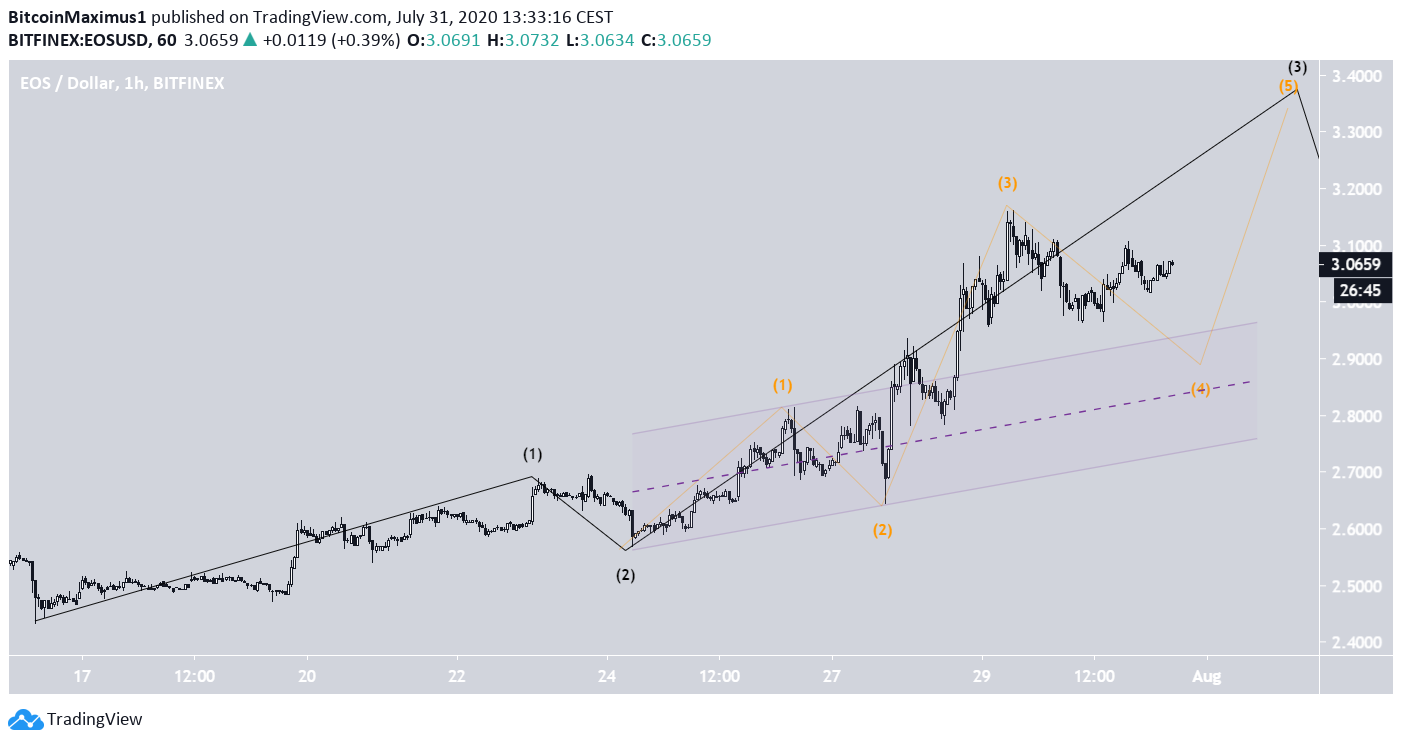
In the shorter-term, it seems that the price is currently correcting, after breaking out from a parallel ascending channel.
Once the correction is completed, the price should make another leg up and break out from the resistance area outlined in the first section. The correction will likely end near the resistance line of the channel, which should now act as support.
To conclude, after a potential short-term retracement, EOS should break out from its long-term resistance area and continue moving upwards.


