After breaking out from a long period of consolidation, ZIL increased by more than 400% in roughly a month. XVG’s recent price action suggests that it too could go on a similar run.
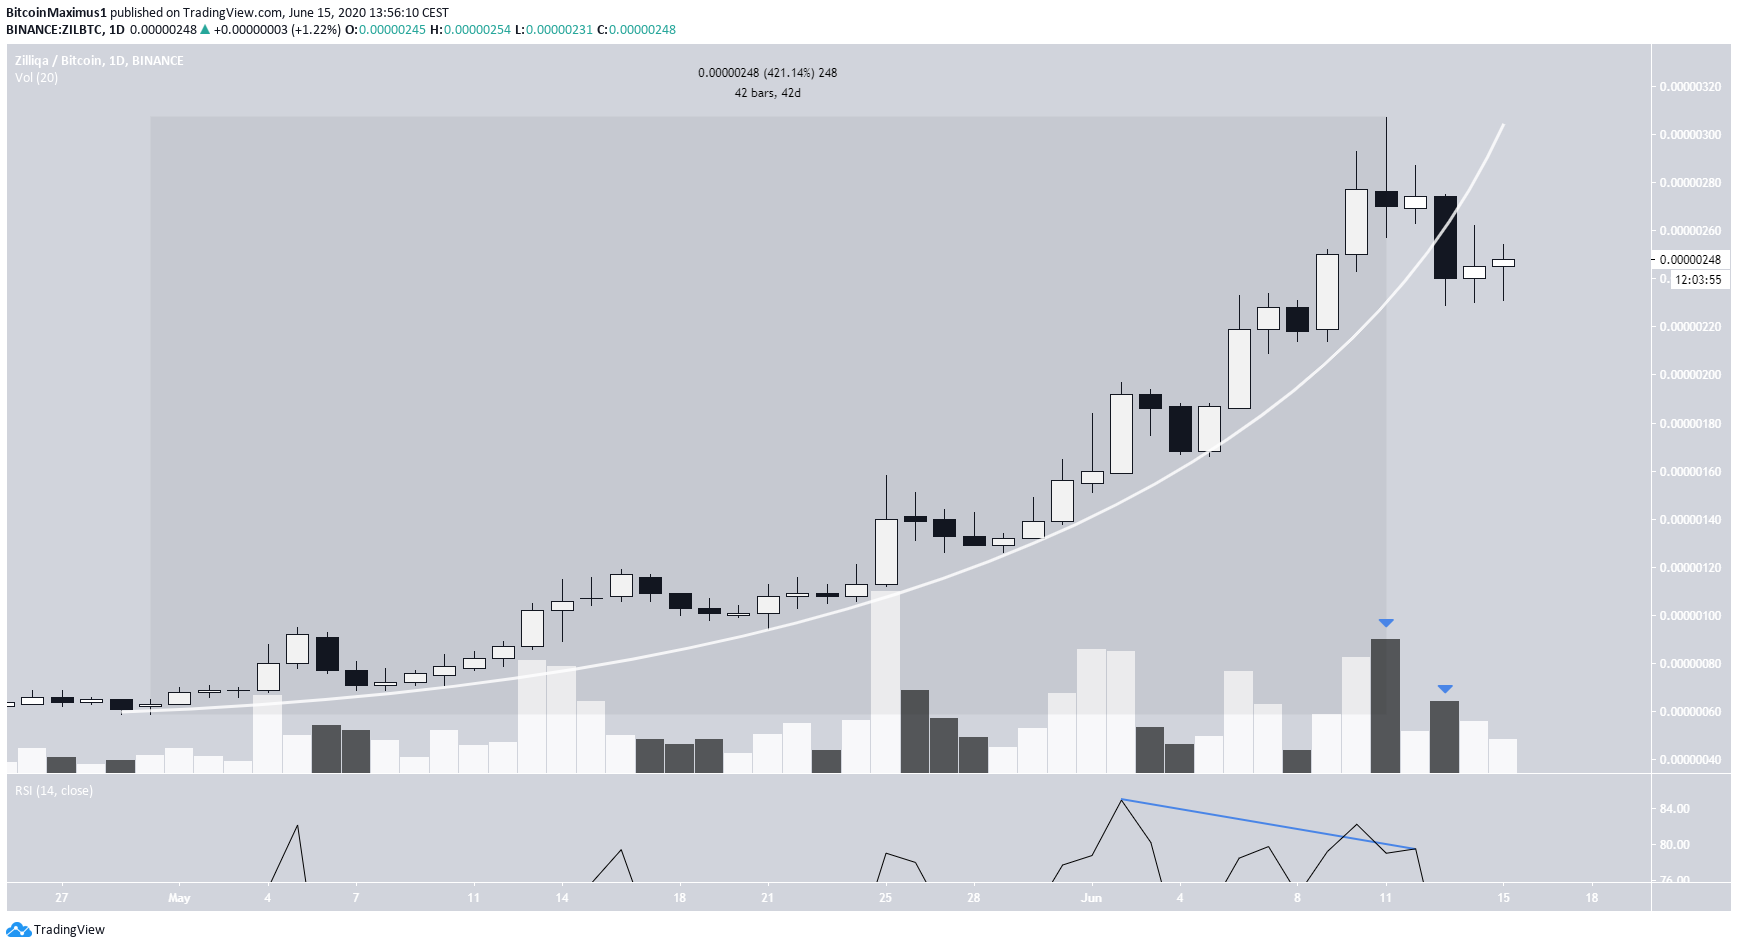
Zilliqa (ZIL)
In the period from April 30 to June 11, the ZIL price increased by 424%, reaching a high of 307 satoshis. However, on June 11, the price created a bearish doji candlestick with considerably high volume and has been decreasing since.
Coming after such a significant upward move, the doji can be viewed as a reversal sign. The price broke down shortly after and invalidated the parabolic ascending support line it was following since the start of the move.
This breakdown was preceded by significant bearish divergence on the daily RSI, which was also oversold. Therefore, the upward move is likely over, and a corrective period has just begun.
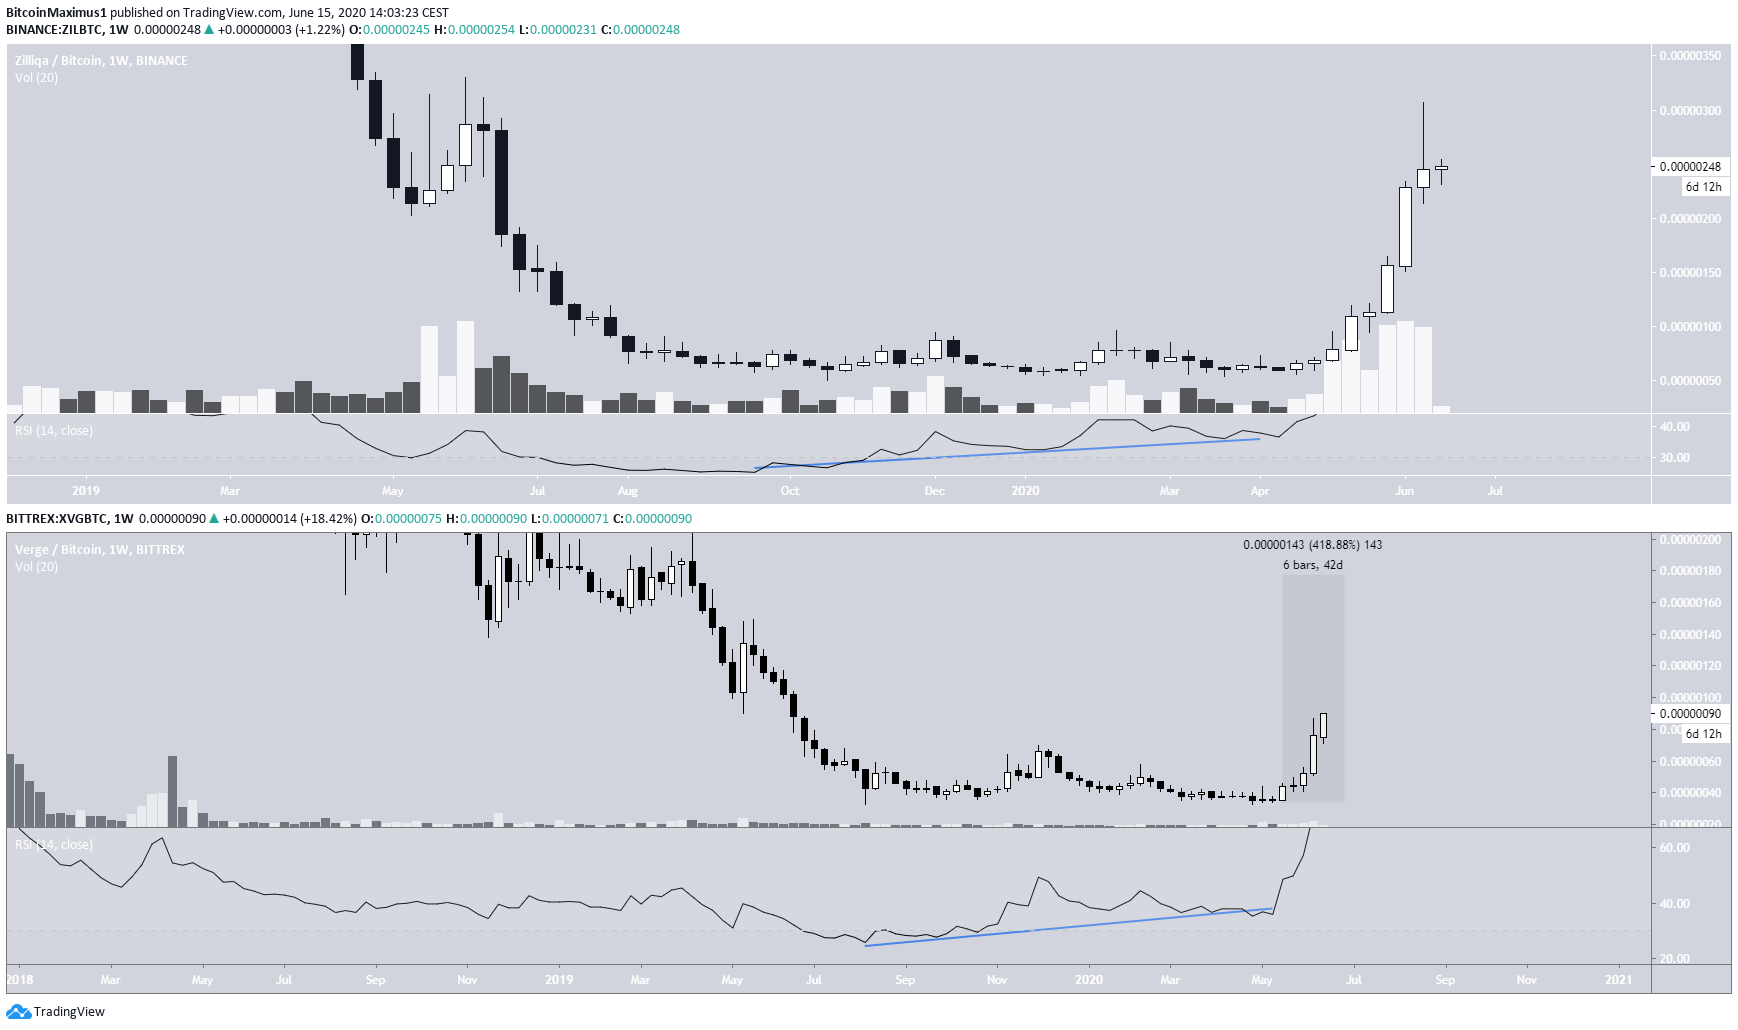
Comparison to XVG
Crypto_Harlock believes that the movement for XVG and ZIL is very similar. Indeed, when looking at their weekly time-frames, the similarities are noticeable.
After a roughly one year period of consolidation, in which the weekly RSI generated considerable bullish divergence, ZIL initiated an upward move as discussed in the previous section.
A similar move is currently taking place for XVG. The price consolidated below 70 satoshis for ten months, a period in which the weekly RSI formed considerable bullish divergence.
The price began an upward move near the end of May. If an increase similar to ZIL takes place, the price could reach a high of 170 satoshis.
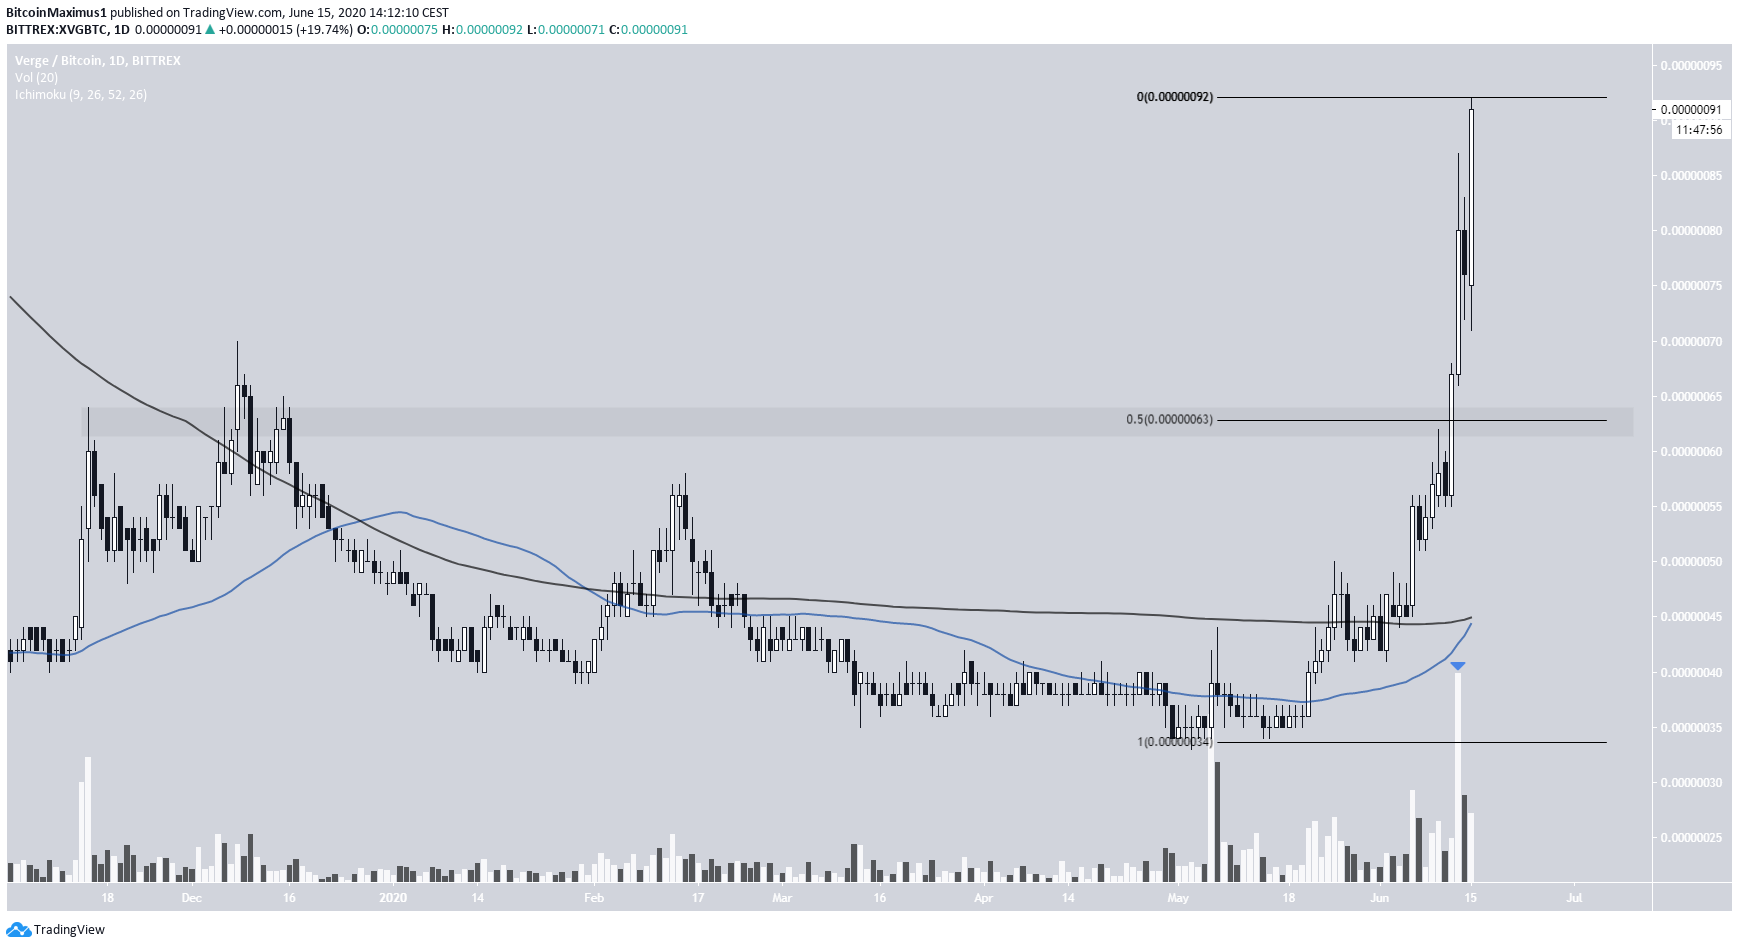
Verge (XVG)
Looking closer at the daily price for XVG, we can see that a golden cross has taken place on the daily time-frame. While the price is in the process of creating a bullish engulfing candlestick, volume has been gradually decreasing.
There is also bearish divergence on the lower time-frames. This suggests that the upward move might be coming to an end. If the price begins to retrace, the closest support area is found at 65 satoshis, the 0.5 Fib level of the entire upward move.
If the XVG move plays out in similar fashion to ZIL, the price will bounce and resume its upward trend.