


On Feb. 10, the XTZ price broke out from a long-term resistance area. It continued to increase for 10 days, reaching a high of 4,053 satoshis. The price has been on a gradual downward trend since.
Tezos (XTZ) Price Highlights
- The price has broken out above a long-term resistance area.
- It is trading inside a symmetrical triangle.
- The daily and weekly RSI are bullish.
- XTZ is in price discovery.
Crypto trader @tehcryptogoy tweeted an XTZ chart that outlines a bearish pattern and predicts a price decrease all the way to 2,200 satoshis. He proposes shorting a breakdown of the 2,850 satoshi support area.
Still think $ALTS kinda lagging with there dump in correlation with $BTC.
Alarms set for a break of 2845 for $XTZ
to short it pic.twitter.com/c7hViqa9M8— Prettyboi mork (@HolderMorkCT) March 9, 2020
Will the XTZ price reach the support area? Continue reading below if you are interested in finding out.
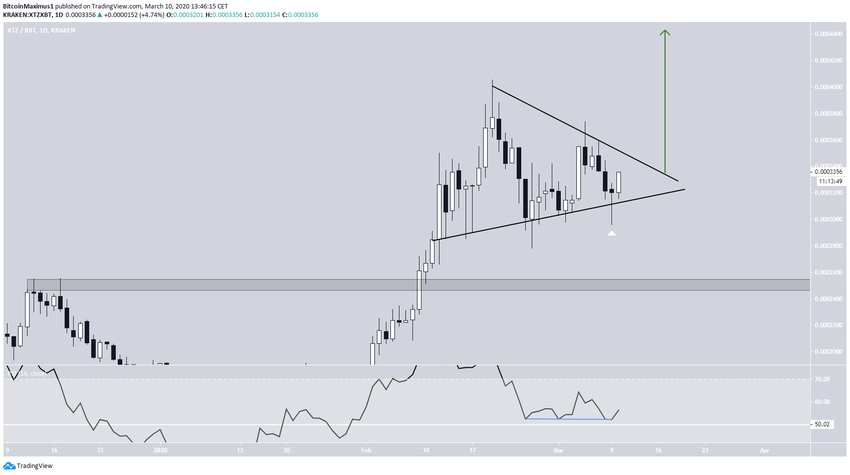
Symmetrical Triangle
Looking at the daily chart, it looks more like the price has been trading inside a symmetrical triangle than a head and shoulders (H&S) pattern, as outlined in the tweet. This is especially true because of the candlestick with a long lower wick created on March 9, which would have constituted a breakdown from the H&S pattern.
The daily RSI has generated hidden bullish divergence. A breakout that travels the entire height of the pattern would take the price to 4,400 satoshis. Since the triangle is a continuation pattern and is present after an upward move, a breakout is expected.
If a breakdown happens, the next support area is found at 2,500 satoshis.
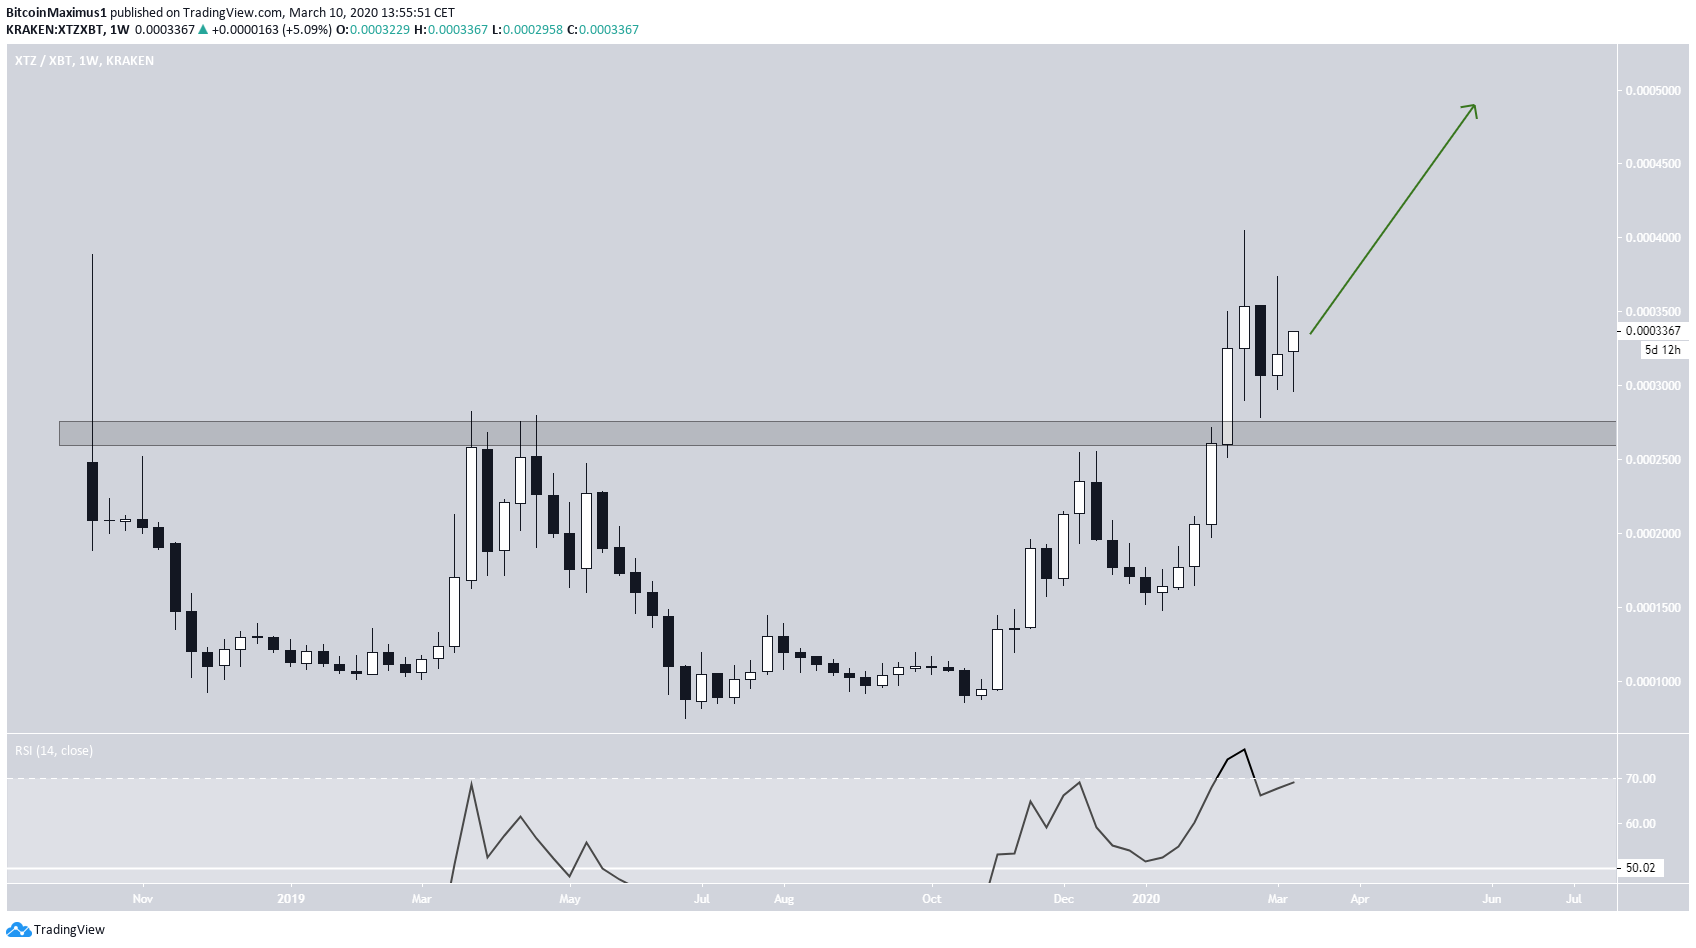
Long-Term Chart
The weekly chart is also bullish and suggests a breakout. The 4,500 satoshi level is revealed to be a long-term resistance area, out of which the price broke out on Feb. 10.
Therefore, as long as the price stays above this level, its long-term trend is considered bullish.
The weekly RSI is overbought but has yet to generate any type of bearish divergence. Therefore, a breakout from the triangle is likely and it is possible that the upward move will continue even further.
To conclude, the XTZ price is trading inside a symmetrical triangle from which we believe it will break out. The initial target is found at 4,400 satoshis. We are not rejecting the possibility that the price will continue to increase even higher.


