

The Bitcoin dominance rate (BTCD) has broken out above an important resistance area and validated it as support. As long as it is trading above it, its price movement is considered bullish.
The Bitcoin dominance rate has been increasing along with Bitcoin, causing alt/btc pairs to decrease towards their all-time lows. Cryptocurrency trader @CryptoAmsterdam tweeted an image of the Bitcoin dominance rate, which shows it resting above a significant support level.
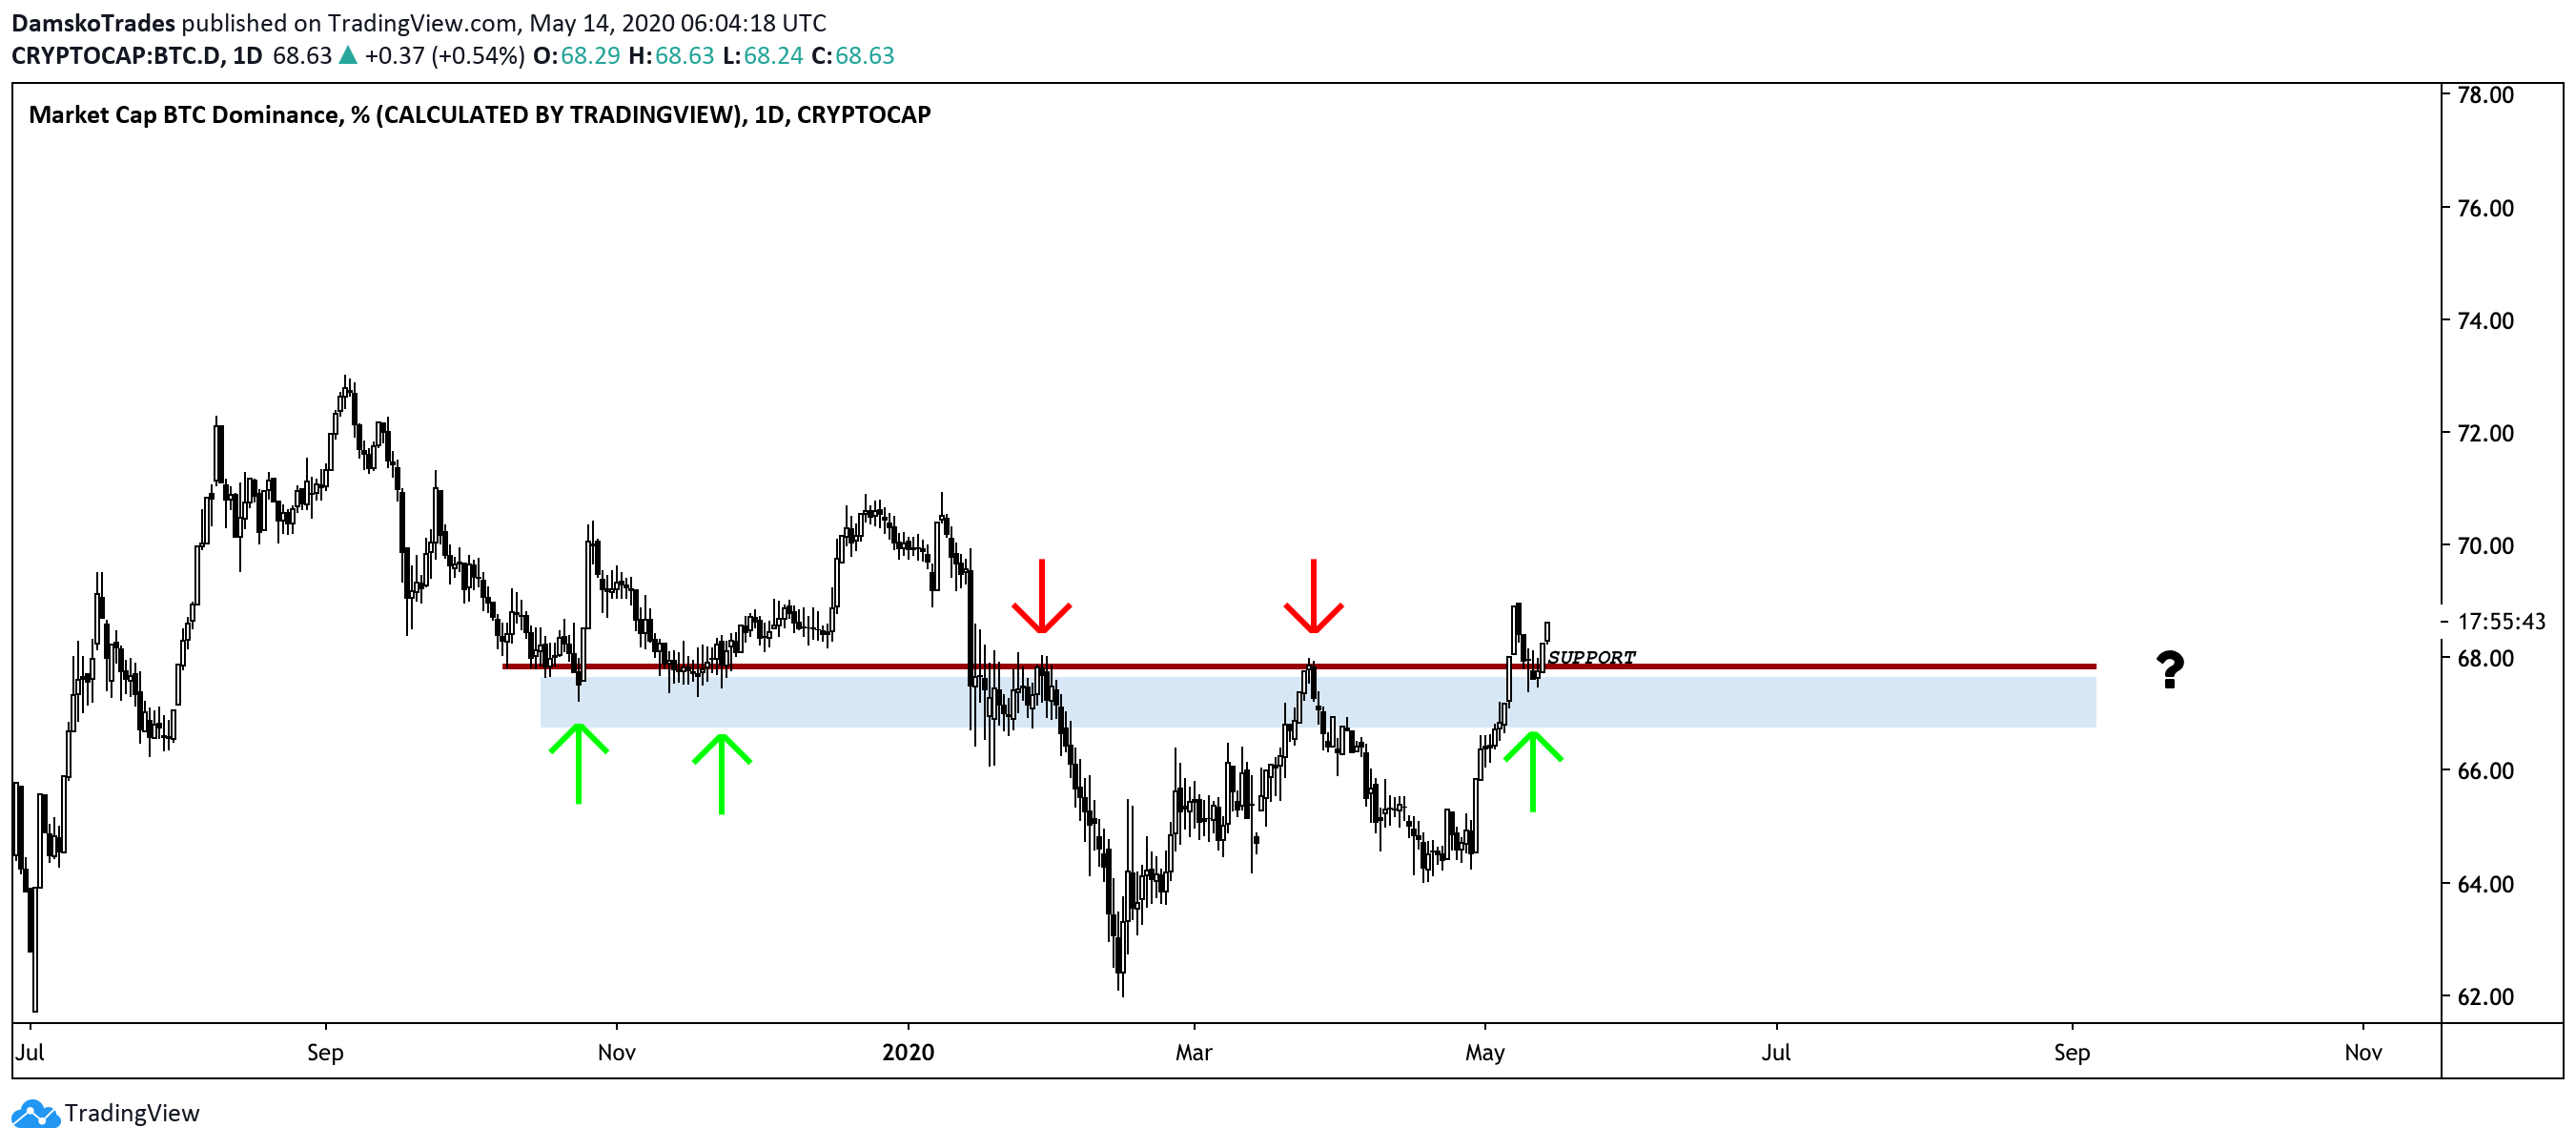
Dominance bounce and the little red turned into green! Altcoins moving down and the little green turned into red! — Don’t let them trap you with a little green. & Understand not only the chart, but also the market conditions / general market outlookIn this article, we will take a closer look at the BTC dominance chart in order to determine where it will head to next.
Support Area
At the time of writing, the BTCD was at 68.34%. This is slightly above the 67.5% area, which has been the main area that determines the trend. During the times in which the rate has been above this area, its movement has been bullish and vice versa. BTCD dropped below it on Jan. 7 and has struggled to break out since. On May 5, the BTCD finally broke out above it, along with the 200-day moving average (MA), which had been previously providing resistance. This is a bullish sign that suggests that the rate will move upward.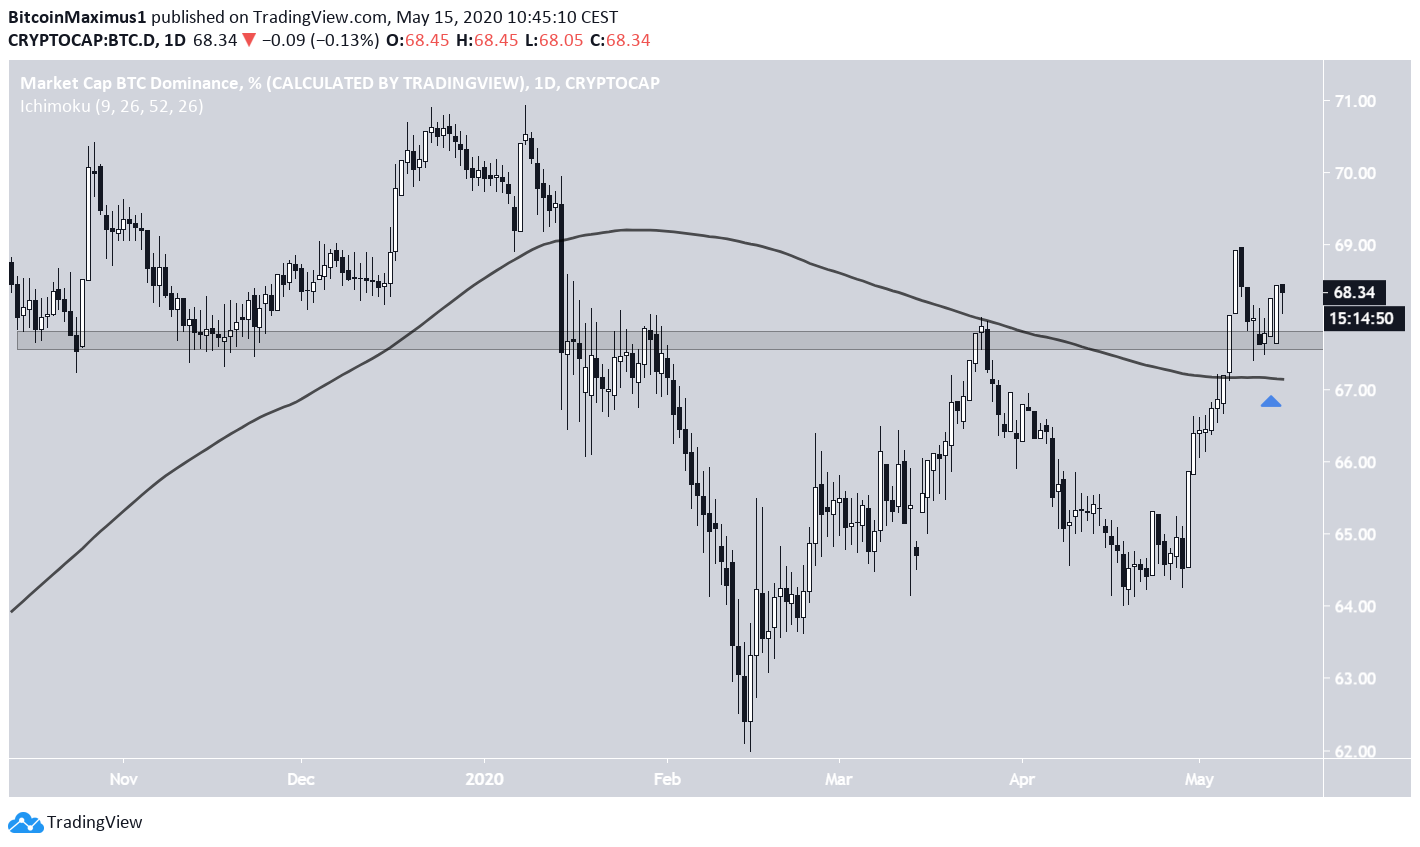
Future Movement
In the slightly longer-term, the BTCD has been following a descending resistance line since September 2019. At the time of writing, the price was in the process of validating it for the fifth time. It has previously moved above this line on May 7 but proceeded to fall right back below it. If the BTCD rate moves above this line, it is likely to head towards the next resistance area at 70.5%. This looks like the most likely scenario. If, however, it decreases below it, it could fall all the way to 66%.
Top crypto projects in the US | April 2024
Trusted
Disclaimer
In line with the Trust Project guidelines, this price analysis article is for informational purposes only and should not be considered financial or investment advice. BeInCrypto is committed to accurate, unbiased reporting, but market conditions are subject to change without notice. Always conduct your own research and consult with a professional before making any financial decisions. Please note that our Terms and Conditions, Privacy Policy, and Disclaimers have been updated.

Valdrin Tahiri
Valdrin discovered cryptocurrencies while he was getting his MSc in Financial Markets from the Barcelona School of Economics. Shortly after graduating, he began writing for several different cryptocurrency related websites as a freelancer before eventually taking on the role of BeInCrypto's Senior Analyst.
(I do not have a discord and will not contact you first there. Beware of scammers)
READ FULL BIO
Sponsored
Sponsored