The DASH (DASH) price has been decreasing alongside a descending resistance line since April 29.
While the DASH/BTC pair has shown some signs of a reversal, there are no such signs visible on the DASH/USD chart.
Is The Correction Complete?
Cryptocurrency trader @Glow1994, outlined a wave count for DASH, in which the price drops to $60 before increasing to $130.
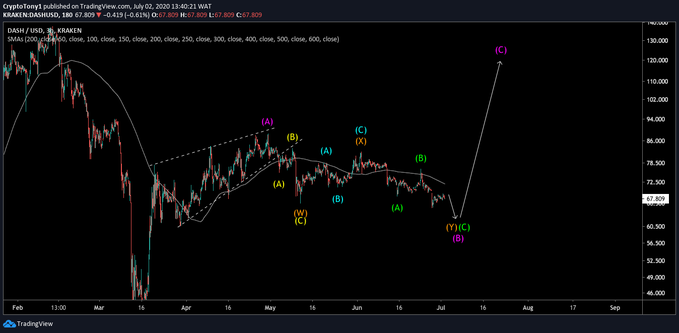
The wave count is certainly possible for several reasons.
First, the purported A-wave has transpired in an impulsive five-wave formation, making this a zig-zag correction. Therefore, the B-wave would be expected to end between the 0.5-0.618 Fib levels between $56-$63, fitting perfectly with the target in the tweet.
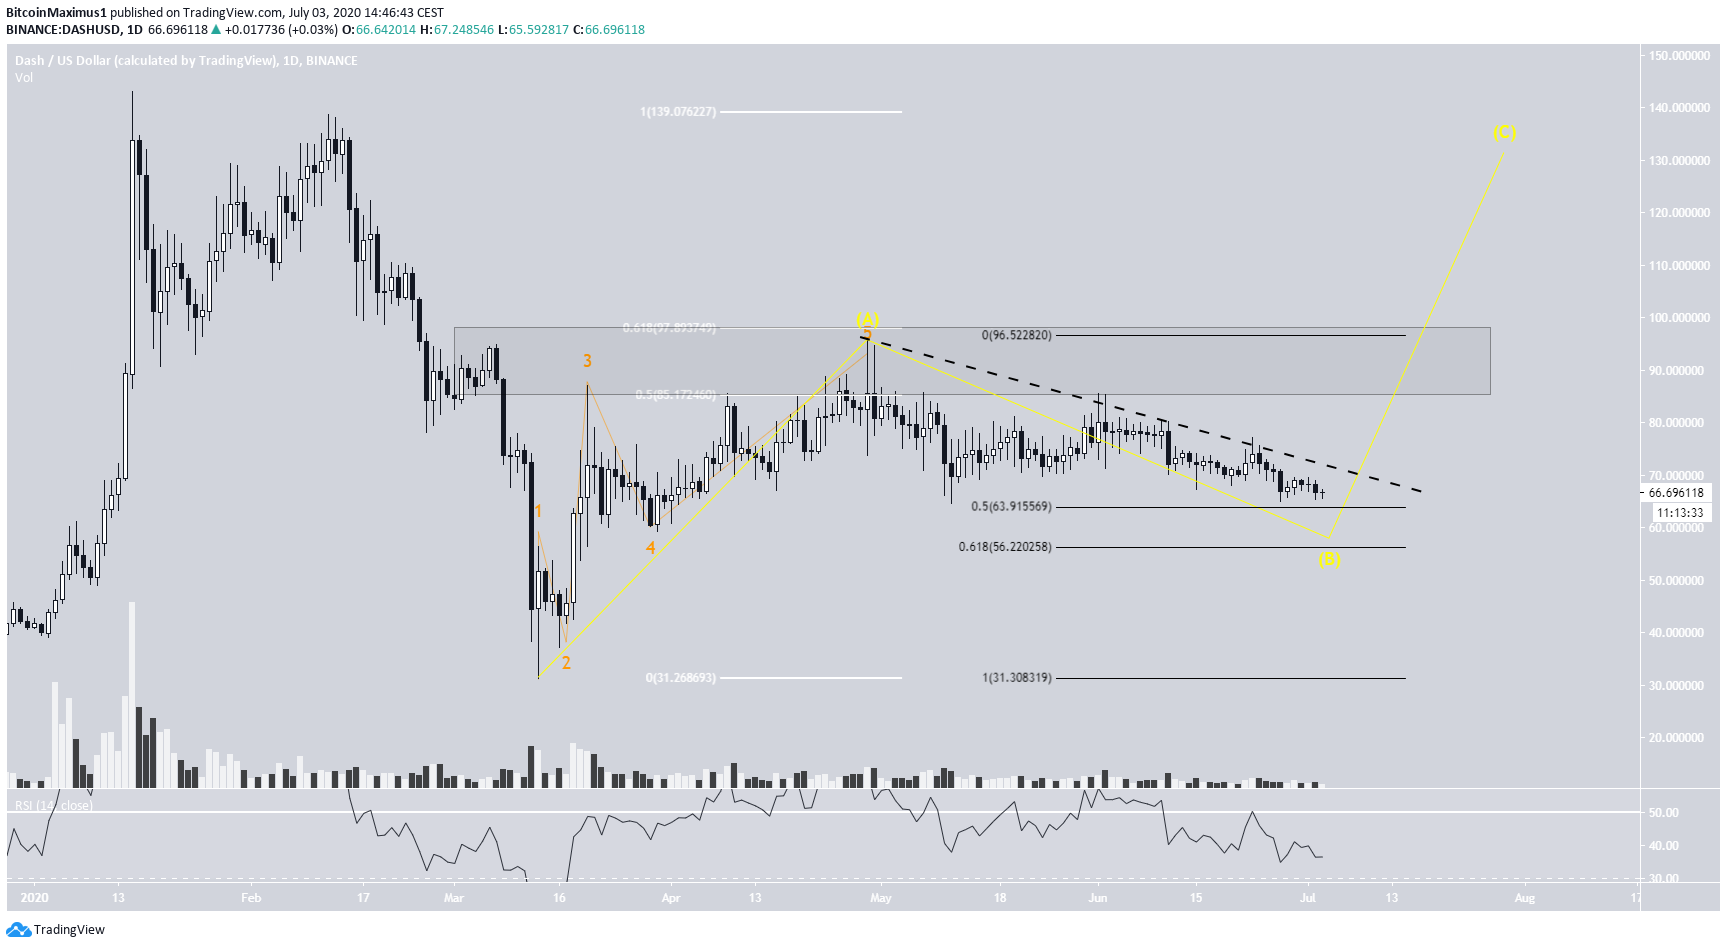
In order for the proposed upward move to begin, the price has to break out from the descending resistance line that has been in place since the high of $95.29 on April 29. However, the fact that there is no bullish divergence in the RSI and that the price has not made any attempts at a reversal casts some doubt in the proposed increase.
Relative to the decrease which began in February, the price has already returned to the 0.618 Fib level, so it is possible that the retracement is already complete. Until the price successfully breaks out above the aforementioned descending resistance line and the $95 level, we cannot state with certainty that it will go higher.
Furthermore, this entire movement still appears to be a retracement in response to the prior decrease, so the price would be expected to continue its downward movement afterward.
DASH/BTC
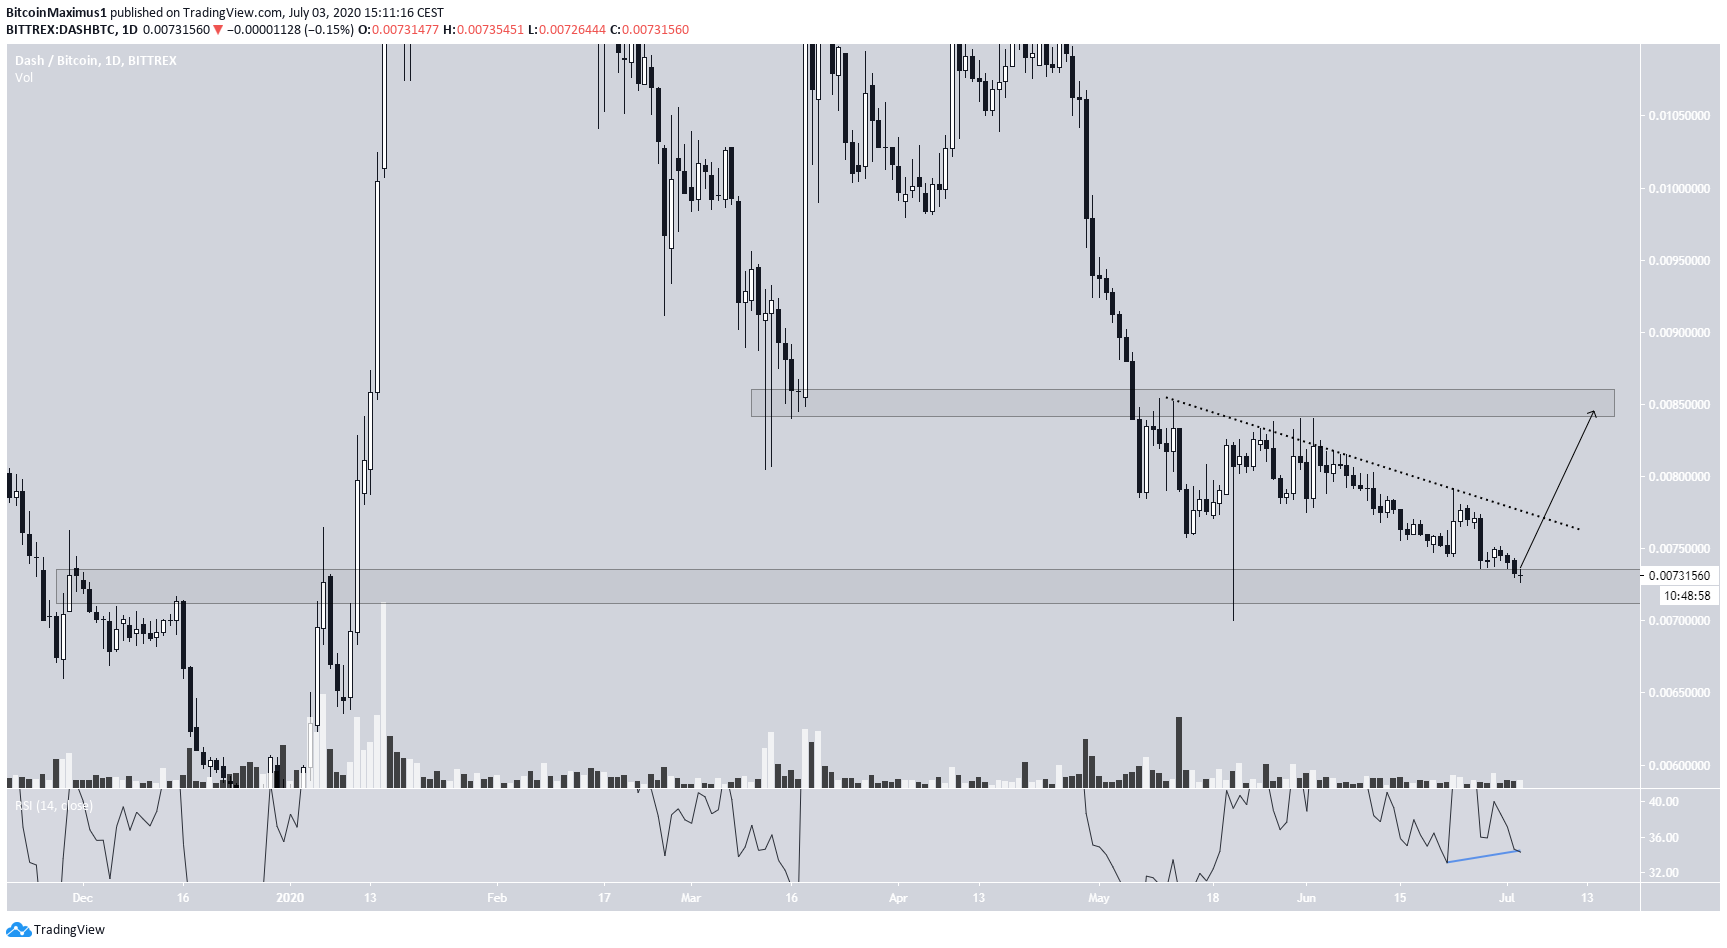
The movement for DASH/BTC is more interesting. The price is trading inside the ₿0.00725 support area, which it has previously revisited on May 21 in the form of a long lower-wick and validated it as support. The same area had acted as resistance in December 2019, and a breakout above it triggered a parabolic upward movement.
The daily RSI has generated some bearish divergence, which is strengthened by the fact that it is transpiring inside a support area, so a reversal could still transpire. If the price is successful in breaking out above the current descending resistance line, it could increase all the way to ₿0.0085
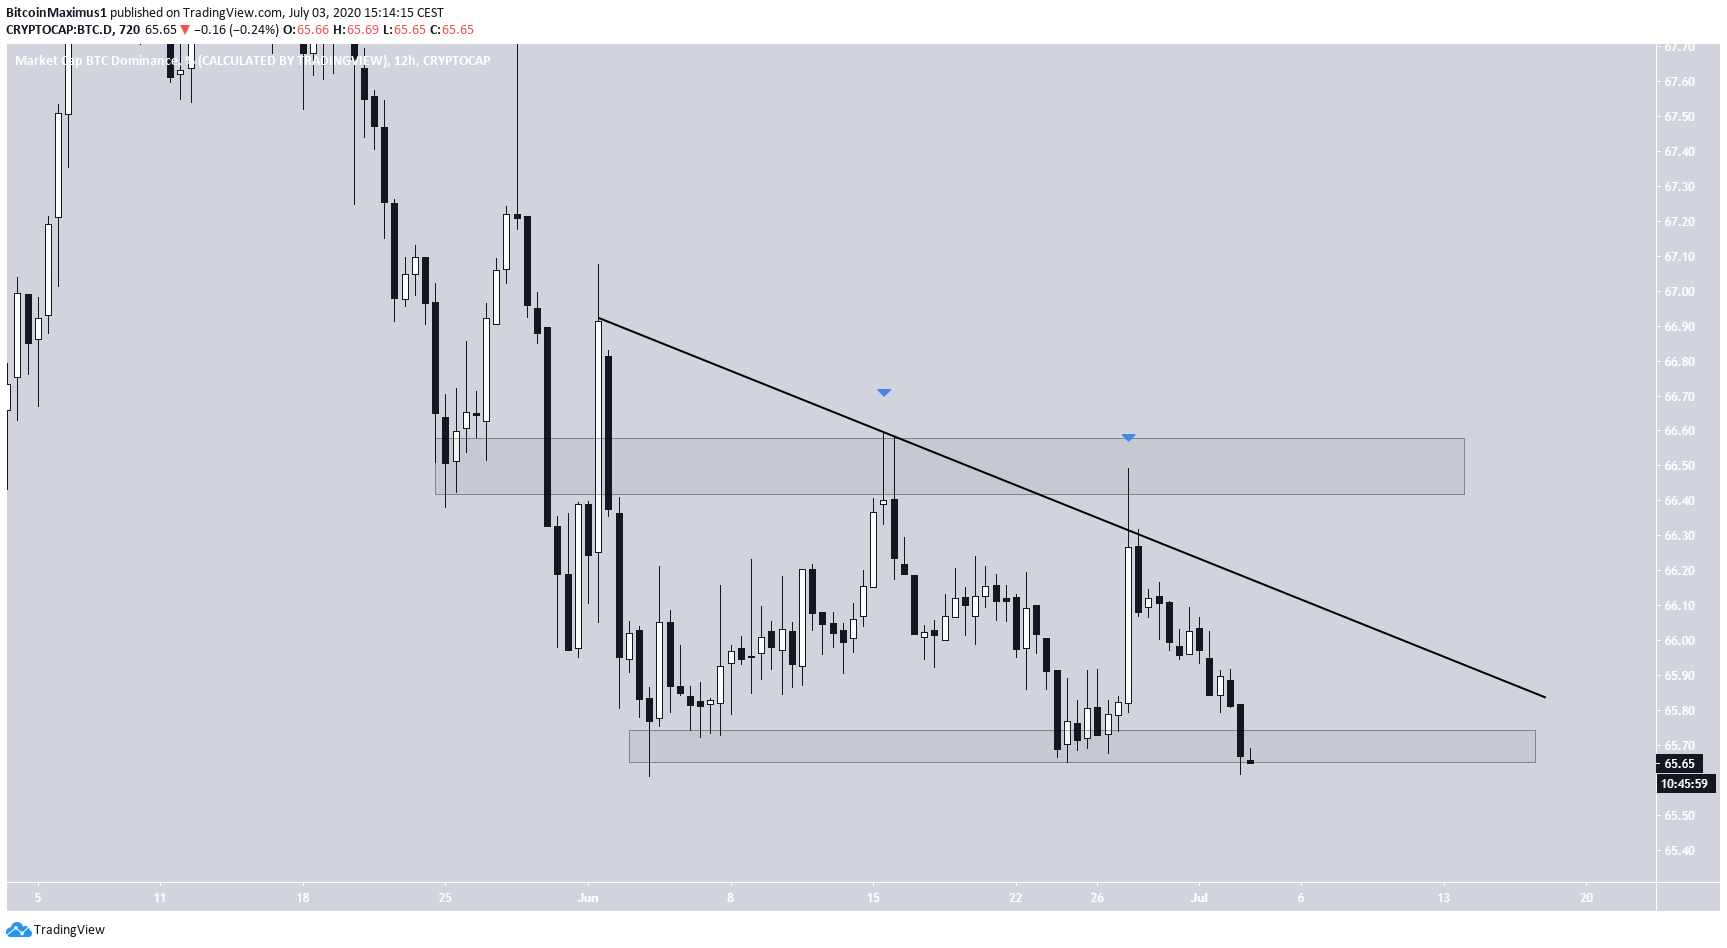
The Bitcoin Dominance Rate
One telling indicator for the possibility of an ALT/BTC pair increase is the Bitcoin dominance rate, which is shown in the chart below.
The rate seems to be stuck inside a descending triangle, having made three lower-highs up to this point. A decrease below the current 65.5% support area could trigger a rapid decrease.