


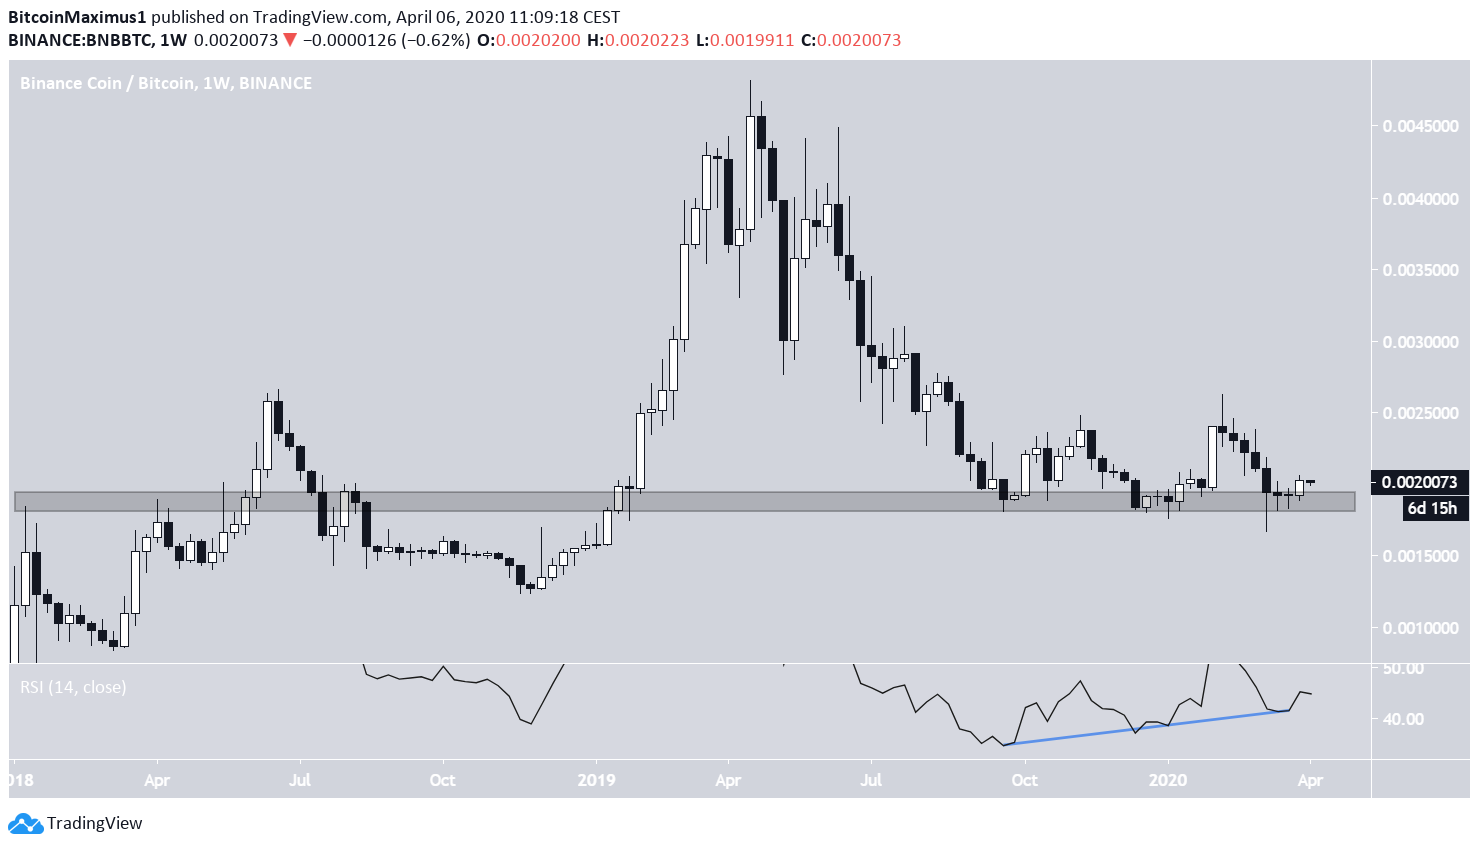
On Sept 16, 2019, the BNB price reached a low of ₿0.0018 and has been trading very close to that level since. The price action resembles a reversal pattern indicating that the price could soon move upwards.
A lower time-frame chart with support and resistance levels outlined was posted by cryptocurrency trader @inmortalcrypto, who stated that he would look to initiate longs if the price were to reclaim the ₿0.00207 resistance area and turn it to support. If so, he has outlined ₿0.00235 as the next resistance level.
I would like to long BNB if price reclaims 0.00207 as support.$BNB pic.twitter.com/3X3EbtQU9H
— Inmortal (@inmortalcrypto) April 4, 2020
BNB Triple-Bottom
The BNB price is trading very close to the major support area which is found at ₿0.0019. This area acted as resistance in 2018, before the price broke out at the beginning of 2019 and flipped it as support.
The price has thrice reached this level, creating a long lower-wick the third time, a sign of buying pressure. In addition, the price has created a triple-bottom, which is considered a bullish reversal pattern. The fact that it is combined with a significant bullish divergence in the weekly RSI makes an upward move likely.
This suggests that the price will indeed reclaim the resistance level outlined in the tweet and move towards the target.
Current Resistance
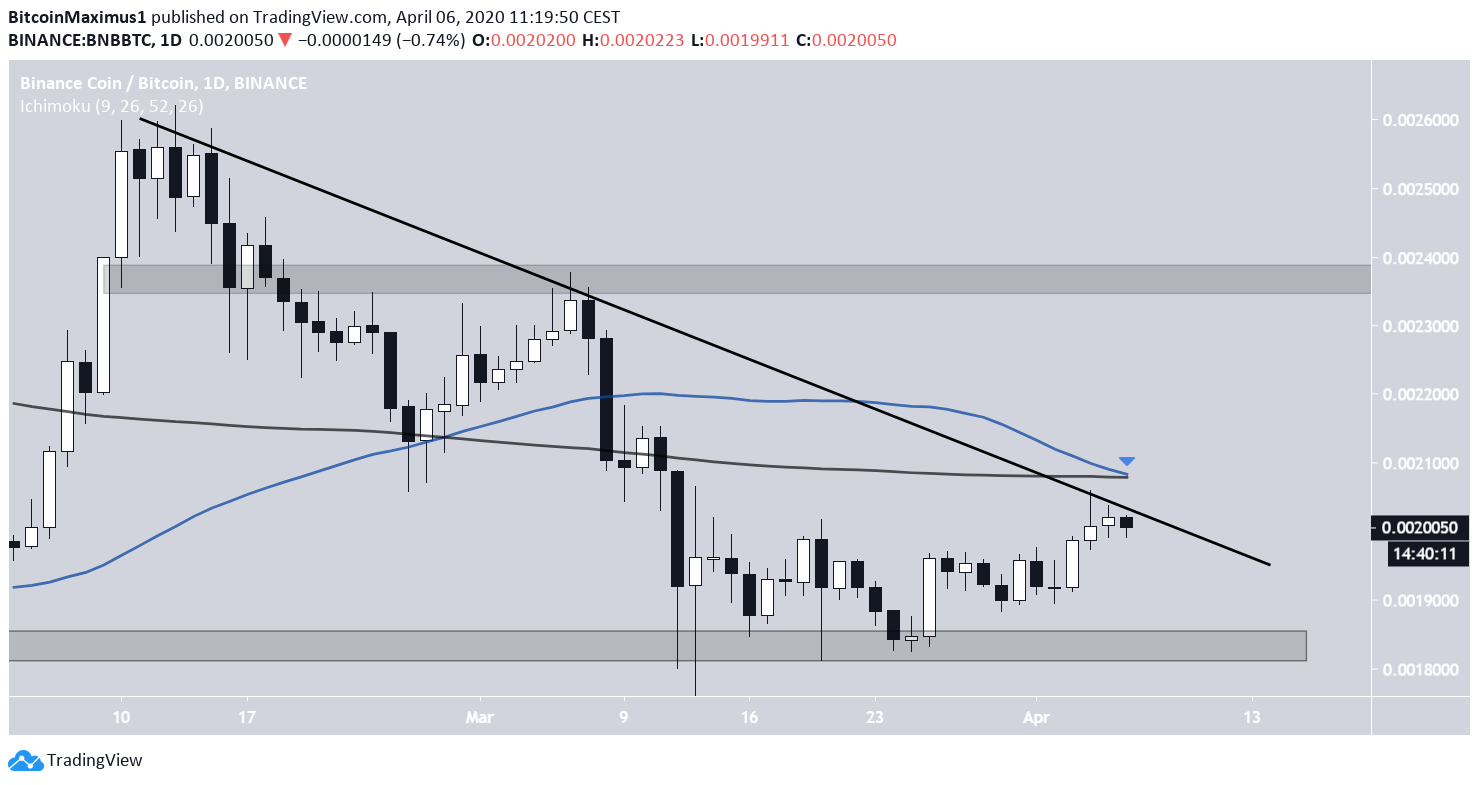
In the daily time-frame, we can see that the price is following a descending resistance line. On a very bearish note, the 50 and 200-day moving averages (MA) are very close to making a bearish cross and are offering resistance along with the descending resistance line. The resistance is found at ₿0.00207, at the level stated in the tweet.
Therefore, we agree with the hypothesis laid out in the tweet. If the BNB price is able to successfully flip the ₿0.00207 resistance level, it is likely to move towards ₿0.00235.
This movement would expectedly cause the bearish cross to be rejected and the price to move above the MAs, possibly using them as support in the future.
Finally, in the short-term, the price has already broken out from a symmetrical triangle. After possibly validating the resistance line once more, the price would be expected to continue moving upwards and break out from the longer-term descending resistance line.
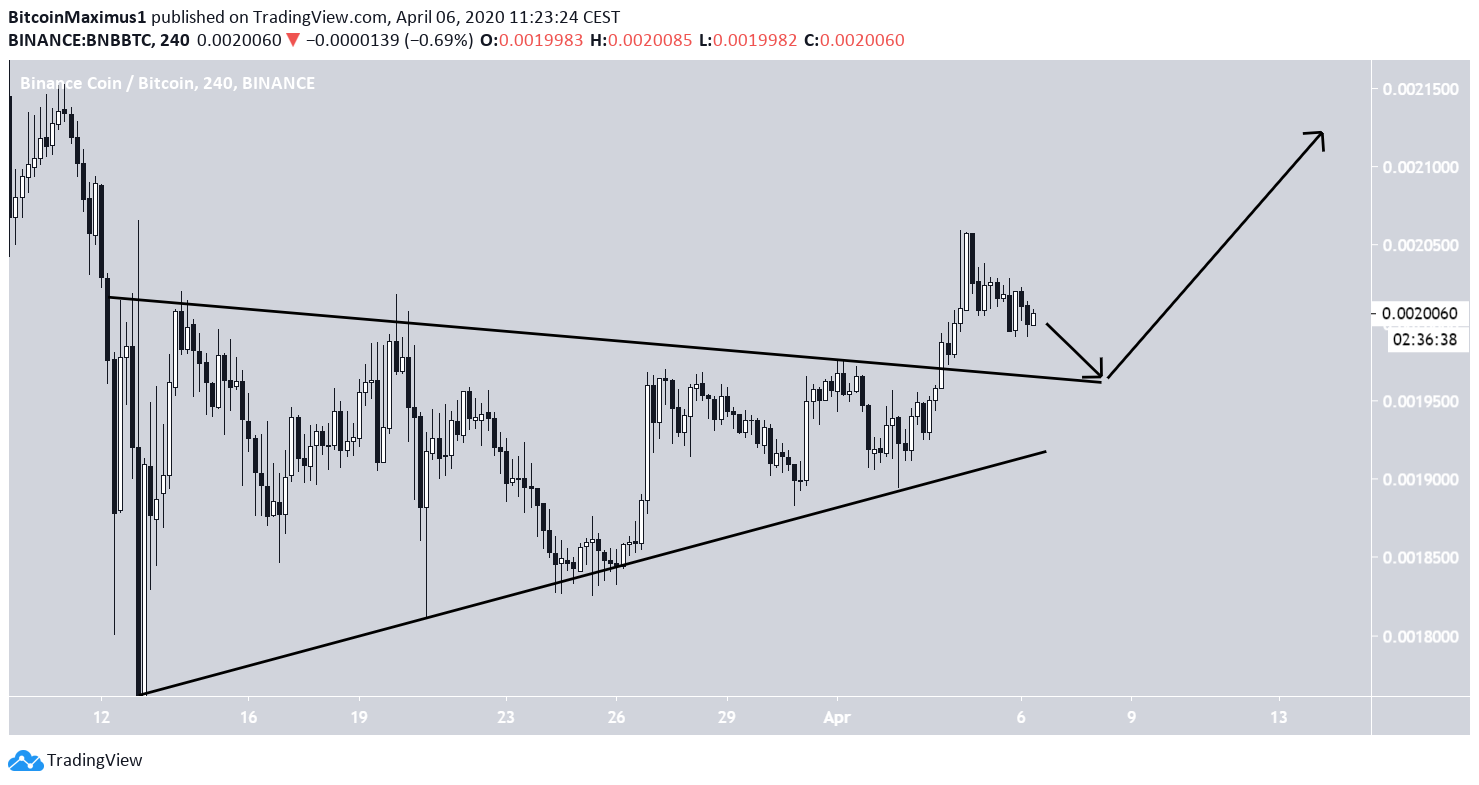
To conclude, the BNB price has generated a long-term triple-bottom, which is considered a bullish reversal pattern. The pattern would be confirmed by a breakout above the current descending resistance line, a movement that would be expected to take the price all the way to ₿0.00235.


