


On February 24-26, the Bitcoin price plummeted, decreasing by 13 percent. While this could have been caused by a coronavirus panic since the entire global economy has slowed down considerably, there is another possibility: the price is simply following a fractal from its earlier movement.
Bitcoin (BTC) Price Highlights
- The Bitcoin price might be following a fractal from July 2019.
- It is, possibly, in the third wave of a five wave Elliott formation.
- There is resistance at $9500.
- There is support a $7800 and $8400.
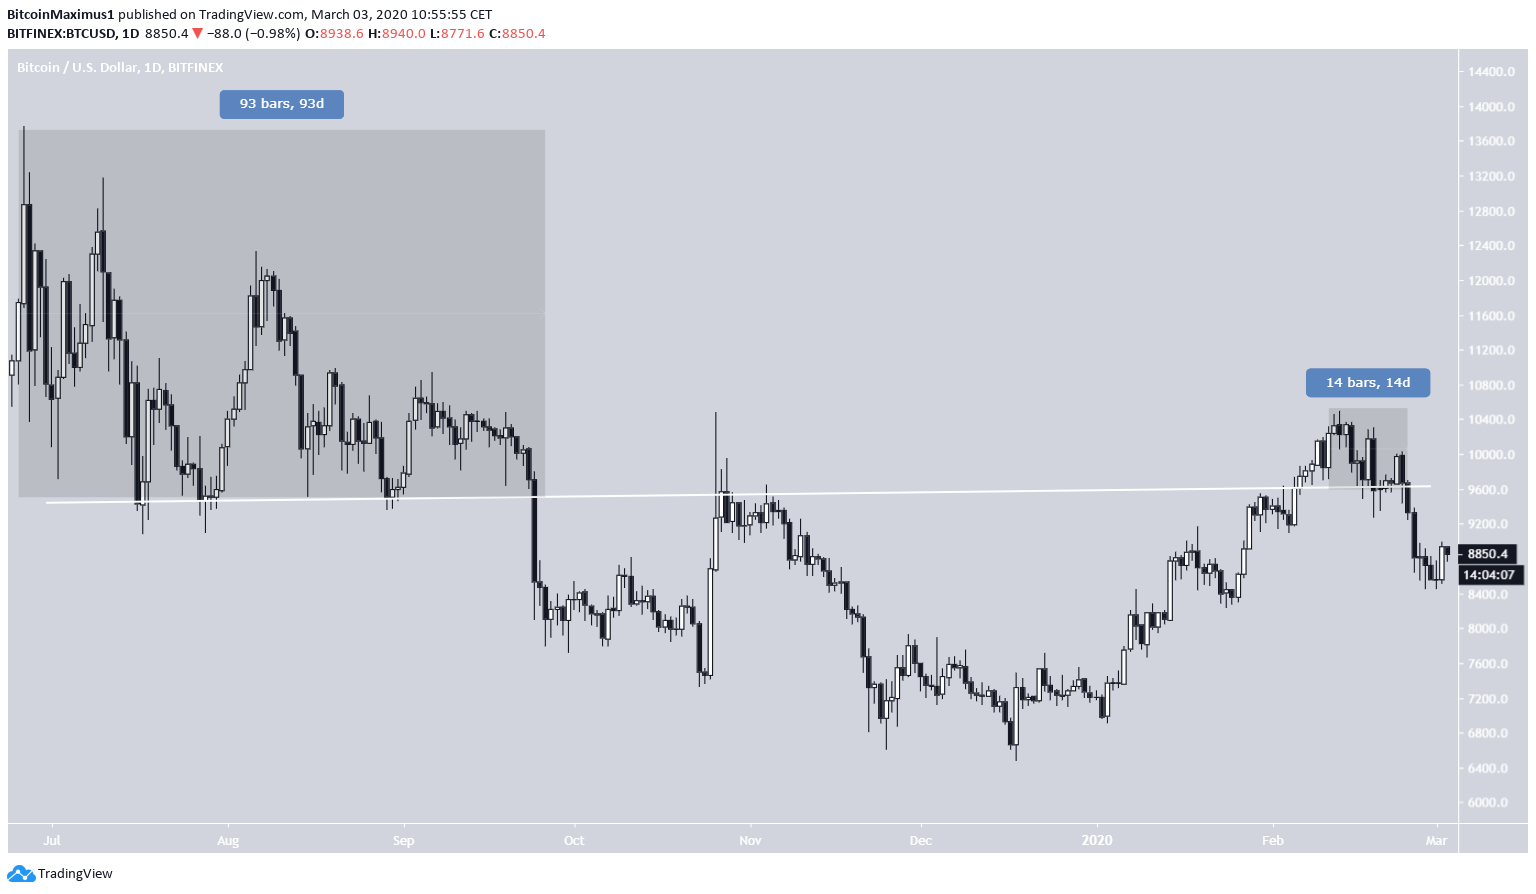
Beginning on February 25, trader @PostyXBT outlined a fractal for the Bitcoin price since reaching a high of $10,491 on February 13, which is very similar to the price movement in July 2019. The fractal successfully predicted the February 24-26 crash.
What happens next? 👀 pic.twitter.com/fdhw4kyPFH
— Posty (@PostyXBT) March 3, 2020
In the tweet, he asks the question “What happens next?” Continue reading below if you want to find out.
Bitcoin Fractal
The highlighted periods are the ones that supposedly have similarities. While the time-frames are completely different, the main similarity comes from the fact that the price has created several lower highs along with a horizontal support line both times — which resembles a descending triangle, a bearish pattern.
If the fractal holds, we will have a fake breakdown towards $8000, followed by a very rapid upward move towards $9500 — validating the breakdown level as resistance.
The time periods of the movements have about a 7:1 ratio, so the daily time-frame in the first one should correspond with the three-hour time-frame in the current one.
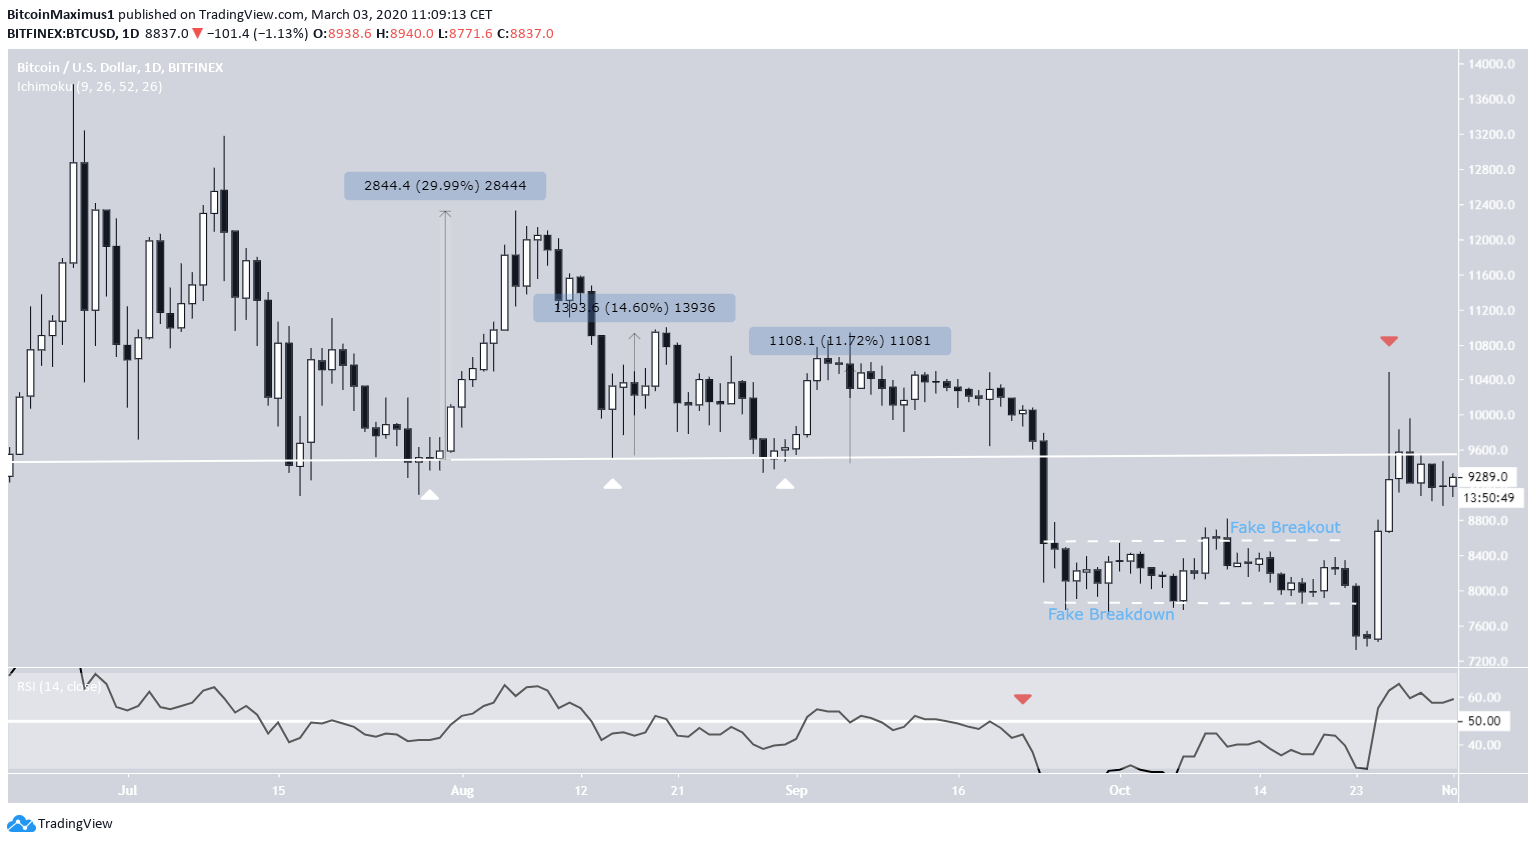
Original Movement
In the 2019 movement, each bounce from the support line was weaker than the previous one, leading to a smaller percentage increase.
During this time, the RSI freely moved above and below 50, indicative of range trading. After the breakdown, it moved sharply down.
Afterward, the price created a small trading range, that had one fake breakout and one fake breakdown preceding a very rapid upward move that validated the previous breakdown level. The Bitcoin price continued its decrease afterwards.
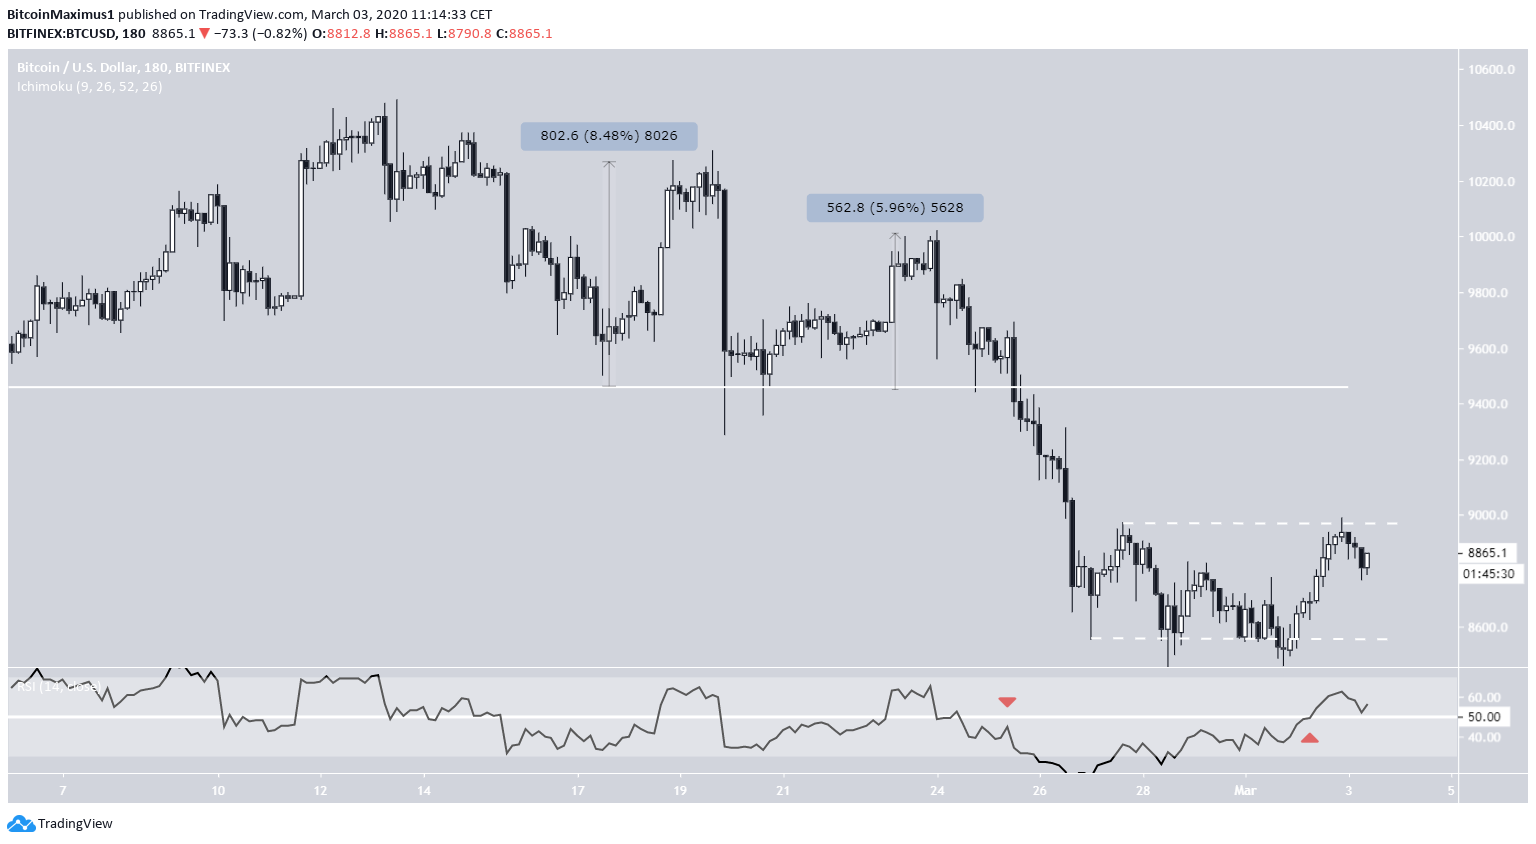
Current Movement
The current movement is very similar in some aspects — more specifically, the bounce strength and the RSI.
The bounces at the support line have been successively weaker and the RSI has been freely moving above and below the 50 line, indicative of range trading. After the breakdown, the RSI similarly decreased sharply.
Afterward, the price has likewise created a short-term trading range. However, the RSI has clearly moved above 50.
Therefore, we have the first difference between the two movement: While the price movement and technical indicators until the breakdown have been very similar, this changed after the breakdown.
Conclusion
While the short-term range movement might not be identical, a similar relief rally is expected, due to the long-term comparability.
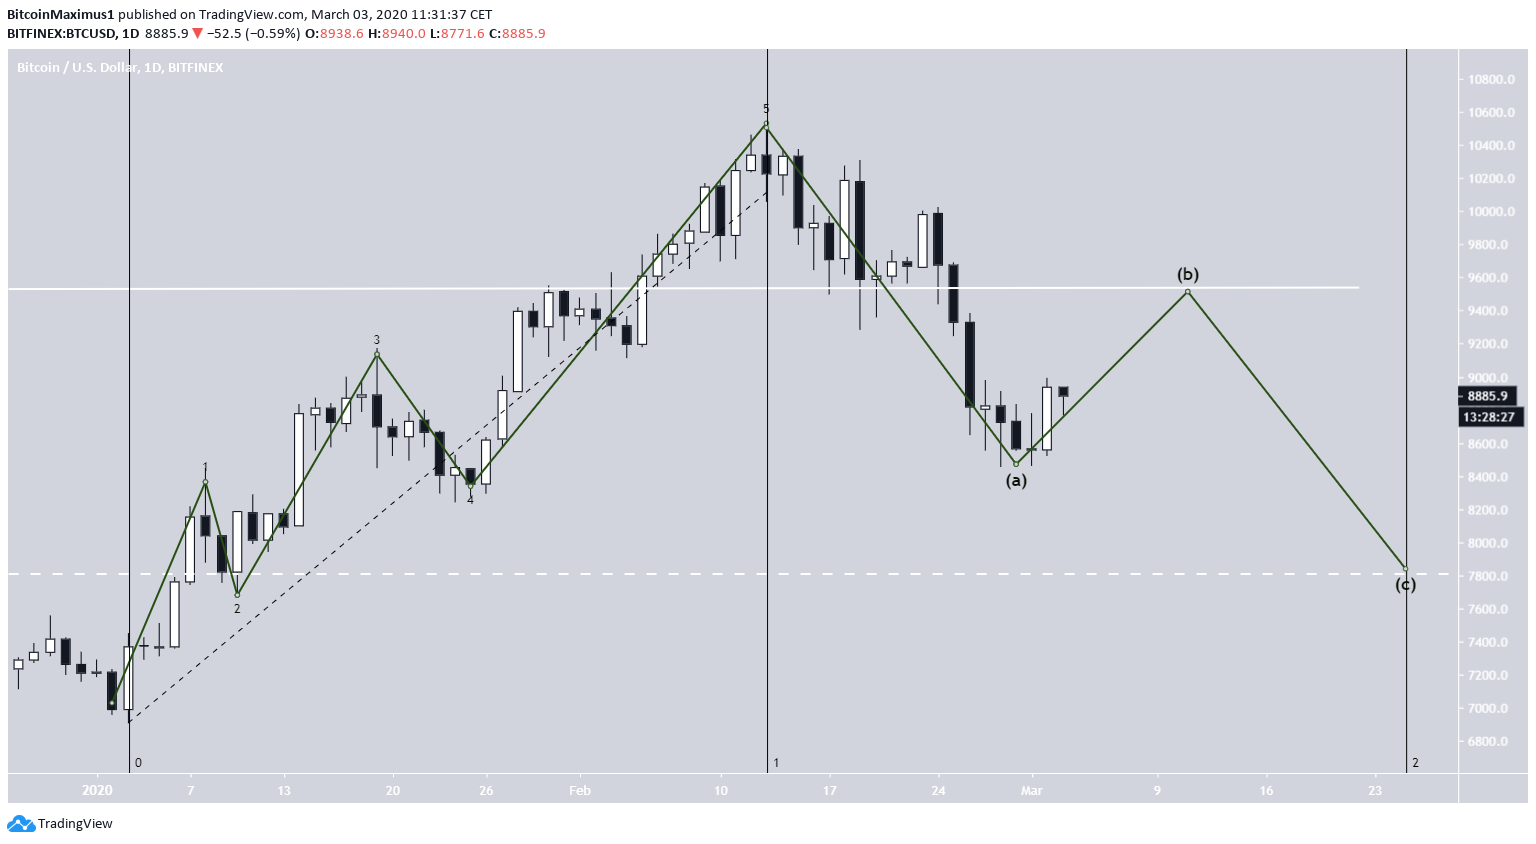
It seems that the Bitcoin price has completed a five wave Elliott formation and the ensuing decrease was the A wave of an A-B-C correction.
So, after the B wave ends near the breakdown level, a C wave towards $7800 is expected. If this takes the same amount of time as the upward move, it could be completed by the end of March.
To conclude, after the February 24-26 price decrease, the BTC price has been range trading. We believe that it will eventually break out and begin a relief rally and subsequently continue its downward movement.


