


Shiba Inu (SHIB) and Dogecoin (DOGE) have both created long upper wicks after rejections from key horizontal resistance levels. New yearly lows could be on the horizon.
While both coins attempted to initiate upward movements last week, the Sept. 27 rejection and ongoing decrease has negated all previous gains and put the bullish structure at risk.
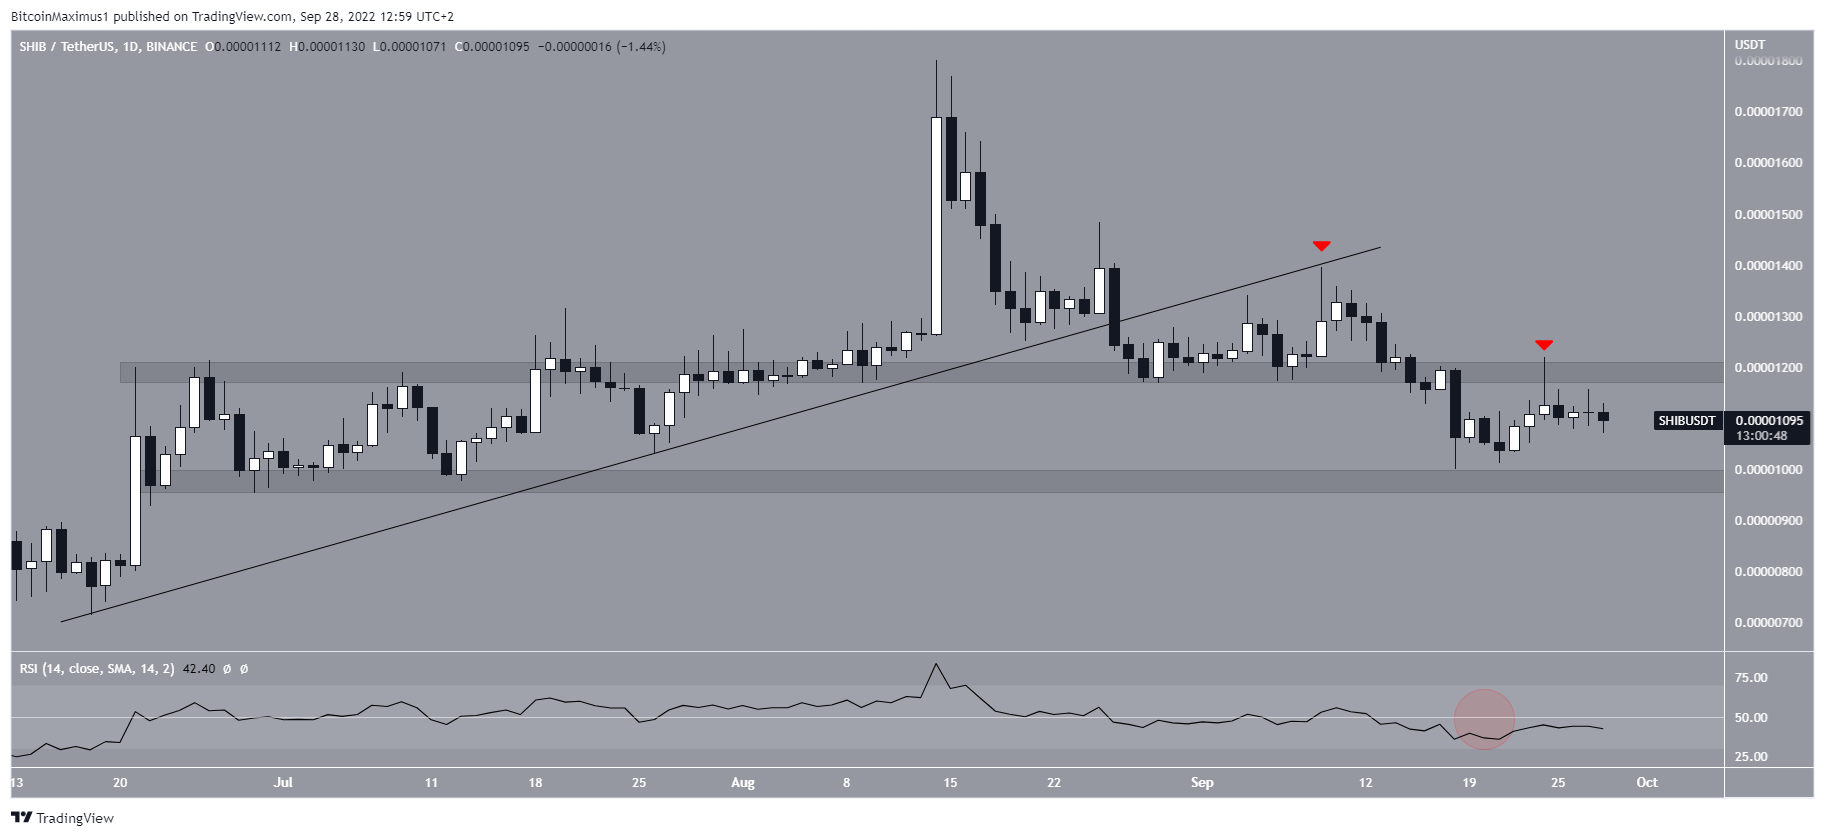
SHIB faces further breakdown
SHIB had been increasing alongside an ascending support line since reaching a low of $0.0000071 on June 18. The upward movement led to a high of $0.000018 on Aug. 14.
The price has been falling since and broke down from the support line on Aug. 26. Afterward, it validated it as resistance (red icon) on Sept. 9.
This was a decisive sign that the trend is bearish, Afterward, SHIB strengthened this possibility be breaking down from the $0.000012 horizontal area and validating it as resistance, creating a long upper wick in the process.
The next closest support area is at $0.0000098. This is the final horizontal support level prior to a new yearly low. The daily RSI is also below 50, supporting the possibility that SHIB will resume its downward movement towards the aforementioned support area and potentially break down.
So, unless SHIB manages to somehow reclaim the $0.000012 horizontal area, the most likely scenario suggests that a breakdown will occur.
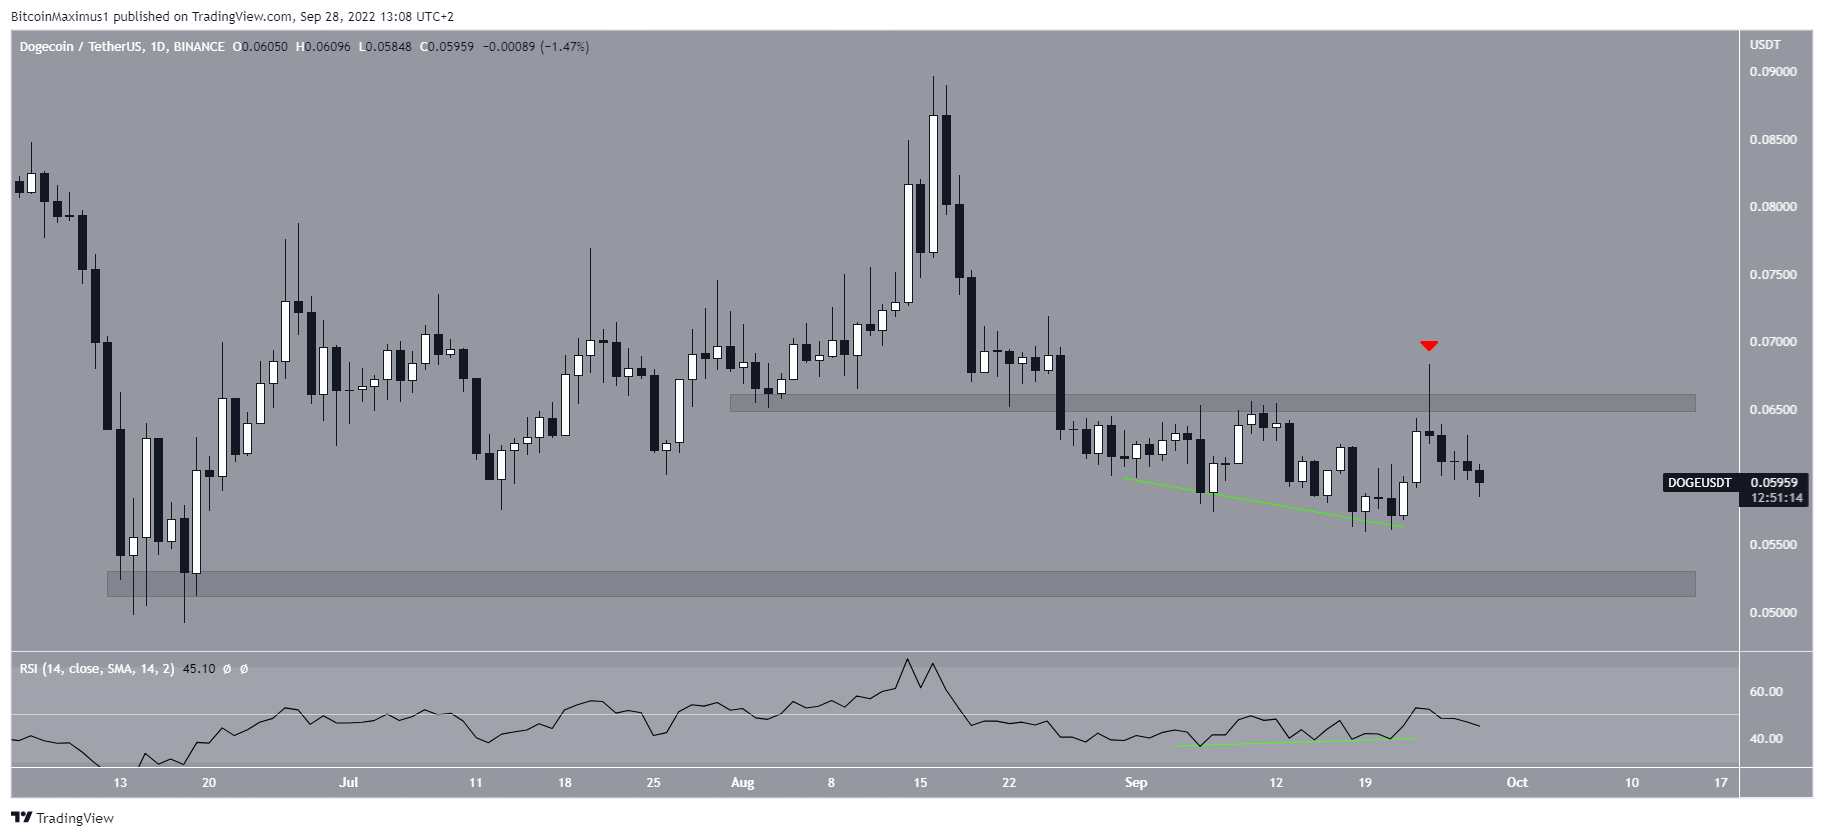
DOGE fails to sustain increase
Similarly, to SHIB, DOGE attempted to initiate an upward movement on Sept. 21. The movement occurred after a period in which the daily RSI generated bullish divergence (green line).
However, a sharp rejection followed on Sept. 24, creating a long upper wick (red icon) and validating the $0.0655 area as resistance. Unless DOGE manages to reclaim this area, the trend remains bearish.
If the downward movement continues, the closest support area would be at $0.052. At the current time, this seems to be the most likely scenario. The decrease is also supported by the daily RSI, which has fallen below 50.
For Be[In]Crypto’s latest Bitcoin (BTC) analysis, click here


