
The total crypto market cap (TOTAL) is trading at $2.40 trillion on March 26, 2026, inside a consolidation range between the $2.37 trillion support and $2.45 trillion resistance.
The market is digesting a risk-on shift driven by geopolitical de-escalation following President Trump’s announced halt on Iran strikes. Bitcoin (BTC) is holding firm above key levels, and Memecore (M) led the altcoin charge with a dramatic single-day breakout.
In the news today:-
- FiscalNote Holdings lost its NYSE listing on March 25 after failing to maintain the $1.00 minimum share price threshold, with no remaining cure period following a prior reverse stock split. The delisting reflects a broader collapse in the company’s policy intelligence middleman model, rendered obsolete by large language models that now deliver similar insights without a subscription.
- Circle has unfrozen the USDC balance in one of the 16 wallets it previously targeted, with on-chain investigator ZachXBT confirming that the wallet tied to Goated.com has regained access to its 130,966 USDC. Additional affected wallets may be restored soon, though the underlying U.S. civil case prompting the original freeze remains undisclosed.
The Crypto Market Consolidates
The daily total crypto market cap chart shows price trading in a tight range since March 24, with the current session producing a small-bodied candle that signals indecision rather than reversal.
The $2.37 trillion level has held as support across multiple tests visible on the chart, most notably during the March 21–22 lows. Resistance sits at $2.45 trillion, which capped the March 24 session before sellers stepped back in.
Want more token insights like this? Sign up for Editor Harsh Notariya’s Daily Crypto Newsletter here.
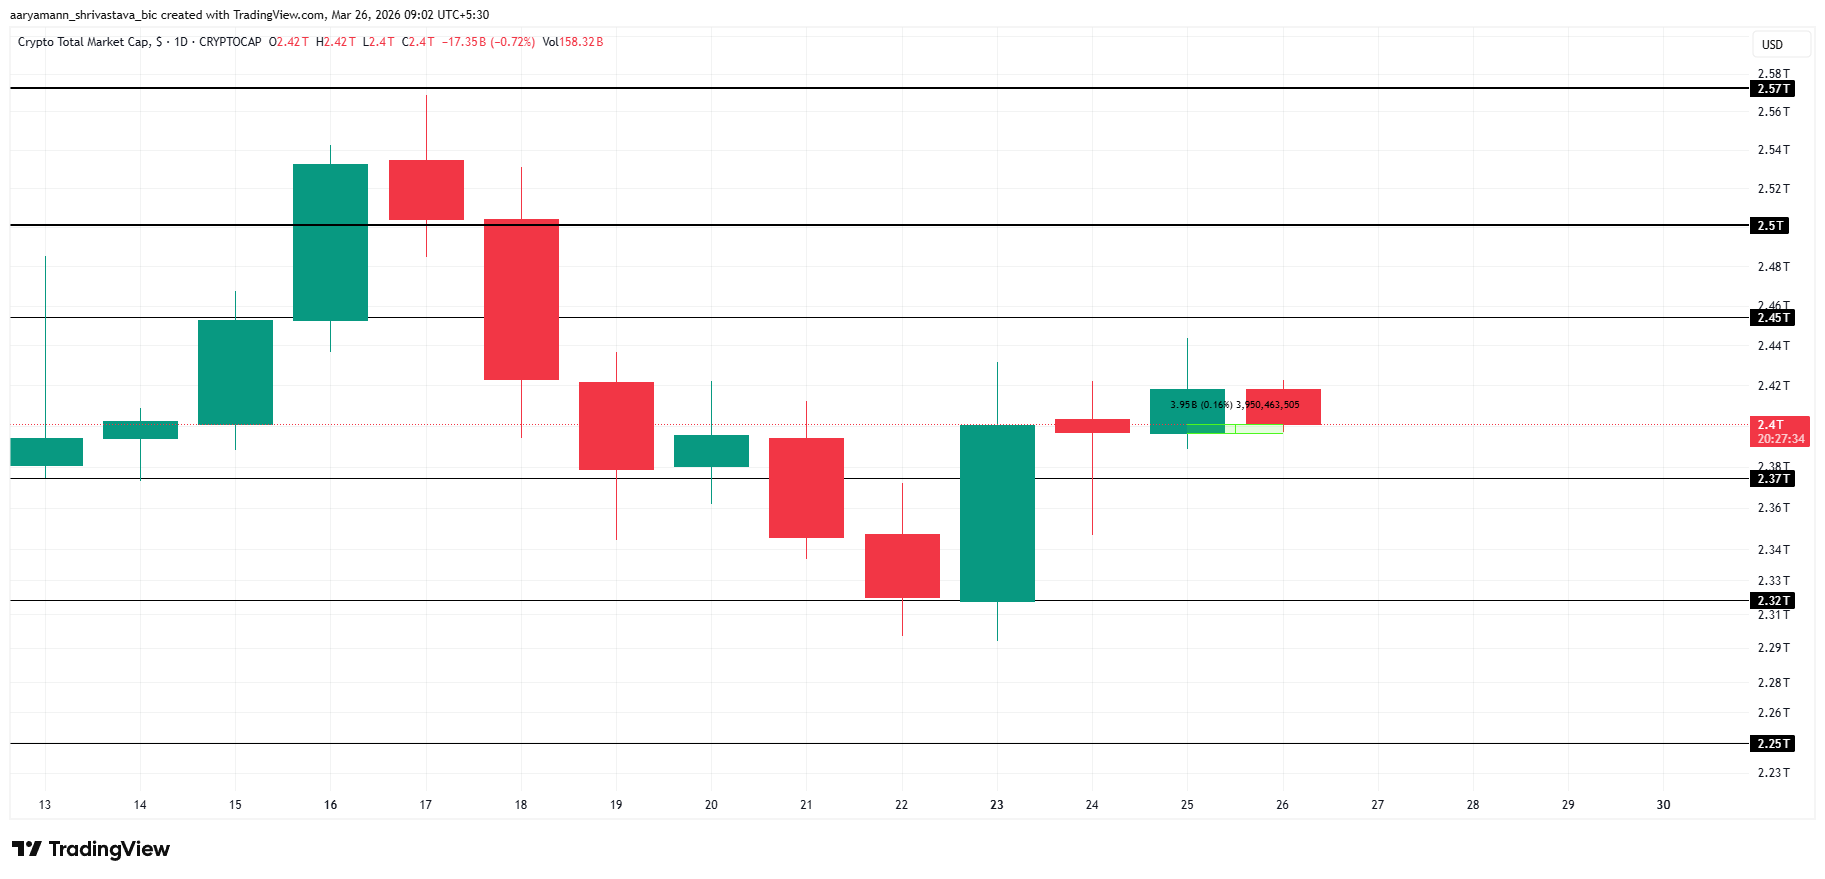
Price needs a daily close above $2.45 trillion to confirm the next leg higher toward $2.50 trillion and then $2.57 trillion. Failure to hold $2.37 trillion would open the path to $2.32 trillion, the next visible support below.
Bitcoin Is Holding Under Resistance
Bitcoin (BTC) is trading at $70,770, sitting comfortably between the $68,830 support and the $72,294 resistance visible on the daily chart. The range has been intact since March 19, with buyers repeatedly defending the lower boundary.
The Money Flow Index (MFI) reads 68.34, approaching but not yet at the 80-level overbought threshold. MFI has trended steadily upward since March 8, reflecting consistent capital inflows supporting the recovery even during the sideways price action.
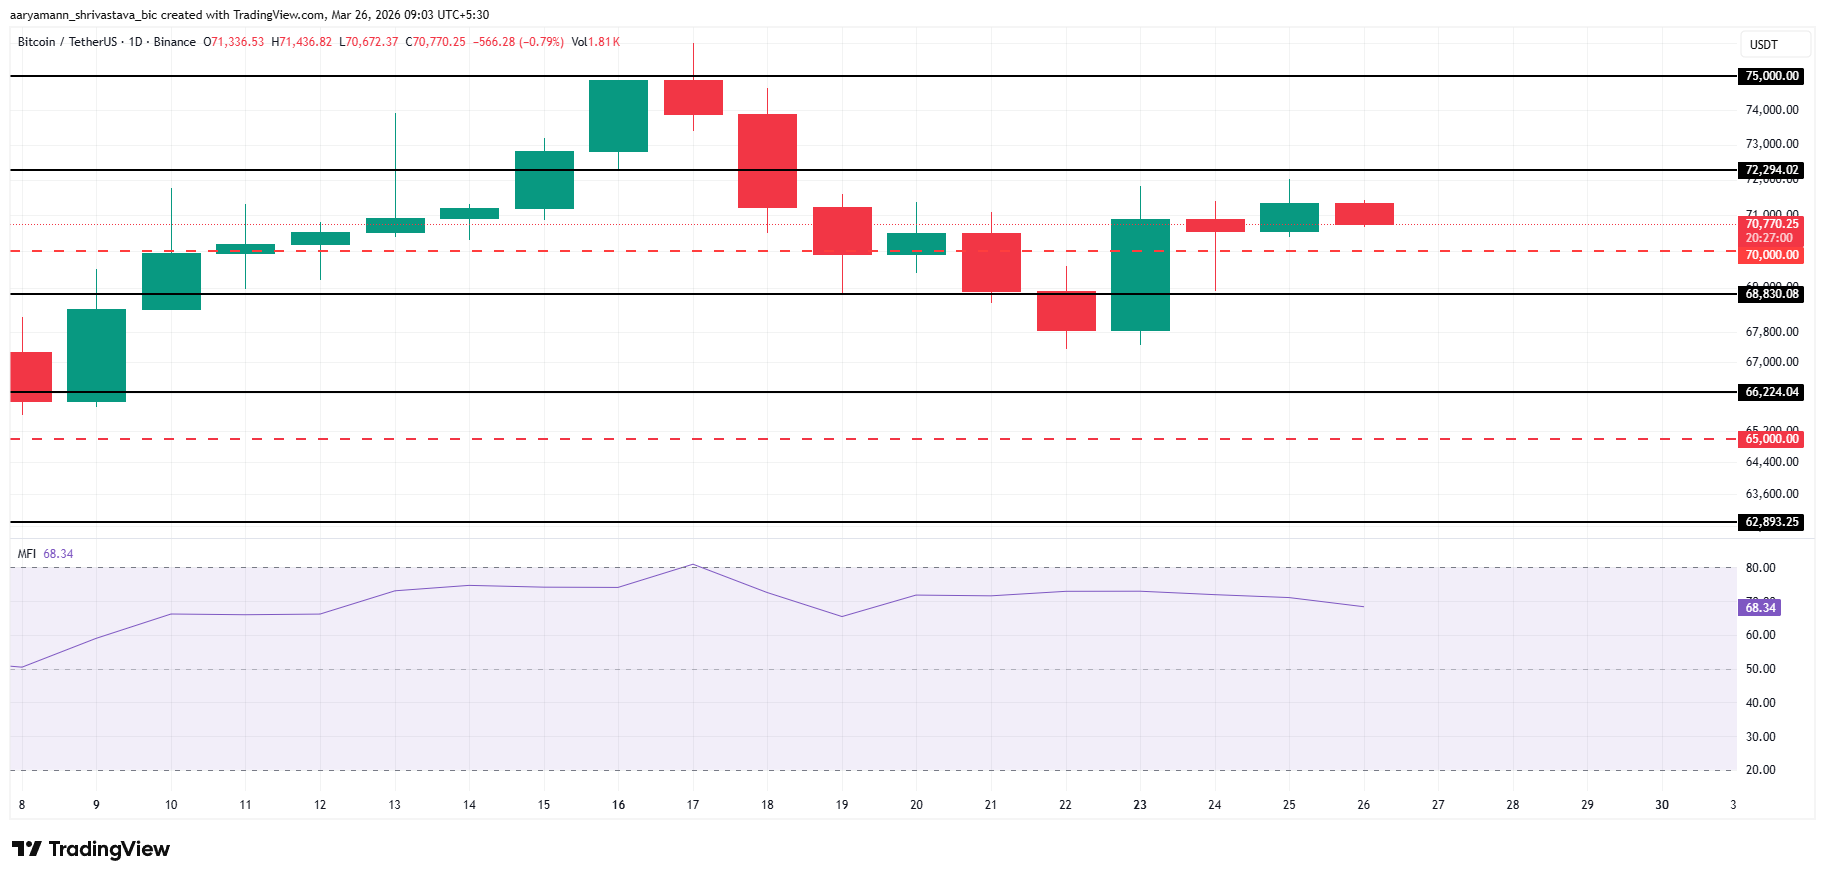
The $70,000 level marked by the red dashed line is the immediate battleground. Bitcoin’s daily close above $72,294 targets $75,000 next. A break below $68,830 puts $66,224 in focus, with the $65,000 red-dashed floor representing the last line of defense for bulls.
Memecore Notes a Sharp Spike
Memecore surged 39.62% on March 25, printing a large bullish candle that broke decisively above the prior consolidation zone between $1.64 and $1.89. The Fibonacci extension grid places the 1.5 level at $2.34 and the 2.0 level at $2.66, both now within reach given the momentum of the breakout.
The 20-day EMA sits at $1.76, now well below the current price after the breakout candle. The EMA has been rising steadily throughout March. This confirms that the uptrend structure was building before the explosive move.
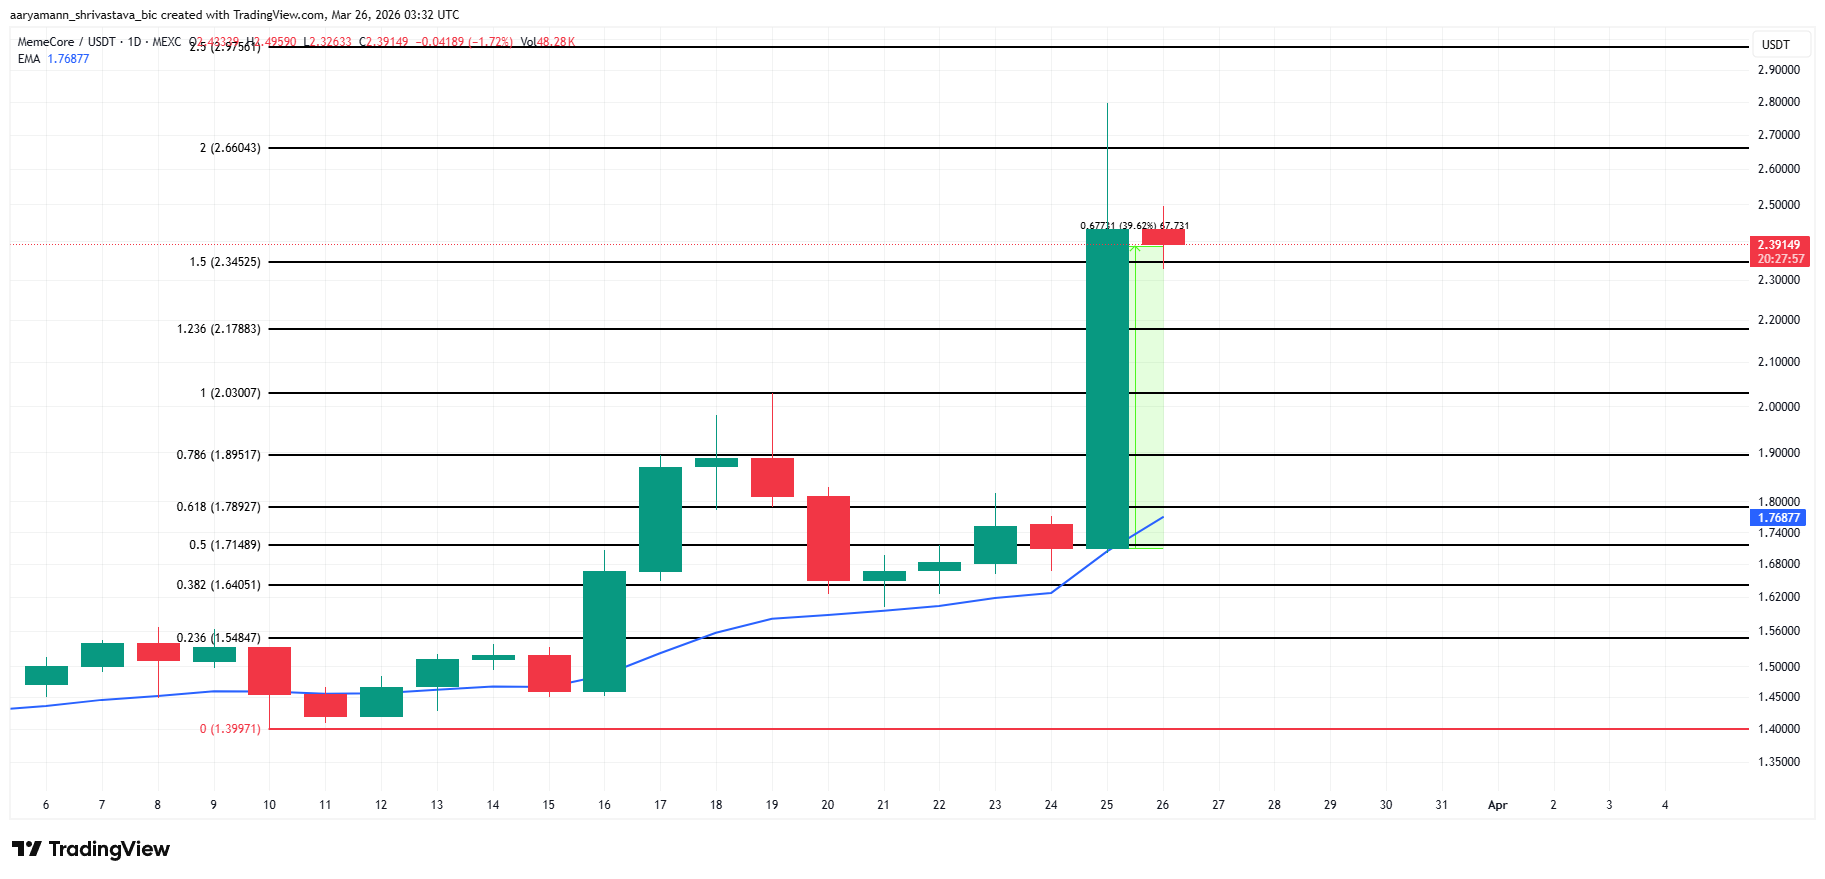
The bullish thesis holds as long as Memecore defends the $1.64 horizontal level on any pullback. A daily close below that support would invalidate the breakout and open the door back toward the Fibonacci zero level at $1.39, the red line at the bottom of the chart.
