


Since reaching a high of 53,210 satoshis on Feb. 14, the EOS price has decreased considerably. However, it has been giving some reversal signals, more specifically the creation of a bullish reversal pattern and two long lower wicks.
EOS(EOS) Price Highlights
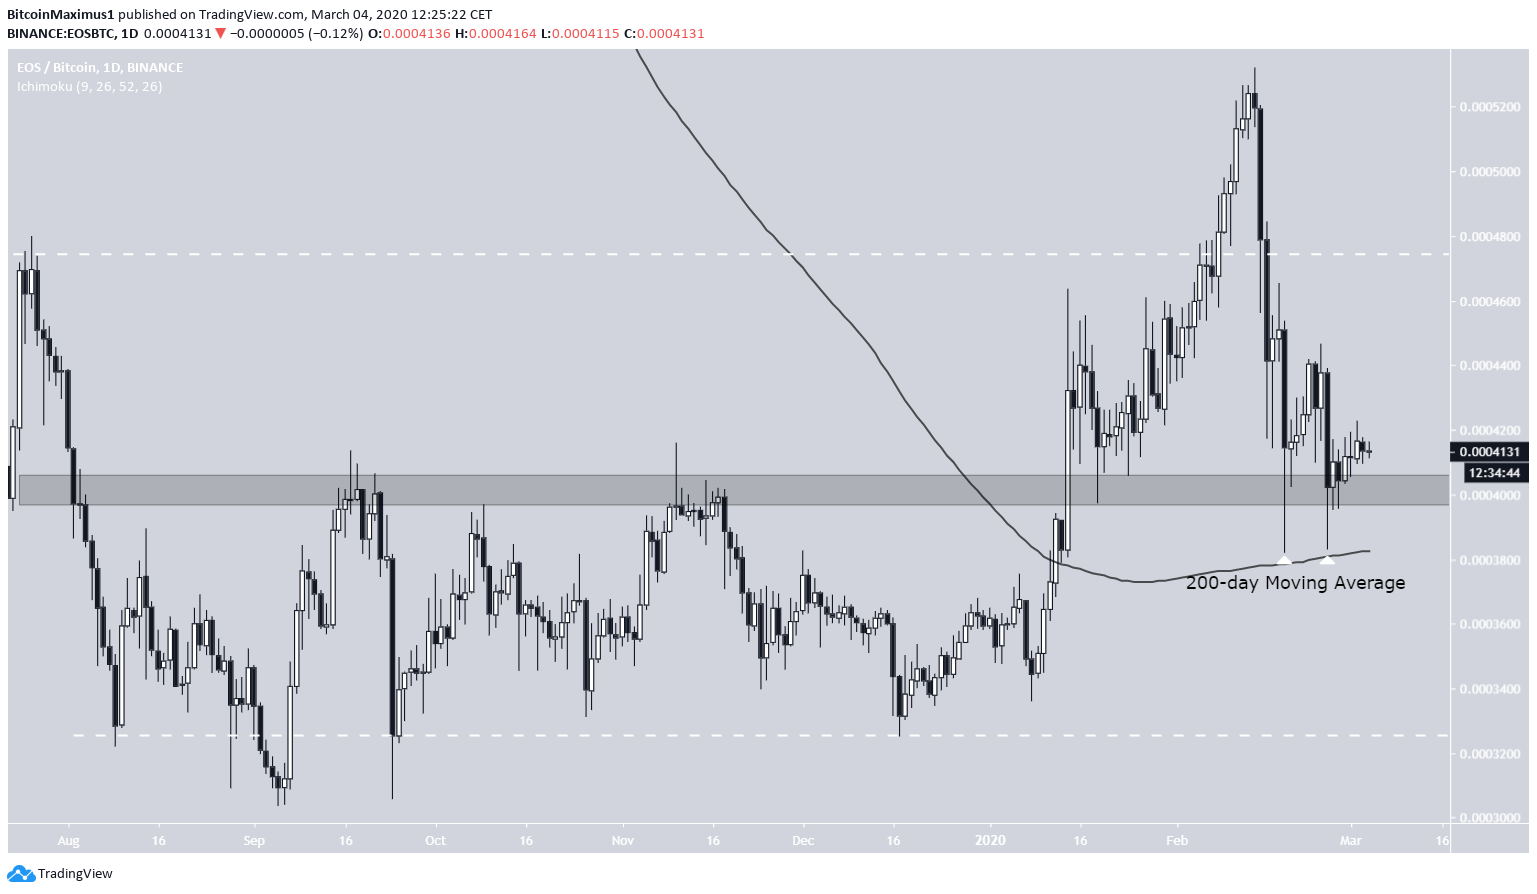
- The price is trading inside a range of between 32,500 and 48,000 satoshis.
- It has found support above its 200-day moving average (MA).
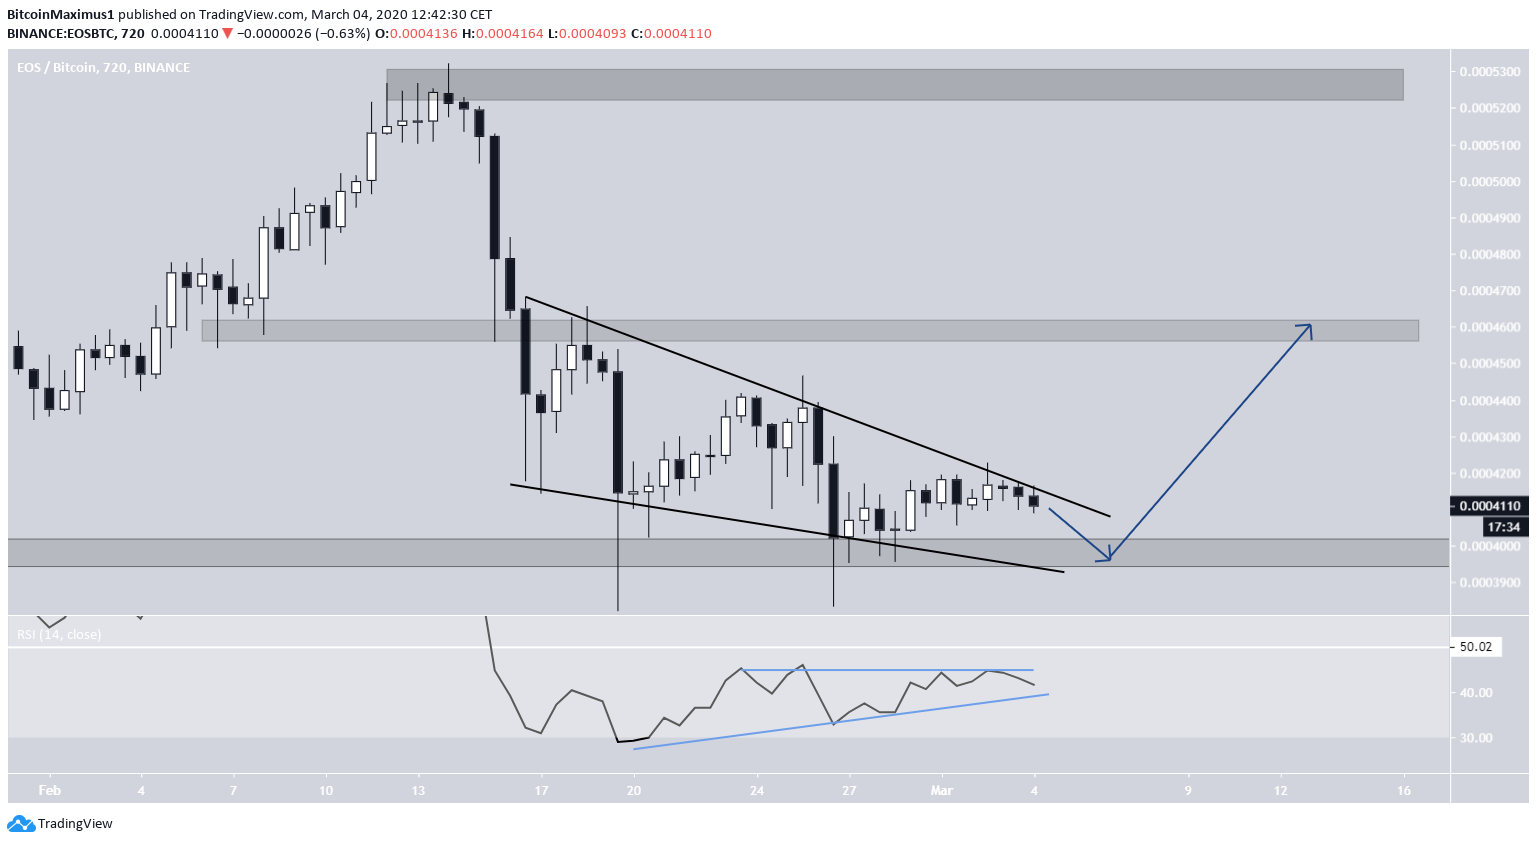
- It is trading inside a descending wedge.
- The RSI supports a breakout.
- There is resistance at 46,000 satoshis.
Bitcoin investor and cryptocurrency trader @George1Trader tweeted an EOS chart, outlining a long-term range of between 32,500 and 48,000 satoshis. The price is currently trading in the middle of his range. He believes that it will continue moving upward toward the range high and possibly break out.
$EOSBTC pic.twitter.com/Xn2XmIPxlJ
— George (@George1Trader) March 4, 2020
Let’s take a closer look at this EOS range and its price movement and determine if the price will actually get there.
Trading Range
As stated in the introduction, the resistance and support lines of the range are found at 32,500 and 48,000 satoshis.
Currently, the price is trading very close to the middle of the range at 41,000 satoshis. This area is further supported by the 200-day moving average (MA).
The price has created two very long lower wicks on Feb. 19 and 26, respectively, a sign of considerable buying pressure. The fact that these wicks have also validated the 200-day MA is indicative that the current trend is bullish.
Descending Wedge
In the shorter-term, the price has been trading inside a descending wedge, which is considered a bullish reversal pattern. So, a breakout from this wedge is expected.
The possibility of a breakout is increased by the ongoing bullish divergence in the RSI, which has also created an ascending triangle. Therefore, after a possible decrease to validate the support area/line of the wedge, the EOS price is expected to break out and reach 46,000 satoshis.
Short-Term Movement
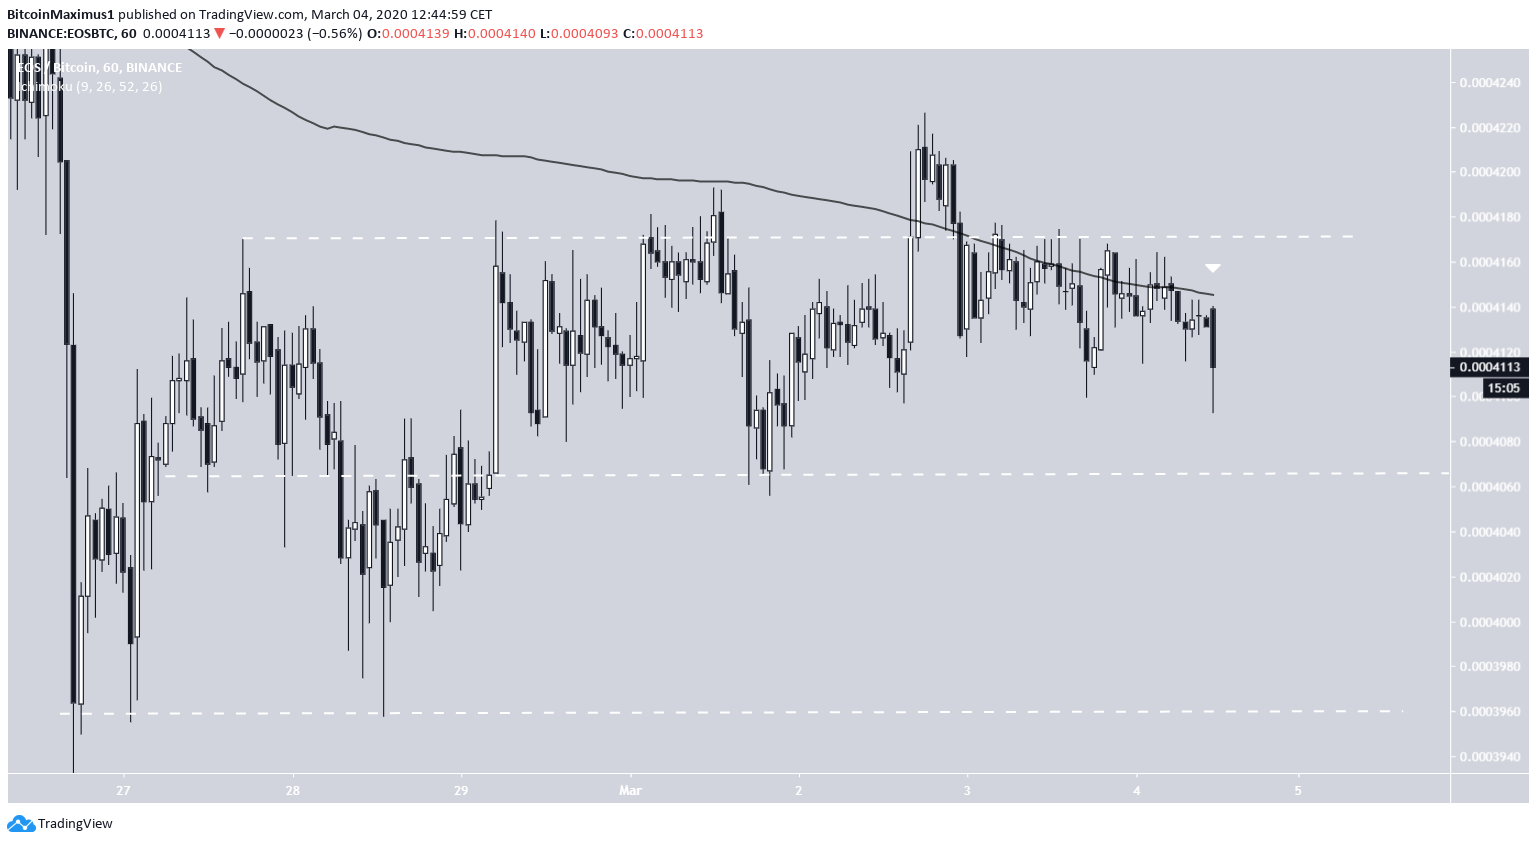
The hourly chart suggests that an initial decrease is more likely, postponing the possibility of an immediate breakout.
The price has falsely broken out above the resistance of the short-term range and the 200-hour MA only to fall right back inside it. It is now facing resistance from the same MA. It is expected to go down at least to the middle of the range, prior to breaking out.
To conclude, the EOS price is holding onto a significant support area. It has created a bullish reversal pattern, out of which it is expected to break out and reach 46,000 satoshis. At the current time, we cannot confidently make a prediction on the possibility of breaking out above the current range outlined in the first section.


