


Cardano (ADA) has been trading inside a neutral pattern since its May bottom. A breakdown from it could greatly accelerate the rate of decrease.
Cardano’s Vasil upgrade went live on Sept. 22, while the new capabilities for developers launched one epoch later, on Sept. 27. Vasil is the most extensive upgrade for Cardano until now and is expected to improve decentralized application (dApp) capabilities while increasing speed and reducing costs.
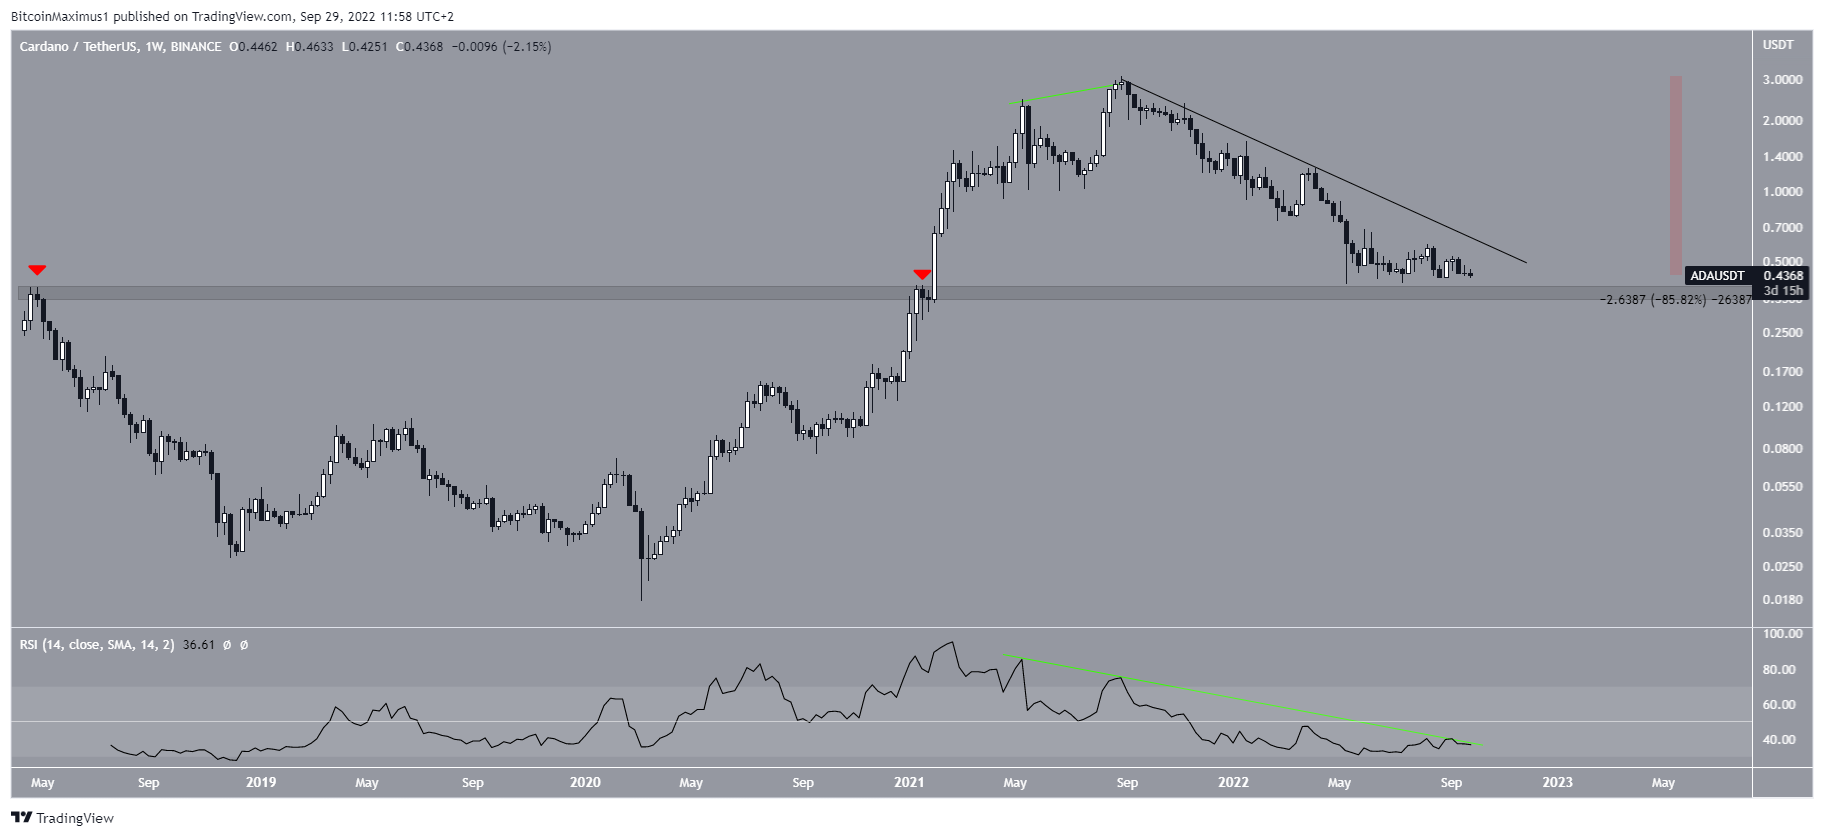
Despite this upgrade, the price movement still looks bearish. ADA has decreased by 86% since reaching an all-time high price of $3.10 in Aug. 2021. The downward movement has followed a descending resistance line.
While the downward movement has stalled since May, the price has yet to reach an important horizontal support level. The closest support is at $0.36, created by the 2018 and Jan. 2021 highs (red icons). The area has not been tested since the breakdown.
Moreover, the bearish divergence trend line (green) that led to the downward movement is still intact.
So, a decrease towards at least the long-term support area at $0.36 seems to be the most likely scenario.
Breakdown in ADA price looks likely
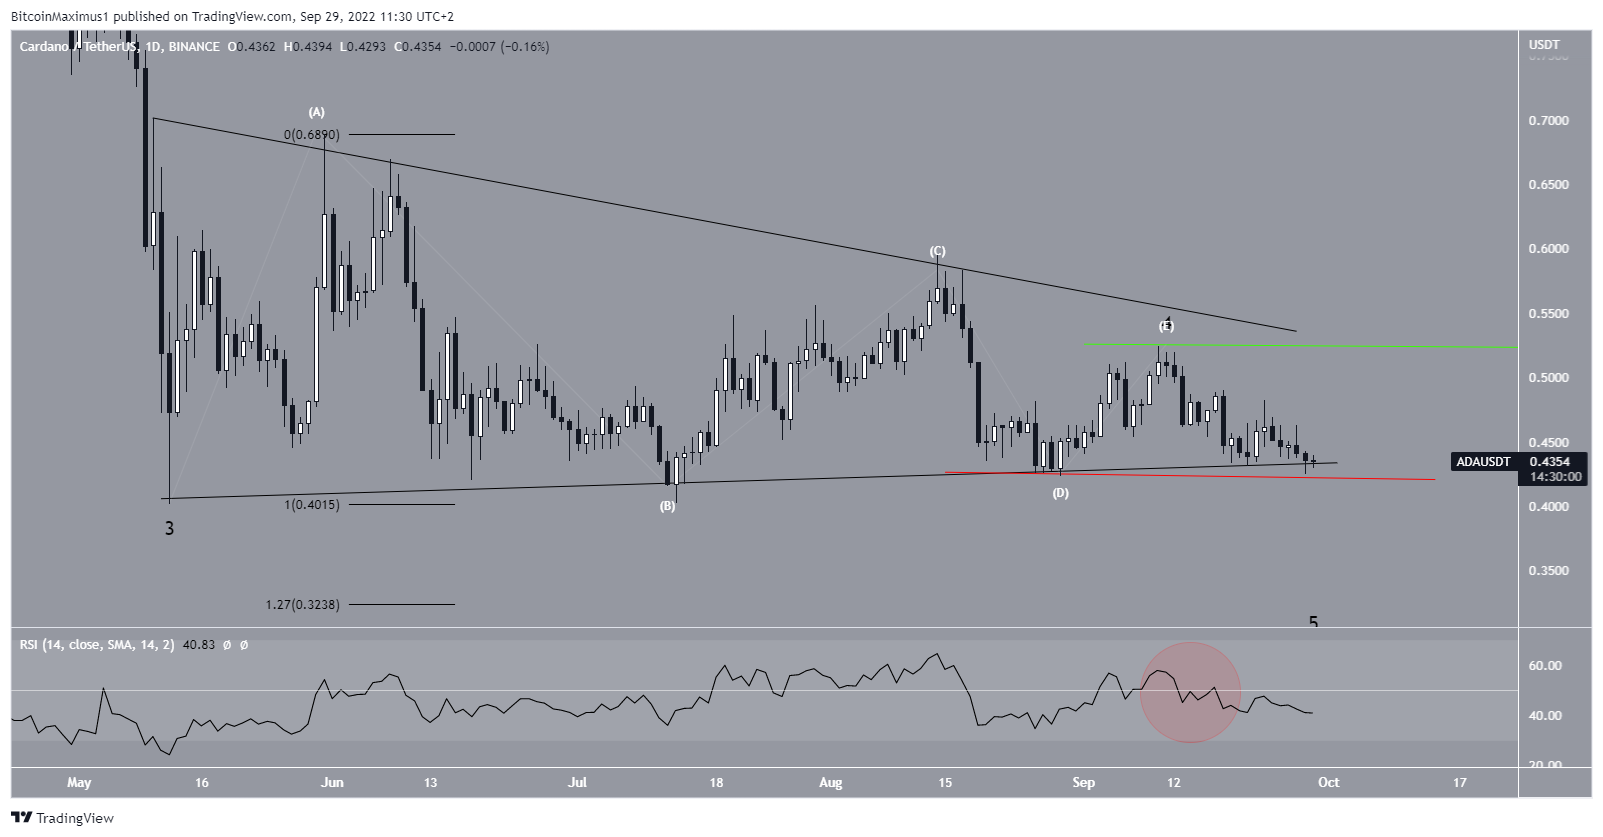
The daily chart shows that ADA has reached the support line of a symmetrical triangle that has been in place since May 12.
The support line has been touched five times so far, suggesting that an eventual breakdown is the most likely scenario. The fact that the triangle is transpiring after a downward movement further supports this possibility. Moreover, the RSI is below 50, another sign that the trend is bearish.
If a breakdown occurs, the next closest support levels will be at $0.323 and $0.226. They are created by the 1.27 and 1.61 Fib levels when measuring the height of the triangle. The first target would also fit with the long-term support area outlined previously.
Since there is a completed triangle count (white), a decrease below the D wave low (red line) at $0.423 would confirm it, while an increase above the wave E high (green line) at $0.52 would invalidate it.
For Be[In]Crypto’s latest Bitcoin (BTC) analysis, click here


