The EOS price has reclaimed the support area of a long-term trading range, indicating that it might begin to move towards resistance.
DASH has yet to reclaim its own support area, but technical indicators are showing that it might soon do so.
EOS (EOS)
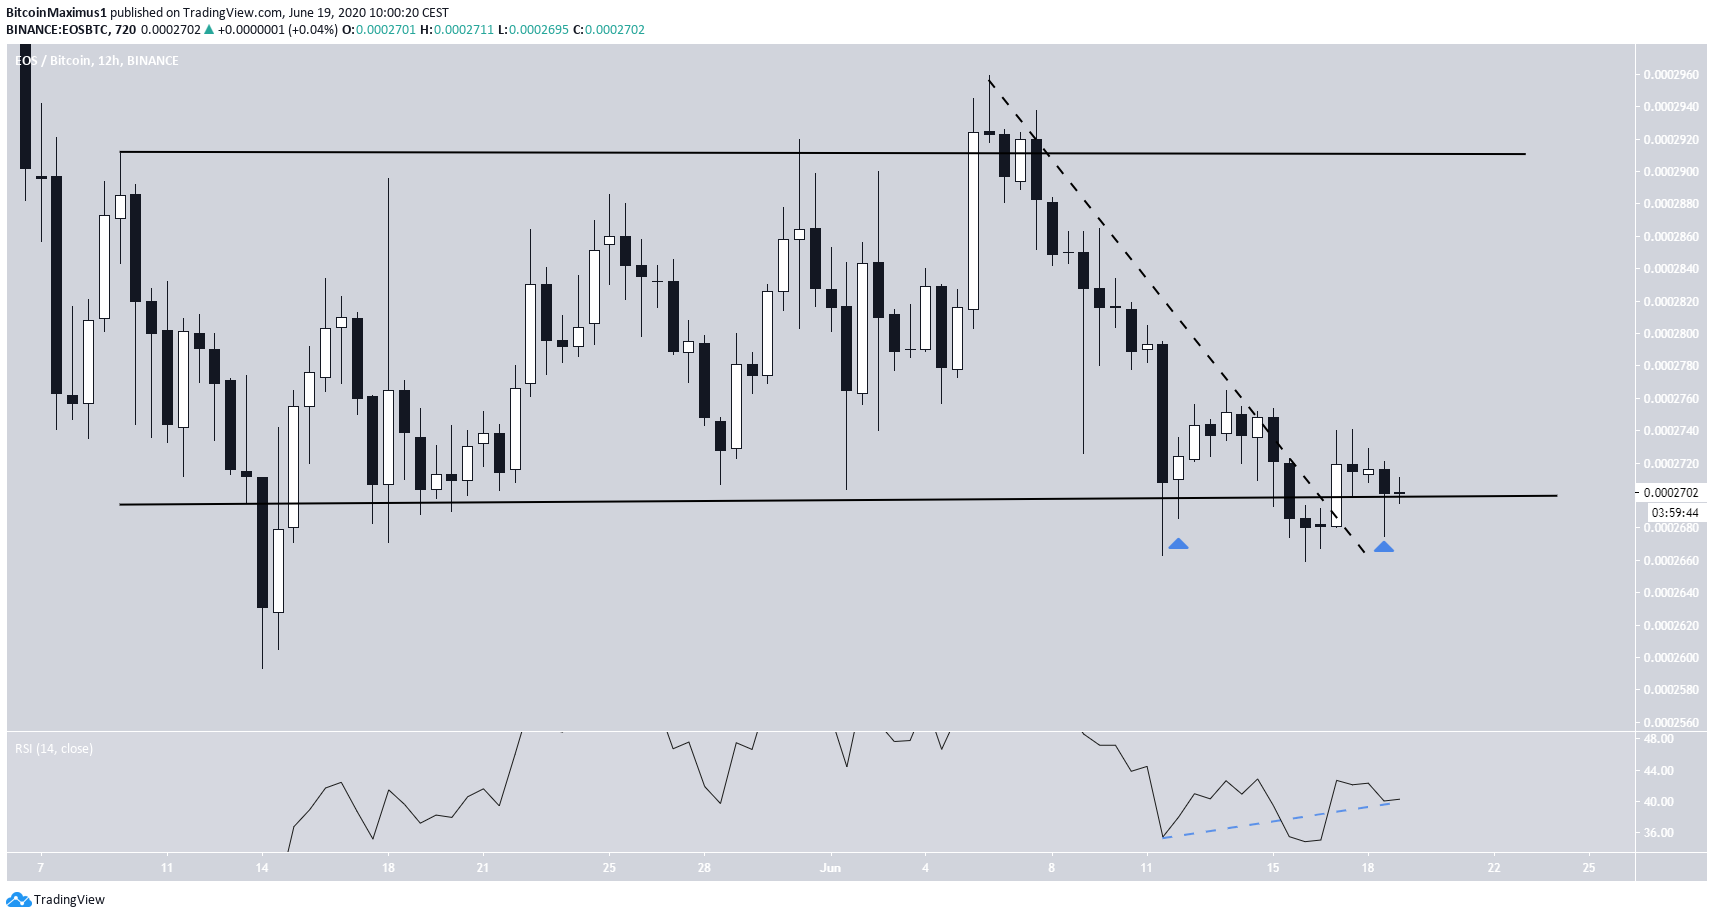
The EOS price has been trading inside a range of 2700 to 2900 satoshis since May 7. There have been two deviations below and above this range, on May 14 and June 5, respectively. Both returned to the range shortly after that.
At the time of writing, the price was trading right on the support line of this range, having created several long lower wicks below it.
There is a possible double bottom pattern, which is combined with bullish divergence on the RSI. The trend is highly unusual, however, and the divergence not particularly clear.
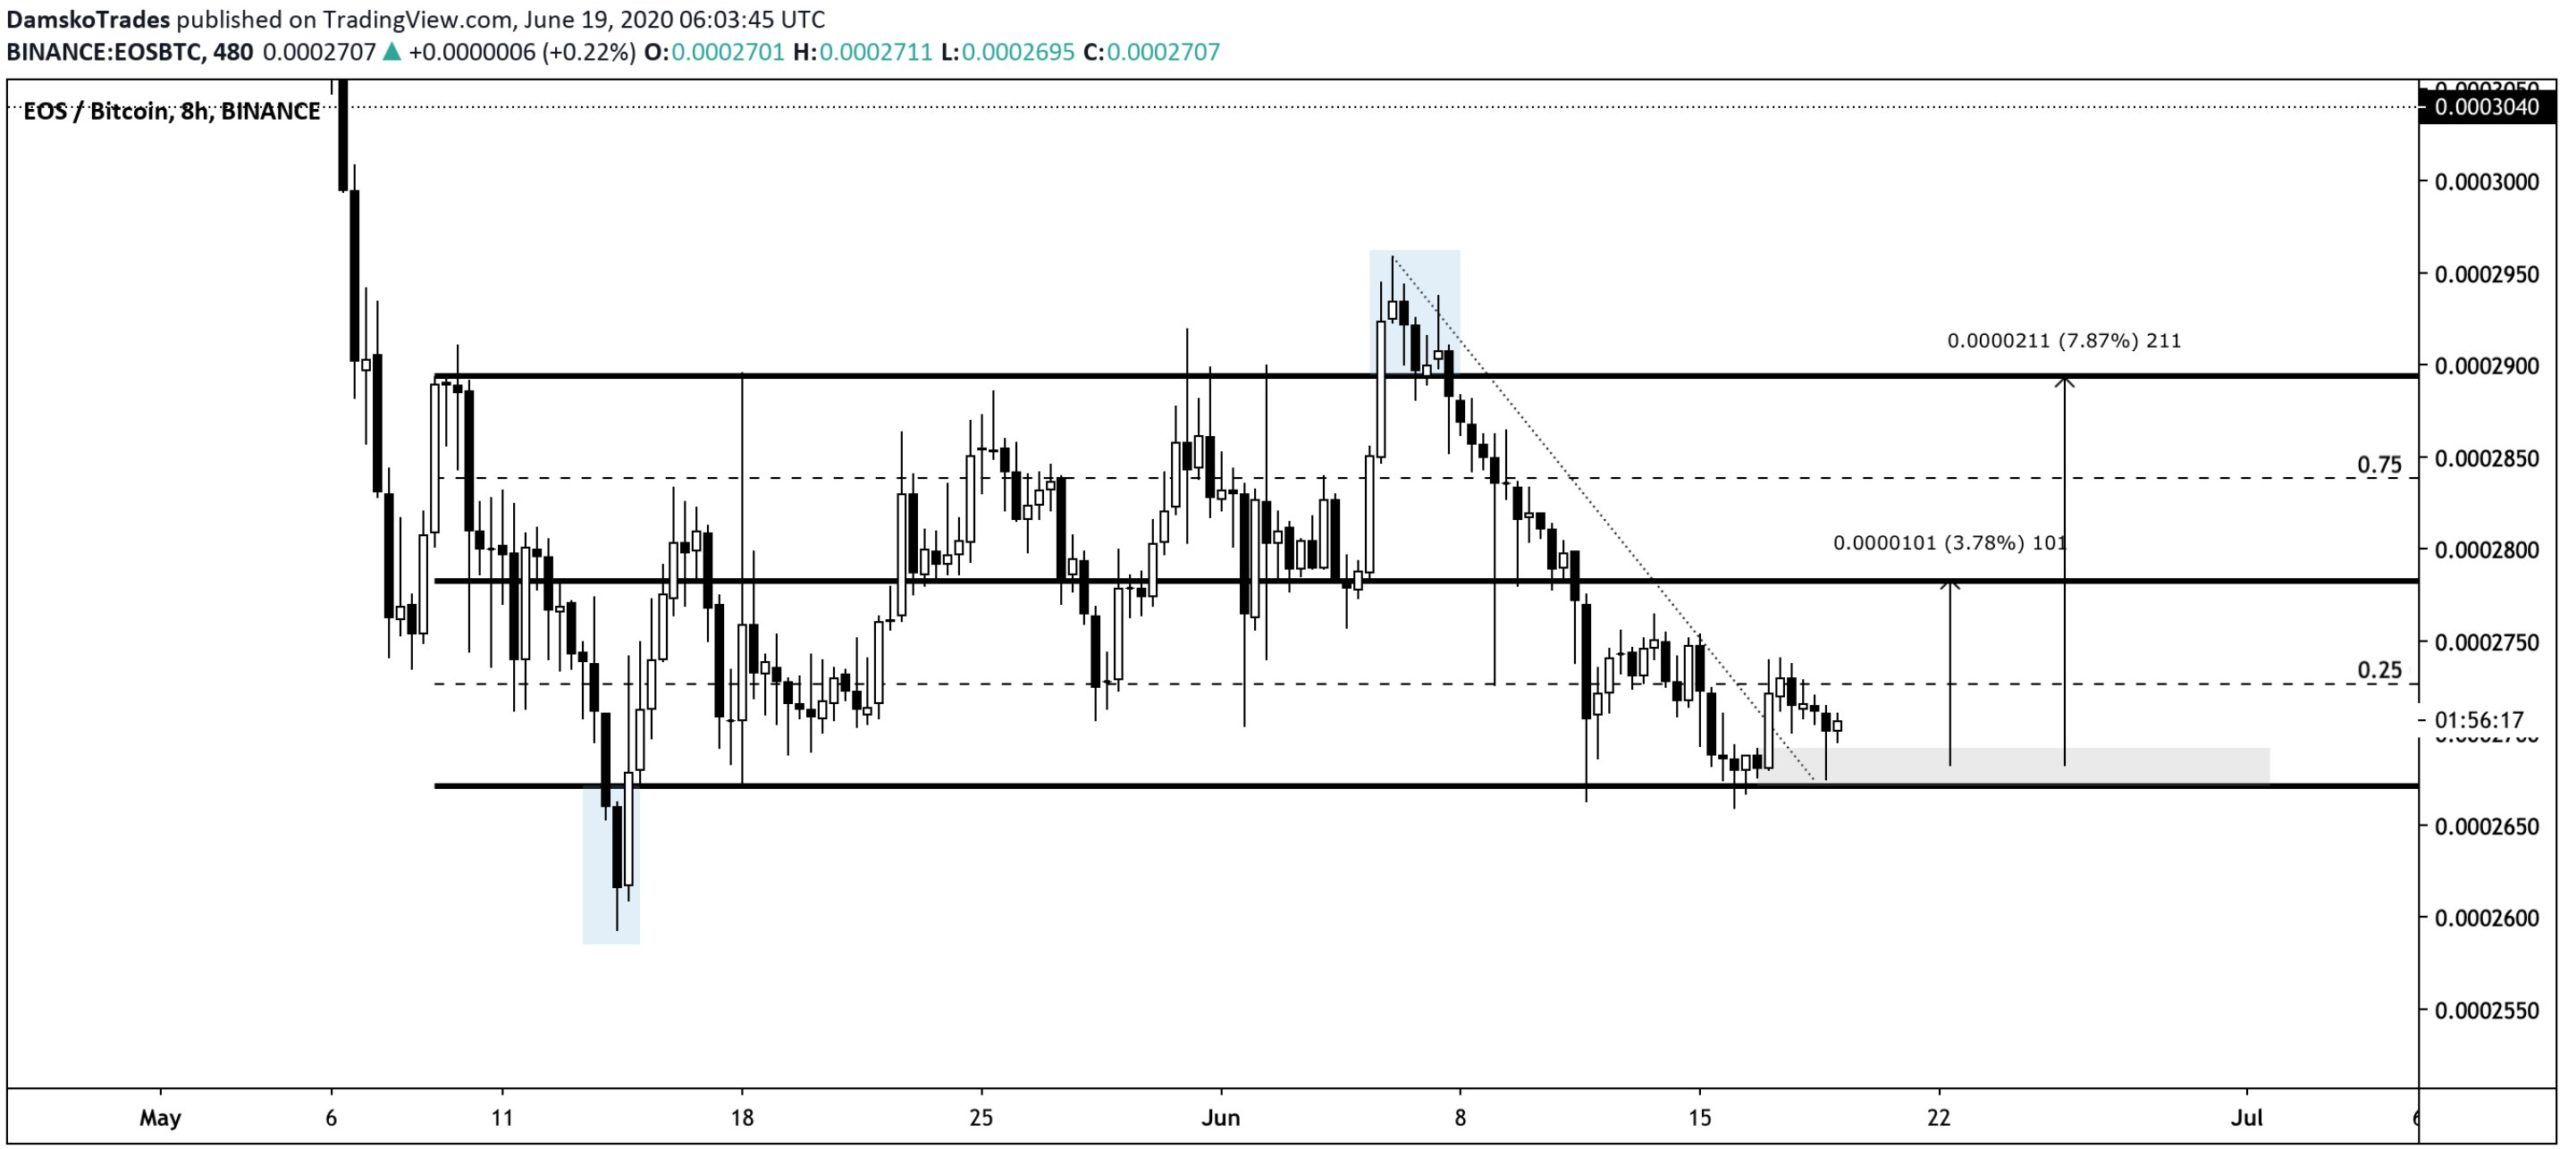
Well-known trader @Damskotrades stated that EOS is his only open altcoin position. Here he outlines the same trading range and an initial upward movement towards 2780, followed by a move to 2900 satoshis.
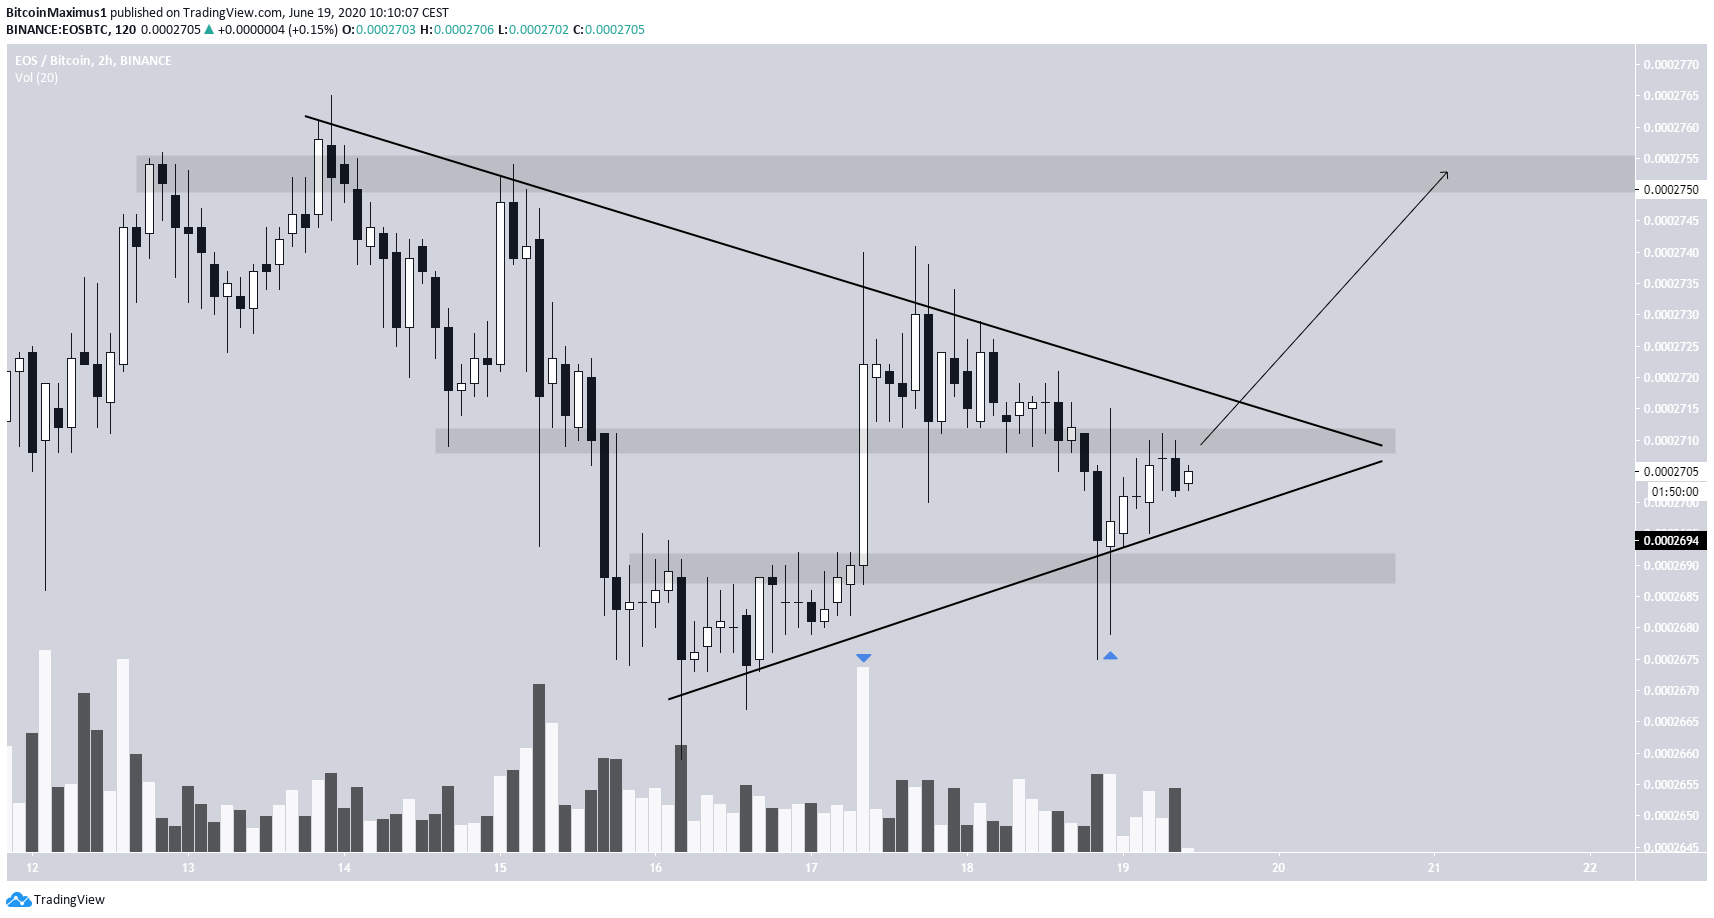
In the short-term, the price is possibly trading inside a symmetrical triangle. It has shown strength by flipping the minor 2690 satoshi area as support, but is still facing resistance from the 2710 satoshi area.
A breakout above the latter and the descending resistance line of the triangle would indicate that EOS is likely ready to continue moving upwards.
Dash (DASH)
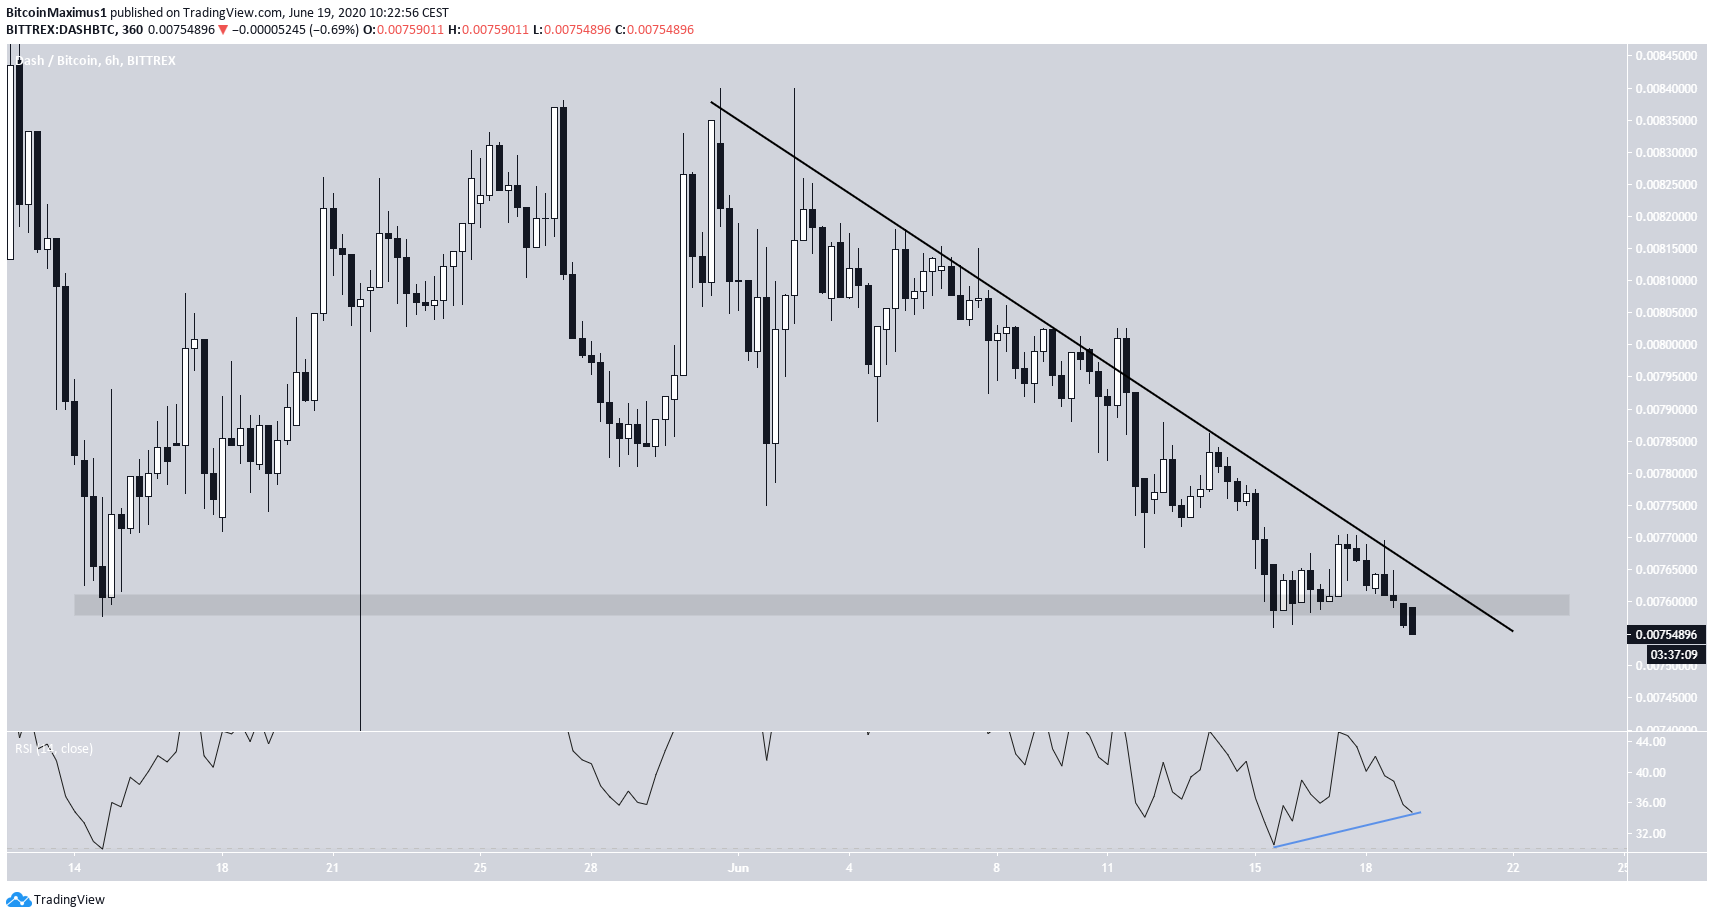
The main support area for DASH is found at ₿0.0076. The price reached this level on May 14 and initiated a rapid upward move. It reached that level once more on July 15, but failed to break out and is at risk of falling below it once more. In addition, the price is following a descending resistance line.
In order for the price to begin moving upwards, it has to reclaim this support area and break out from the descending resistance line. While there is some bullish divergence on the daily RSI, it has yet to be confirmed. There are no other signs of a reversal yet.
If the price is successful in breaking out, it should move towards ₿0.008 initially and eventually ₿0.0084.