


On Apr 29, 2019, the price of Litecoin reached a low of $68.64 and €58.21. A rapid increase ensued and the price reached a high of $79.42 and €68.86 the next day.
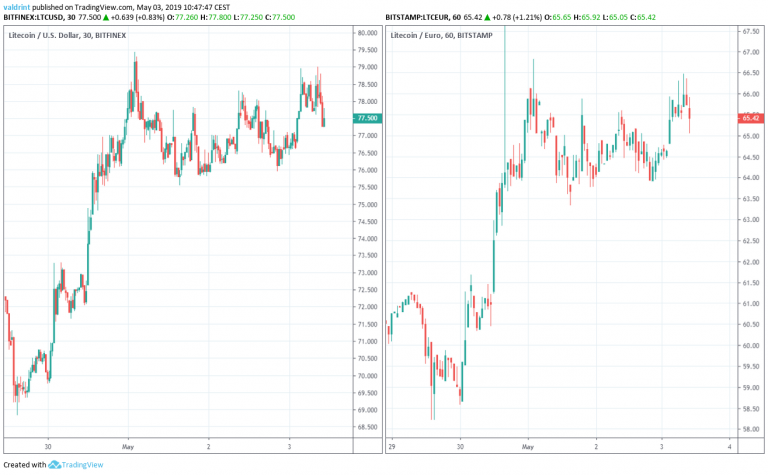
Since then, Litecoin has been gradually decreasing.
Will Litecoin keep decreasing or will a reversal start an uptrend?
Let’s find out!
Litecoin (LTC): Trends And Highlights For May 3, 2019
- Both LTC/USD and LTC/EUR have been on an uptrend since Apr 29.
- It is trading inside a symmetrical triangle.
- Bearish divergence is developing in the RSI and the MACD.
- There is support near $74.5/€62.5.
Symmetrical Triangle
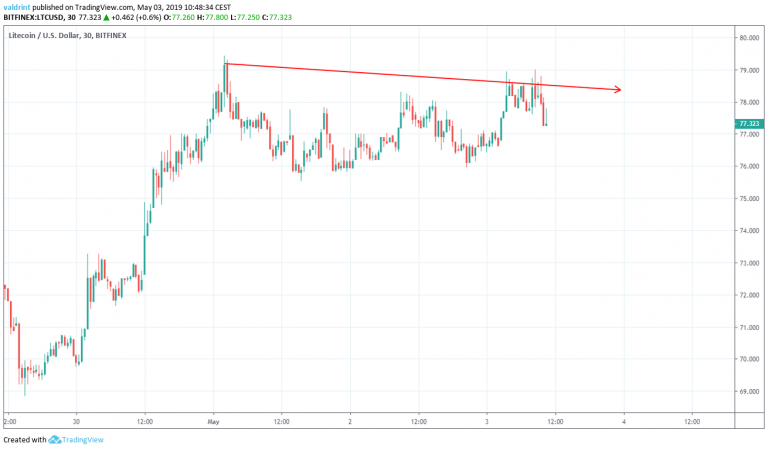
On May 1, the price reached a high of $79.42. Several market cycles have been completed. The price has reached lower highs each time.
Tracing these highs gives us a descending resistance line:
On Apr 30, the price reached an hourly low of $74.81. A gradual increase was followed by a gradual decrease. After every cycle, the price has created higher lows. Tracing these lows gives us an ascending support line.
The support and resistance lines combine to create a symmetrical triangle:
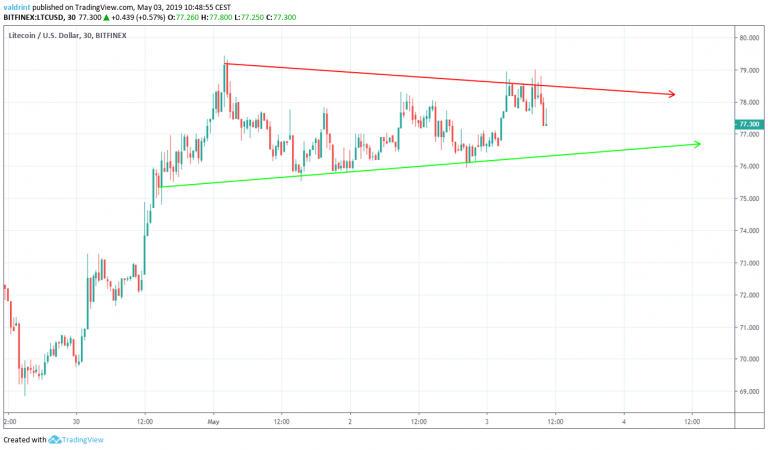
It is likely that the price will continue to trade inside the confines of this triangle until a decisive move occurs. In order to predict the direction of the move, we need to take a look at technical indicators.
Technical Indicators
In this section, the price of LTCUSD is analyzed at two-hour intervals alongside the RSI and the MACD.
The relative strength index (RSI) is an indicator which calculates the size of the changes in price in order to determine oversold or overbought conditions in the market.
These are traced in the graph below:
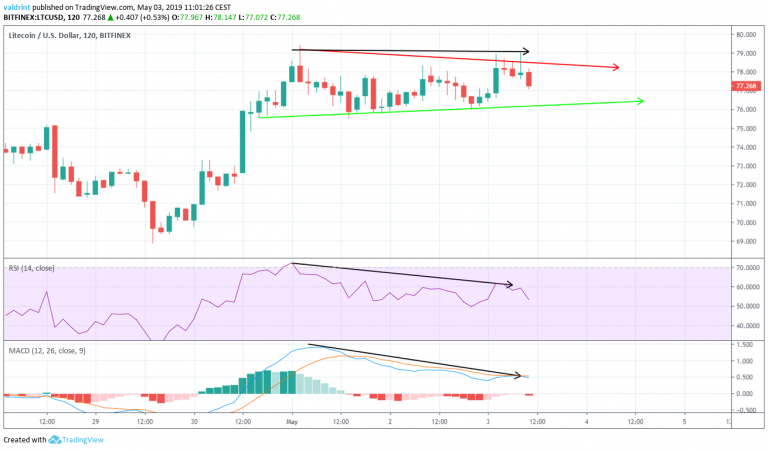
On May 1, the price reached a high of $79.4 It reached a similar high on May 3.
Similarly, the RSI and the MACD made the first high on May 1. However, they have proceeded to generate lower values since. This is known as bearish divergence and often precedes price decreases.
The use of these indicators makes it likely that the price will break down from the symmetrical triangle.
Where will it find support?
Future Movement
To better determine actual future price levels, we examine support areas.
One support area is shown for LTC/USD in the first graph and another for LTC/EUR in the second graph:

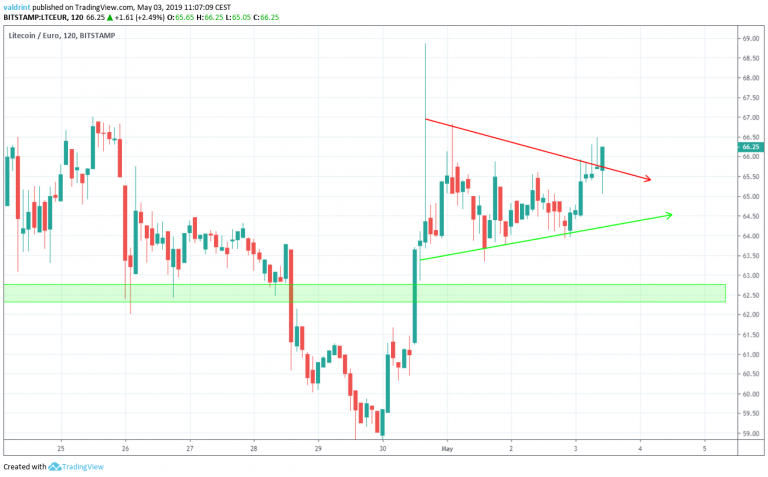
The closest support area is found near $74.5/€62.5. If the price breaks down from the triangle, it is likely to provide reversal. We believe that the price will eventually reach this area.
Summary Of Analysis
Based on this analysis, it is likely that the price will break down form the triangle and decrease towards the support area we have outlined above.
Do you think the price of LTC will reach the support area? Let us know in the comments below.
If you’re interested in 2019 and 2020 price predictions for Litecoin in dollars, click on the blue button below:
Disclaimer: This article is not trading advice and should not be construed as such. Always consult a trained financial professional before investing in cryptocurrencies, as the market is particularly volatile.


