


Key Highlights For March 6
- The price reached a high of nearly $4200 on Feb 24.
- A flash crash caused it to drop to nearly $3670.
- It has been struggling to break out above $3900 since.
- The price is moving inside a horizontal channel.
- There is short-term bearish divergence developing.
- The price made a rapid upward move on Mar 5.
The Resistance Line
The price of BTC on Bittrex is analyzed in 1-Hour intervals from Feb 26 to Mar 6.
The price of BTC reached a high of nearly $4200 on Feb 24. A flash crash caused it to drop sharply to nearly $3670.
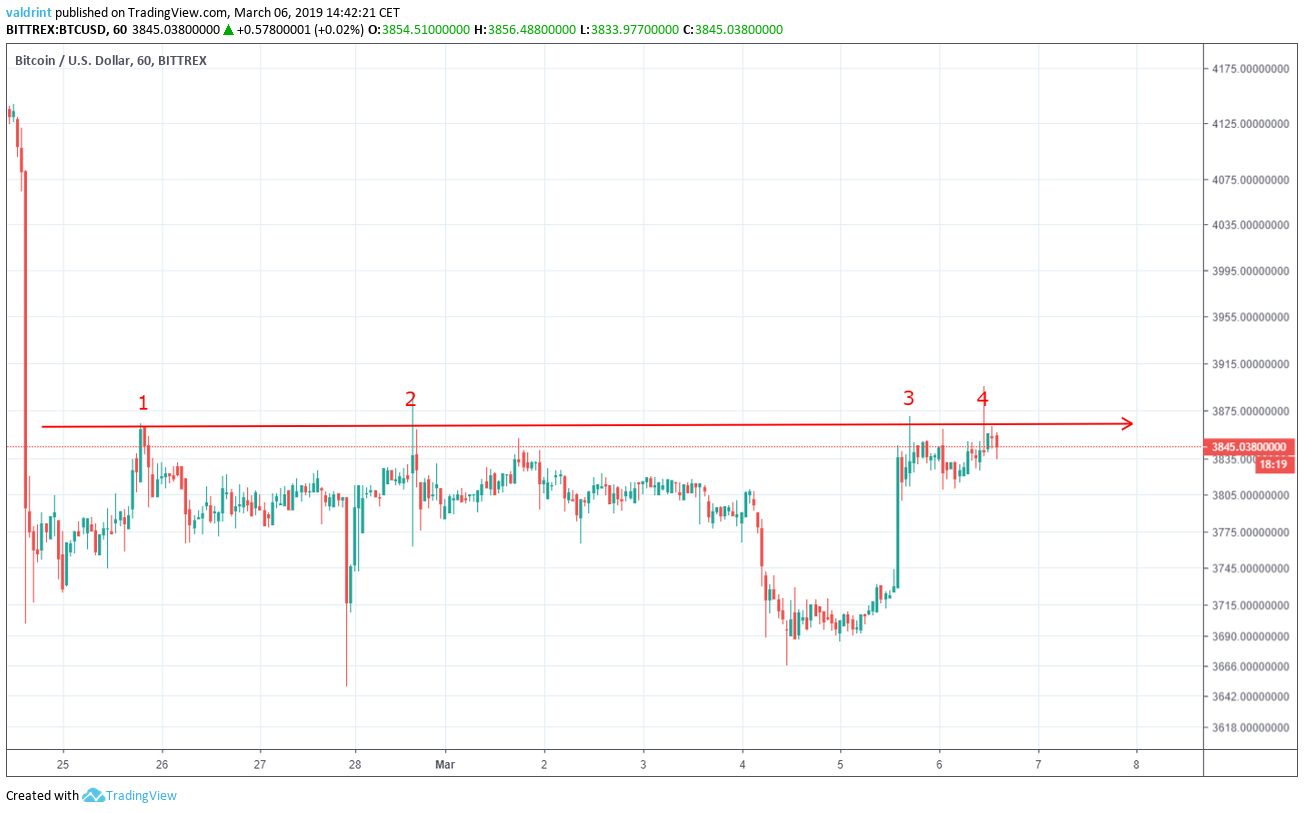
The price rebounded to a level close $3870 on Feb 25. The price reached the same level several times. The horizontal resistance line is created by tracing these successive highs.
The validity of the resistance line is increased by the number of times the line is touched. The line was touched four times. The dates in which the line was touched were:
- Feb 25
- Feb 28
- Mar 5
- Mar 6
A resistance line can act as a ceiling to price, preventing movement above a certain level. However, a breakout above can initiate a rapid upward movement.
Horizontal Channel
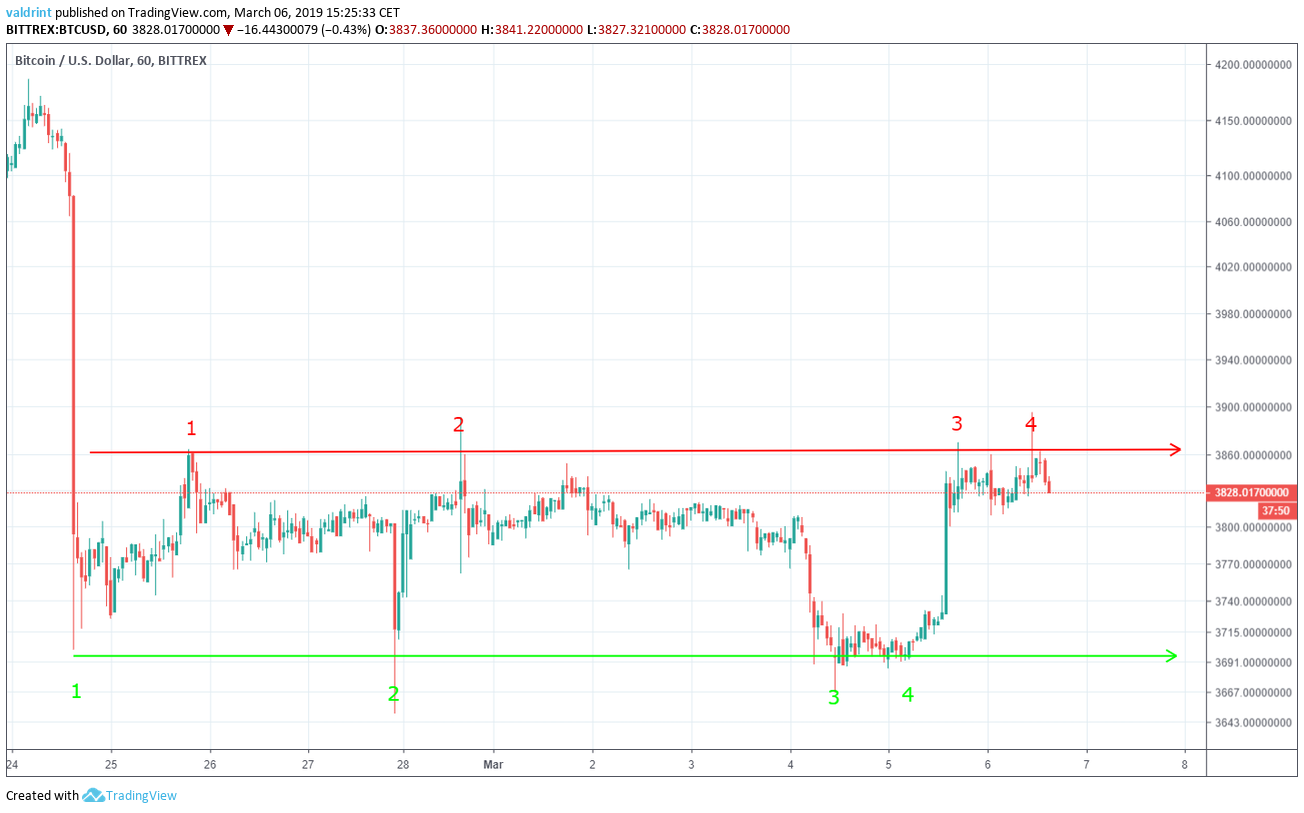
The horizontal support line is created by connecting the successive lows. The line was touched four times. The breakdowns by a wick can be ignored in a volatile market.
The resistance and support lines combine to create a horizontal channel. If price moves outside this channel for a significant period, new resistance and support lines may develop. The dates in which the line was touched were:
- Feb 24
- Feb 28
- Mar 4
- Mar 5
Rapid Upward Move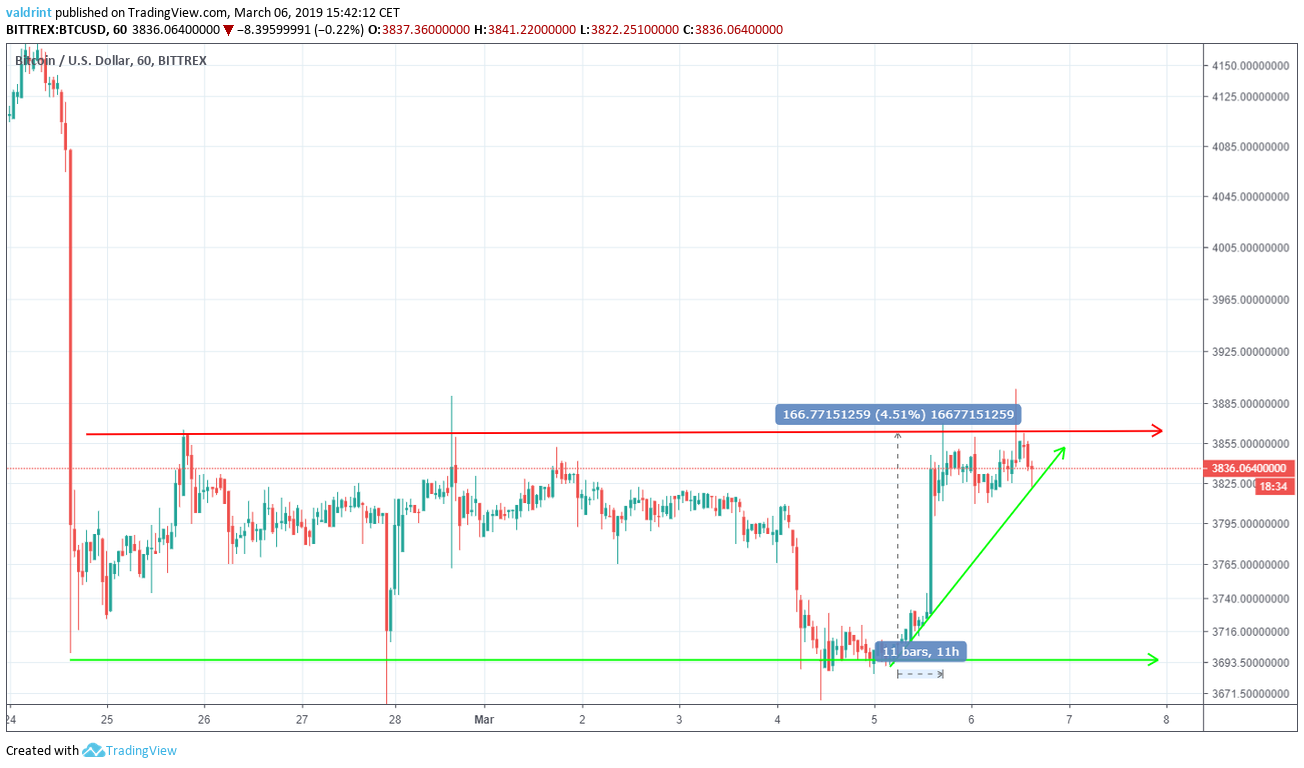
The price of BTC traded inside the channel without significant fluctuations from Feb 24 to Mar 5.
On Mar 5 it initiated an upward move that took it to $3870. The move occurred within 11 hours and represented an increase of 4.5% The magnitude and speed of the increase suggest that the downward movement may be over and further increases in price may be forthcoming.
Looking Out For Divergence
The moving average convergence divergence (MACD) is a trend indicator that shows the relationship between two moving averages (long and short-term) and the price. It is used to measure the strength of a move.
The relative strength index (RSI) is an indicator which calculates the size of the changes in price in order to determine oversold or overbought conditions in the market.
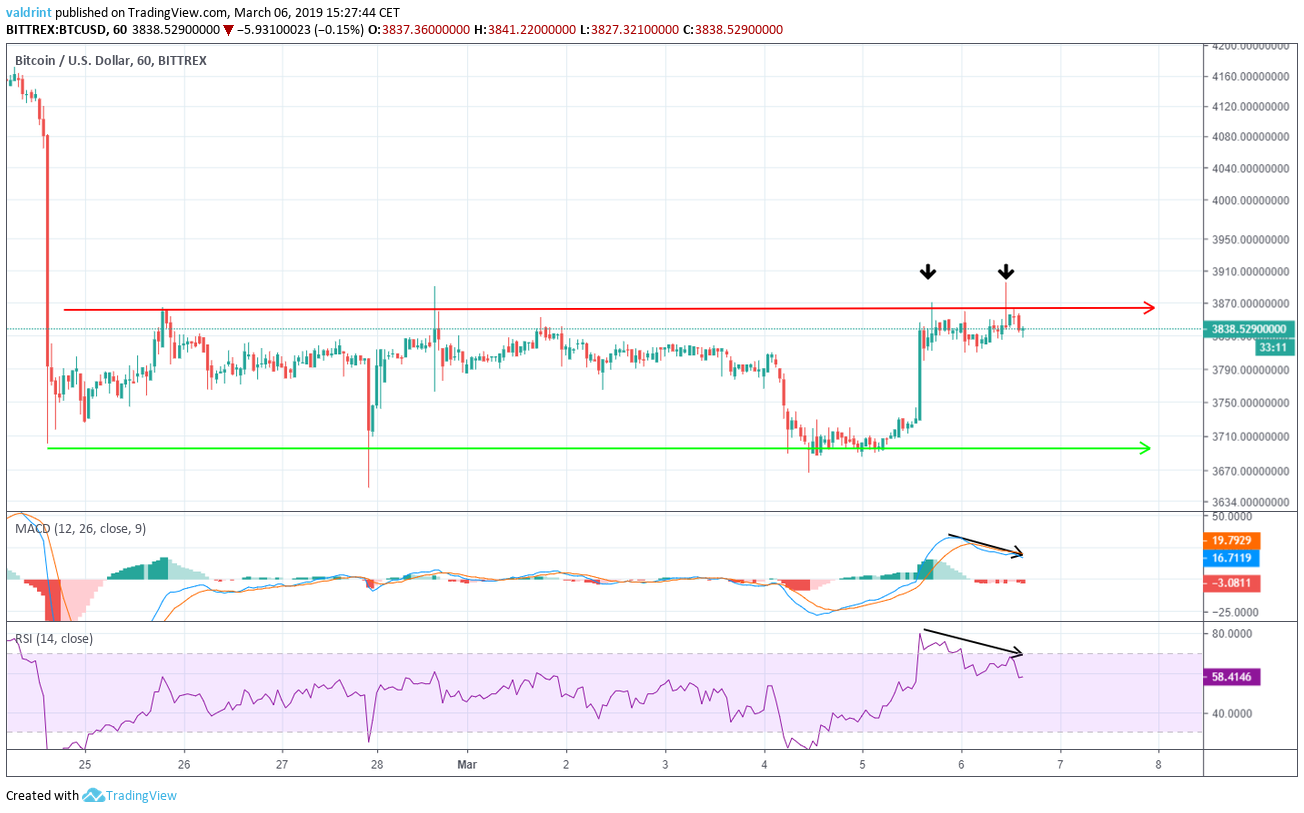
Since the beginning of the upward move on Mar 5, the price has been trading at around the same level since. In contrast, the MACD and RSI have made successive lower highs.
This is called bearish divergence. It often precedes drops in price. The use of divergence in the RSI and the MACD combined with the use of support/resistance lines can be effective in predicting a reversal.
Predictions can be especially precise if there is bearish divergence in a resistance line and both indicators are in agreement.
Given the above information, the price of BTC may trade inside the channel for a period of time before ultimately breaking out.
How long do you think the price of BTC will trade inside the horizontal channel before it breaks out? Let us know in the comments below, and check our long-term Bitcoin Price Predictions here:
Disclaimer: The contents of this article are not intended as financial advice, and should not be taken as such. BeInCrypto and the author are not responsible for any financial gains or losses made after reading this article. Readers are always encouraged to do their own research before investing in cryptocurrency, as the market is particularly volatile. Those seeking financial advice should consult with a certified financial professional.
Disclaimer: This article is not trading advice and should not be construed as such. Always consult a trained financial professional before investing in cryptocurrencies, as the market is particularly volatile.


