The NEO price has rapidly increased over the past five days. On June 3, the price broke out from a symmetrical triangle, and, at the time of writing, was rising towards the closest resistance area.
Well-known trader @CryptoNewton outlined a NEO chart that shows the price breaking out from a symmetrical triangle, with the caption “send it”. He gave a target of ₿0.00135 for the possible breakout.
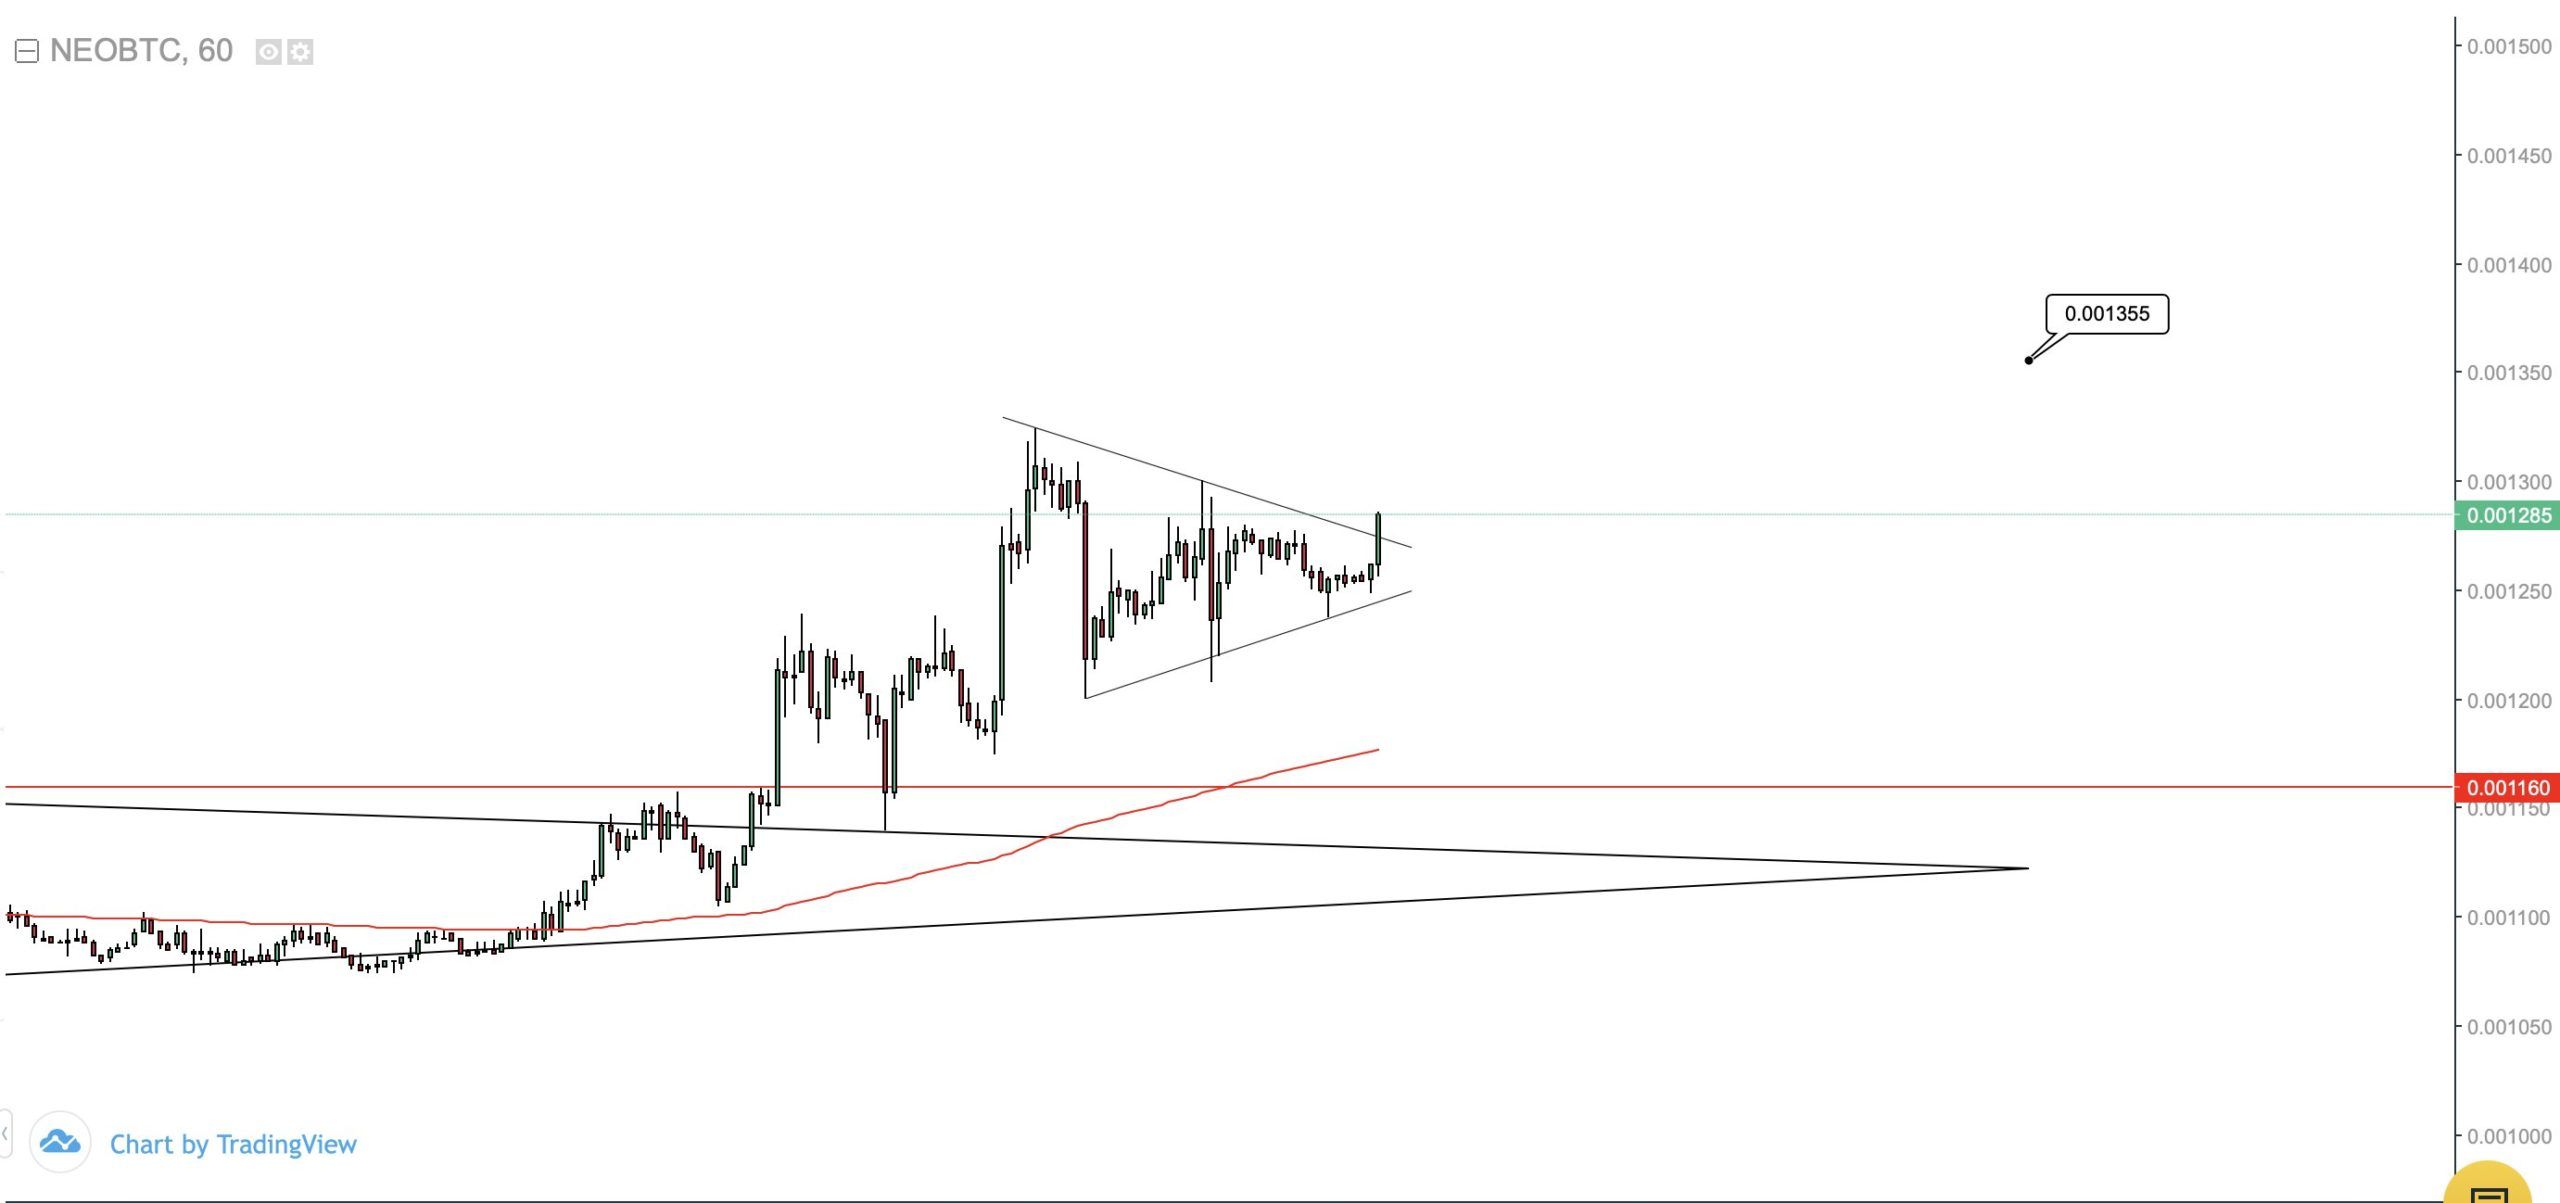
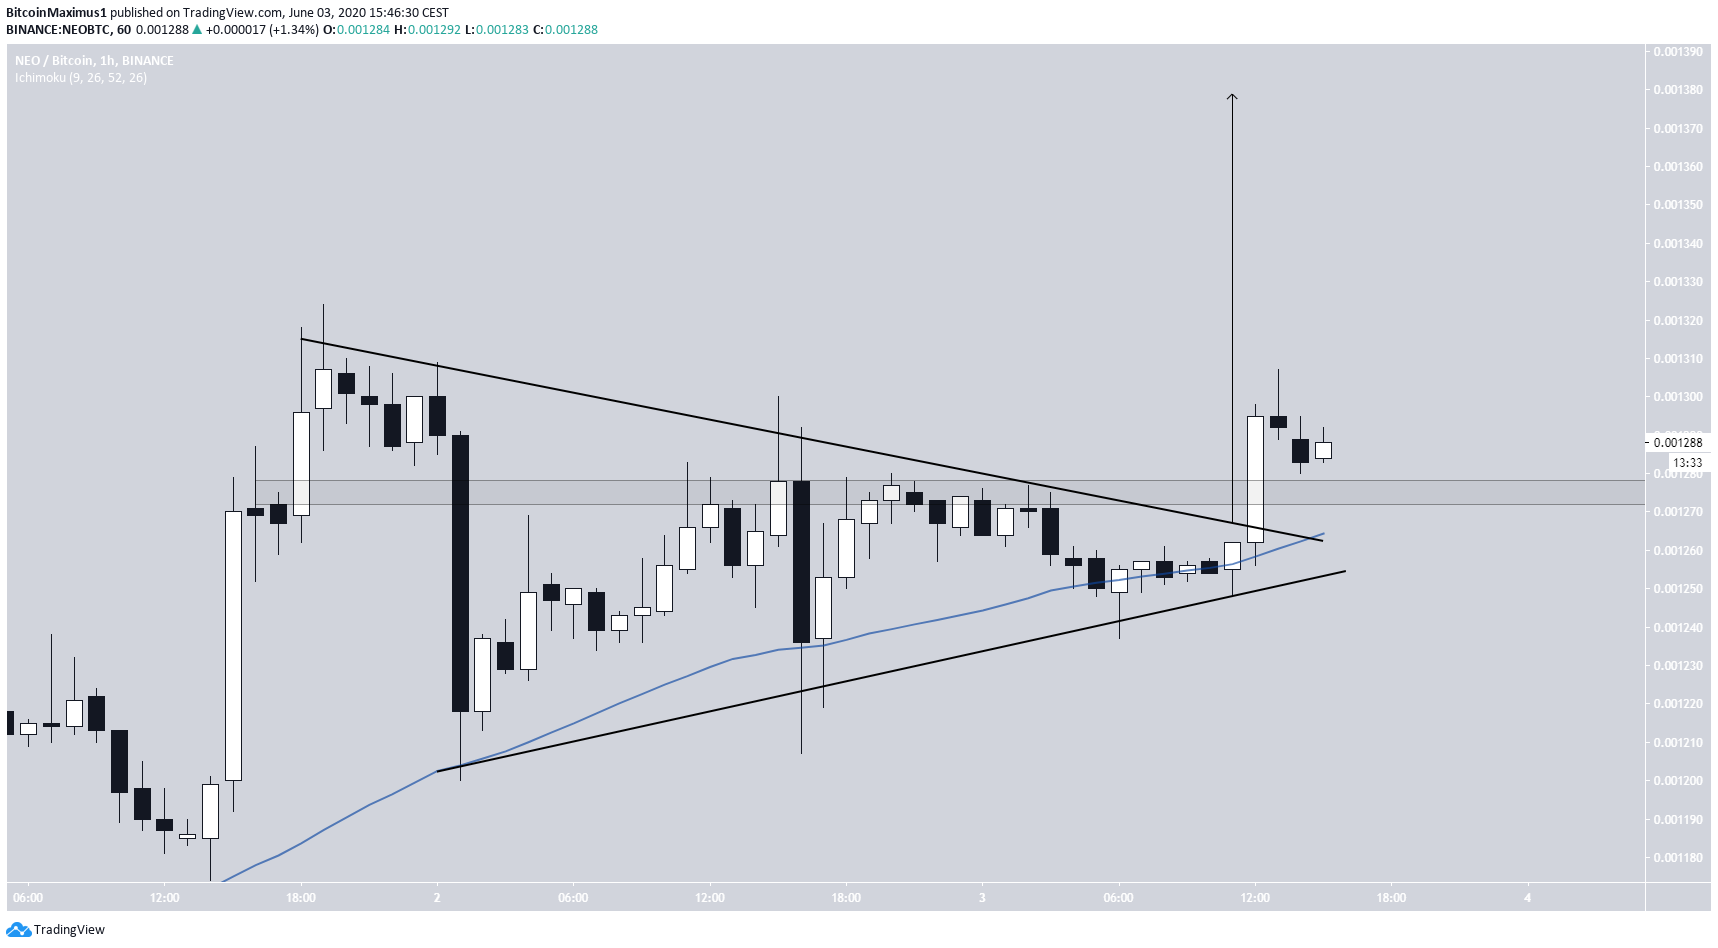
Indeed, NEO has pierced the upper bound and is holding above the ₿0.001275 support area. If the price travels the entire height of the pattern it just broke out from, it should climb all the way to ₿0.00138.
During the period NEO traded inside the triangle, it found support above the 50-hour MA. The same MA now coincides with the support mentioned above. As long as the price trades above this support, the trend is considered bullish.
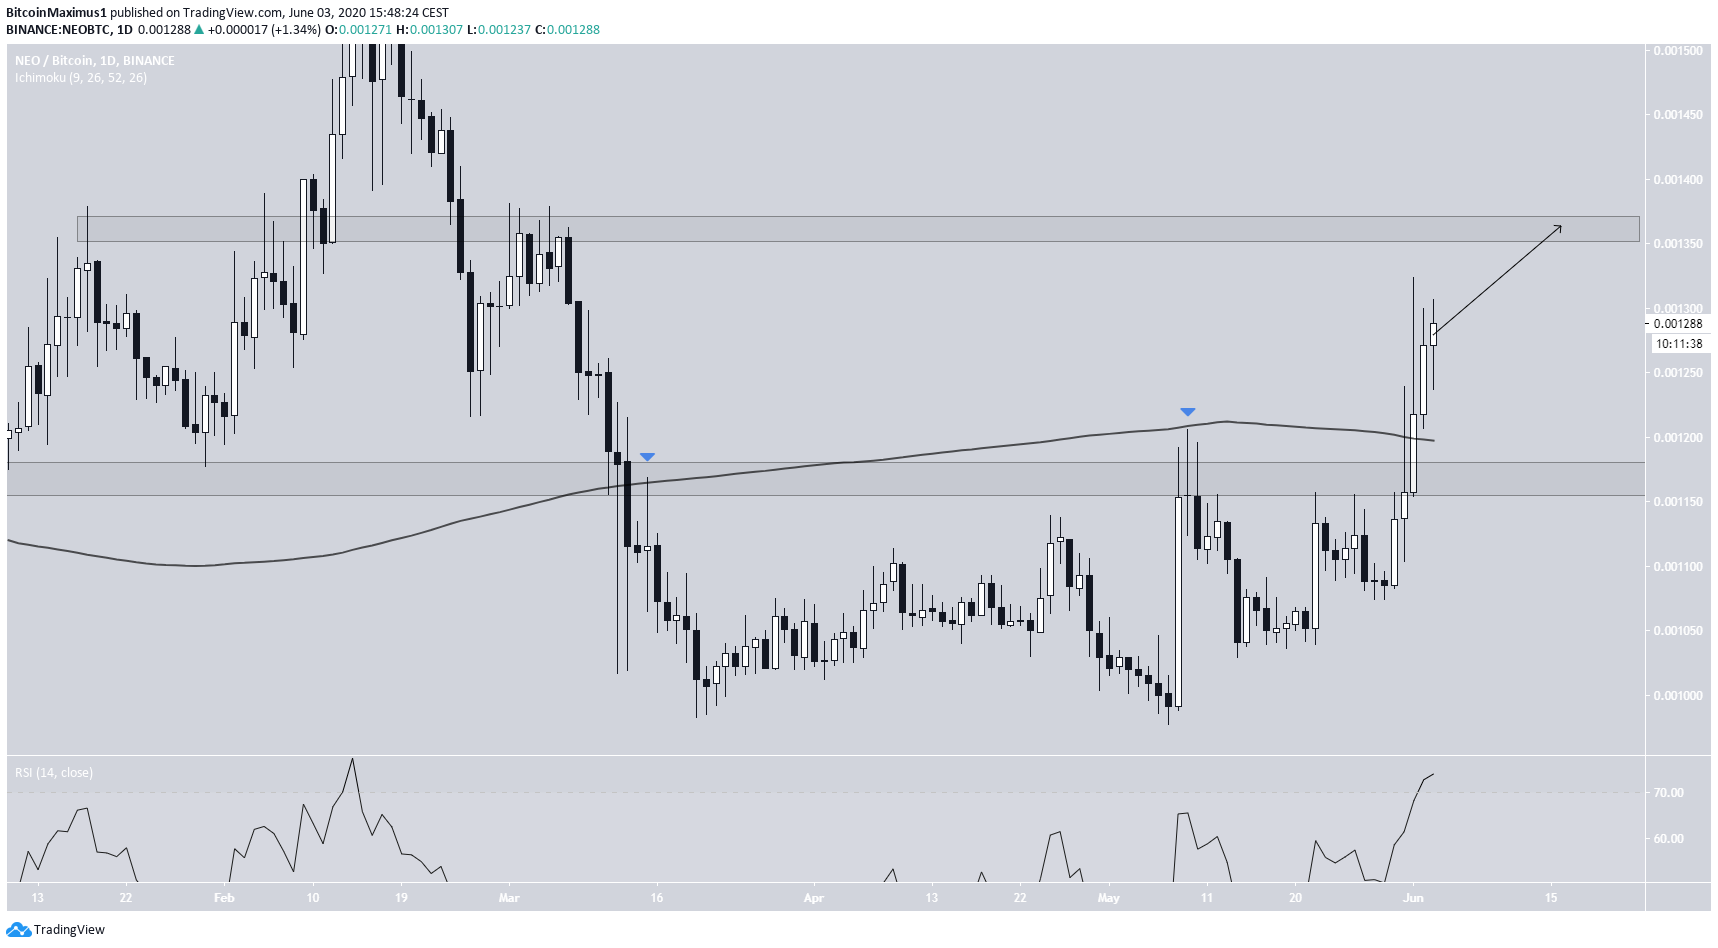
The daily chart supports this upward movement. On July 1, NEO broke out from the ₿0.00117 resistance area and followed up with a breakout above the 200-day MA. The closest resistance area is found at ₿0.00138, fitting with the short-term target.
In addition, the breakout occurred with extremely high volume, and there is no bearish divergence yet on the RSI, even though it is overbought. Therefore, NEO is expected to continue its upward momentum towards the resistance above.
NEO/Dollar
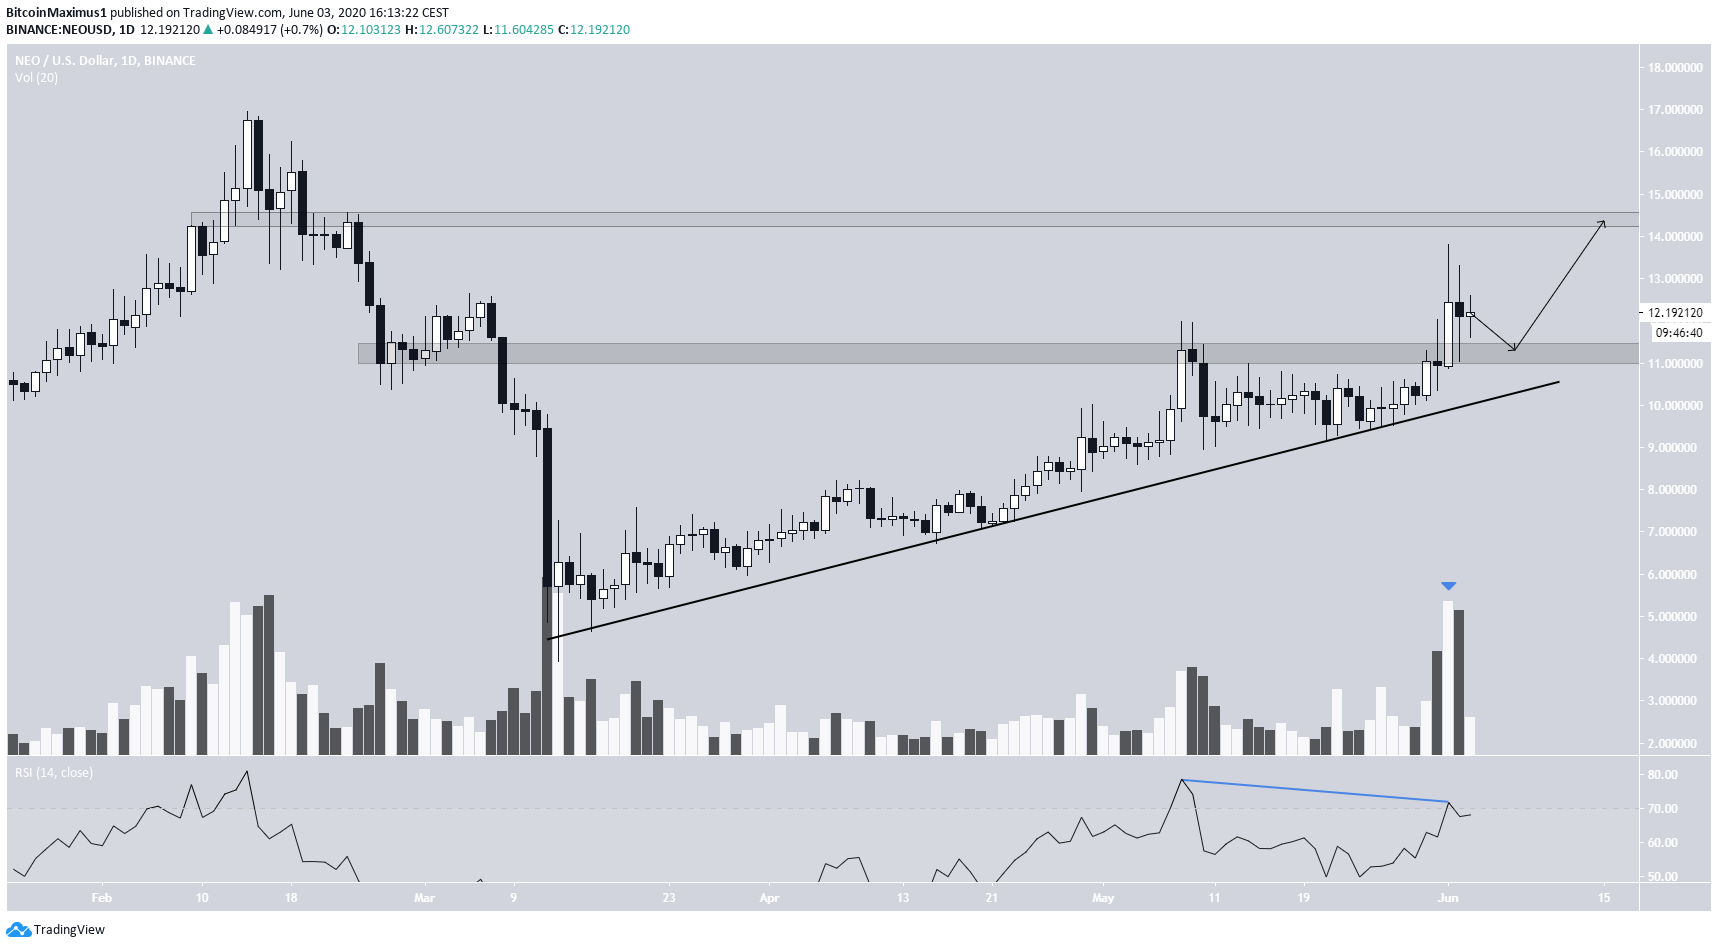
The NEO/USD chart also looks bullish. The price has made higher lows and higher highs alongside an ascending support line since the March 13 bottom. In addition, the price broke out from the $11.2 resistance area with particularly high volume on June 2.
While there is some weakness in the form of bearish divergence on the RSI, this is the only bearish sign against a strong bullish trend.
Therefore, after a possible retest of the $11.2 area, which is now expected to act as support, NEO is likely to rally towards the closest resistance area at $13.4.