


The Binance Coin (BNB) price reached a new all-time high on Dec. 29 and has been moving upwards since. BNB should continue moving upwards towards the targets of $50 and potentially near $70.
BNB Reaches All-Time High
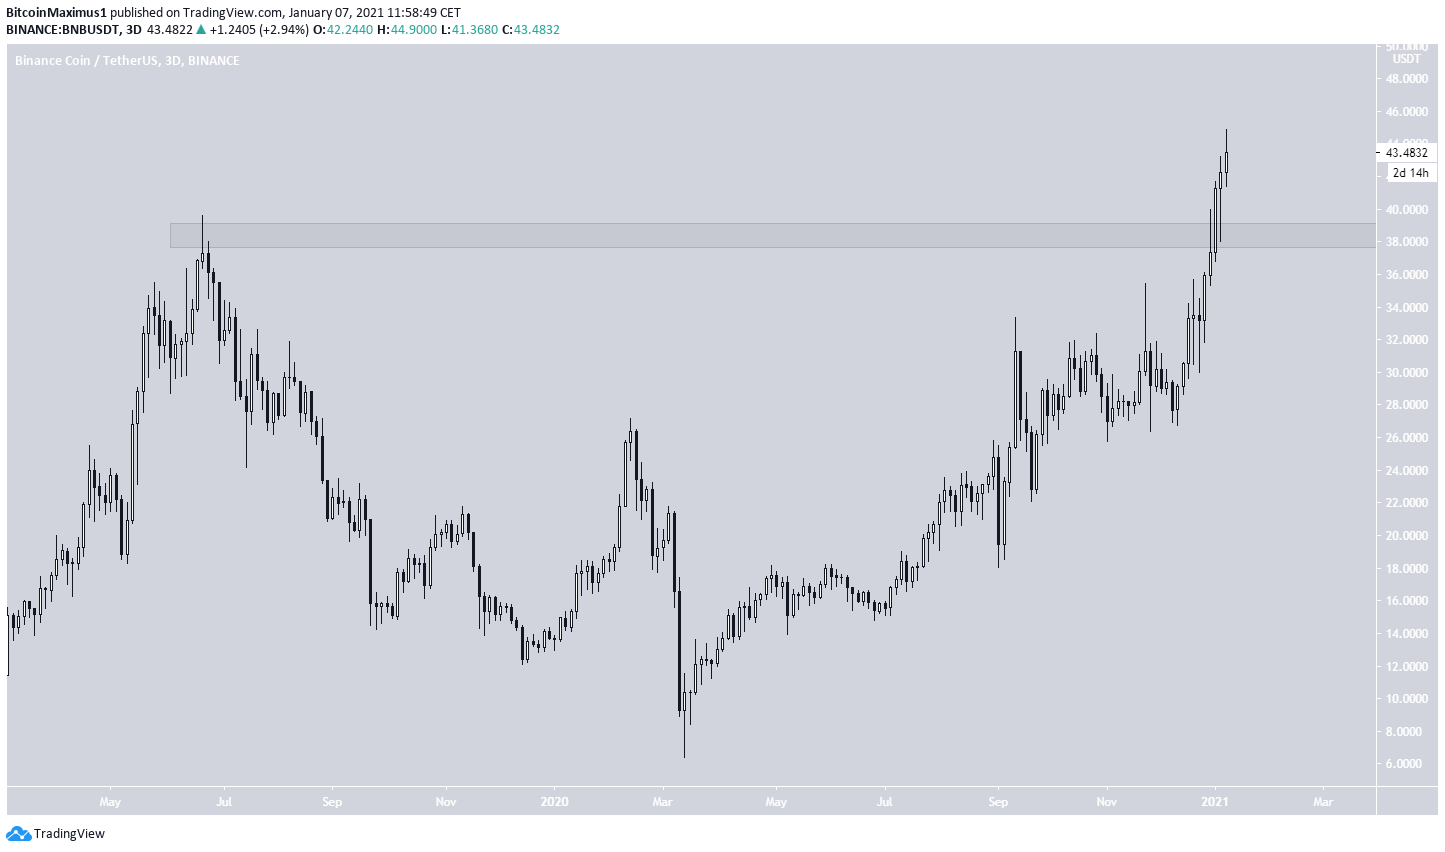
On Jun. 22, BNB reached an all-time high of $39.51. It began a significant downward movement afterward, which lead to a low of $6.38 on Mar. 13. However, it has been moving upwards since.
On Dec. 29, it reached a new all-time high and has been increasing, reaching a high of $44.90 to date.
The previous resistance area at $39 is now likely to act as support.
Future Movement
Cryptocurrency trader @Tradingtank outlined a BNB chart, stating that it’s likely to increase. They gave targets of $46 and $52.
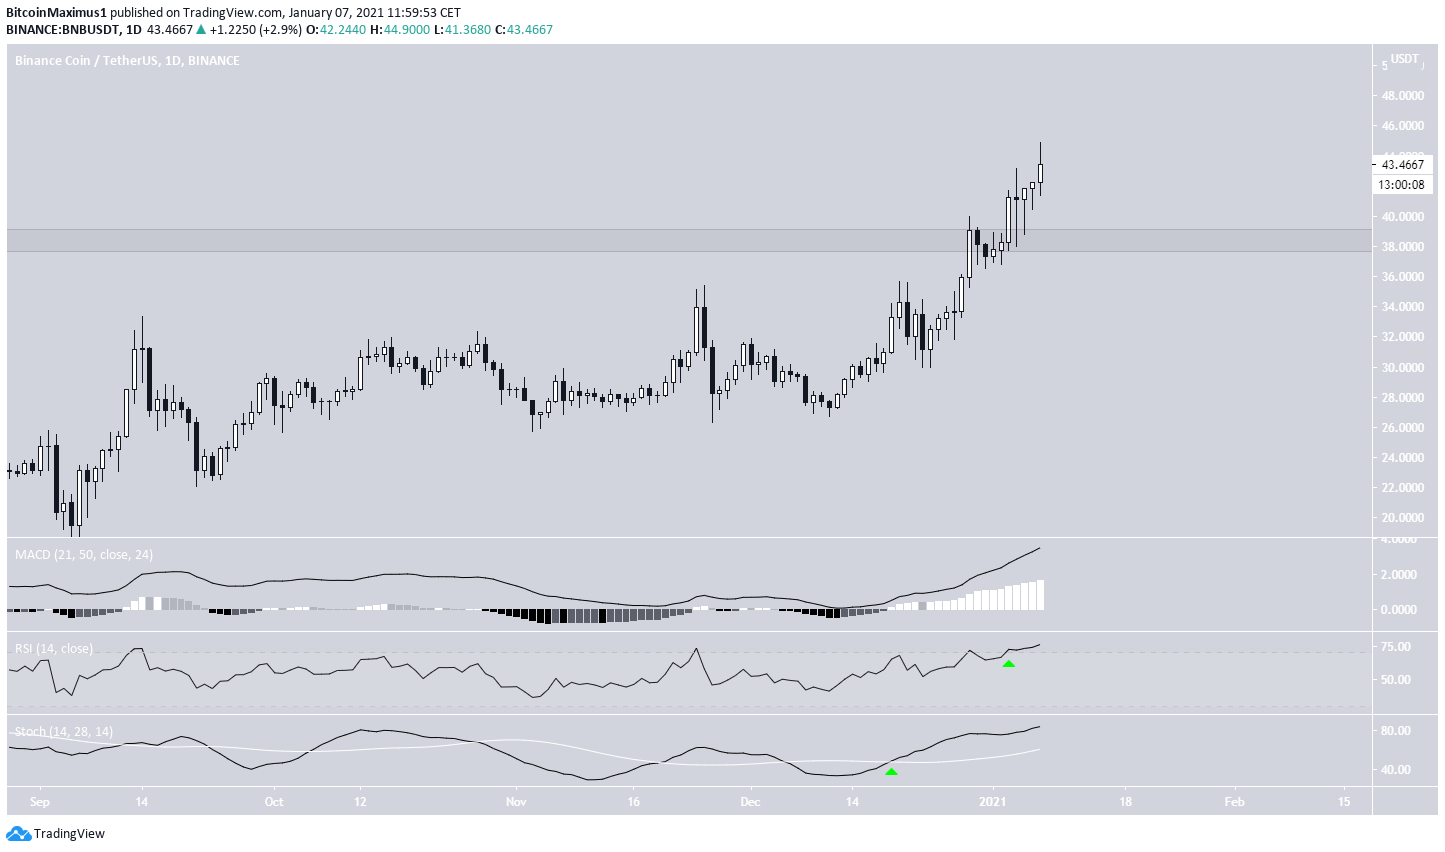
Technical indicators on the daily time-frame are bullish, supporting the continuation of an upward move, even though the rally is overextended.
However, since BNB is trading at an all-time high and there are no resistance levels above the current price, we need to use a fib extension to determine future targets.
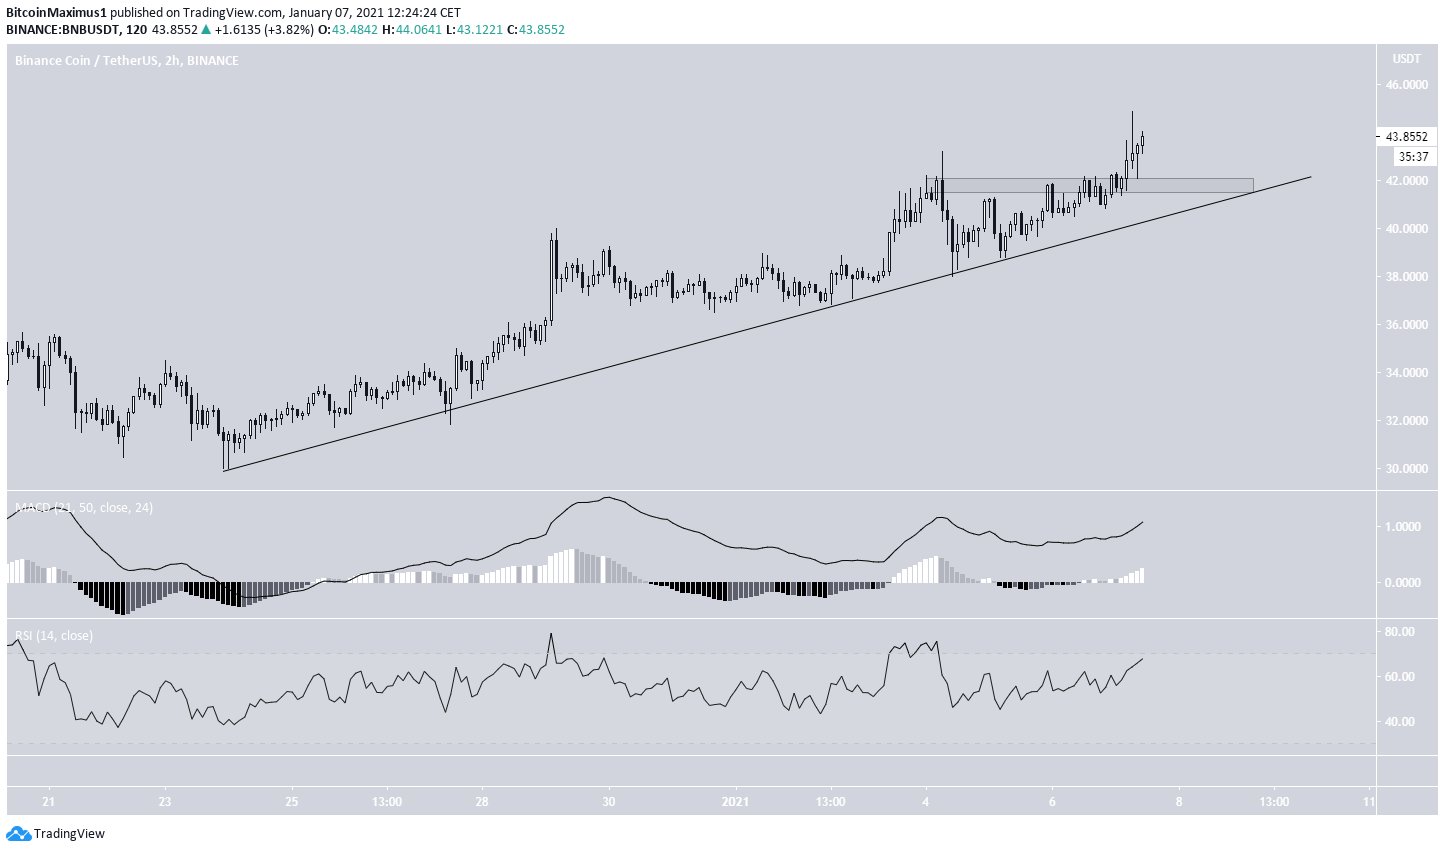
Furthermore, the two-hour chart shows that BNB is also following an ascending support line, which coincides with the minor $42 support area. As long as BNB is trading above this level, the trend is bullish.
Similar to the daily time-frame, indicators on the two-hour time-frame are also bullish.
Wave Count
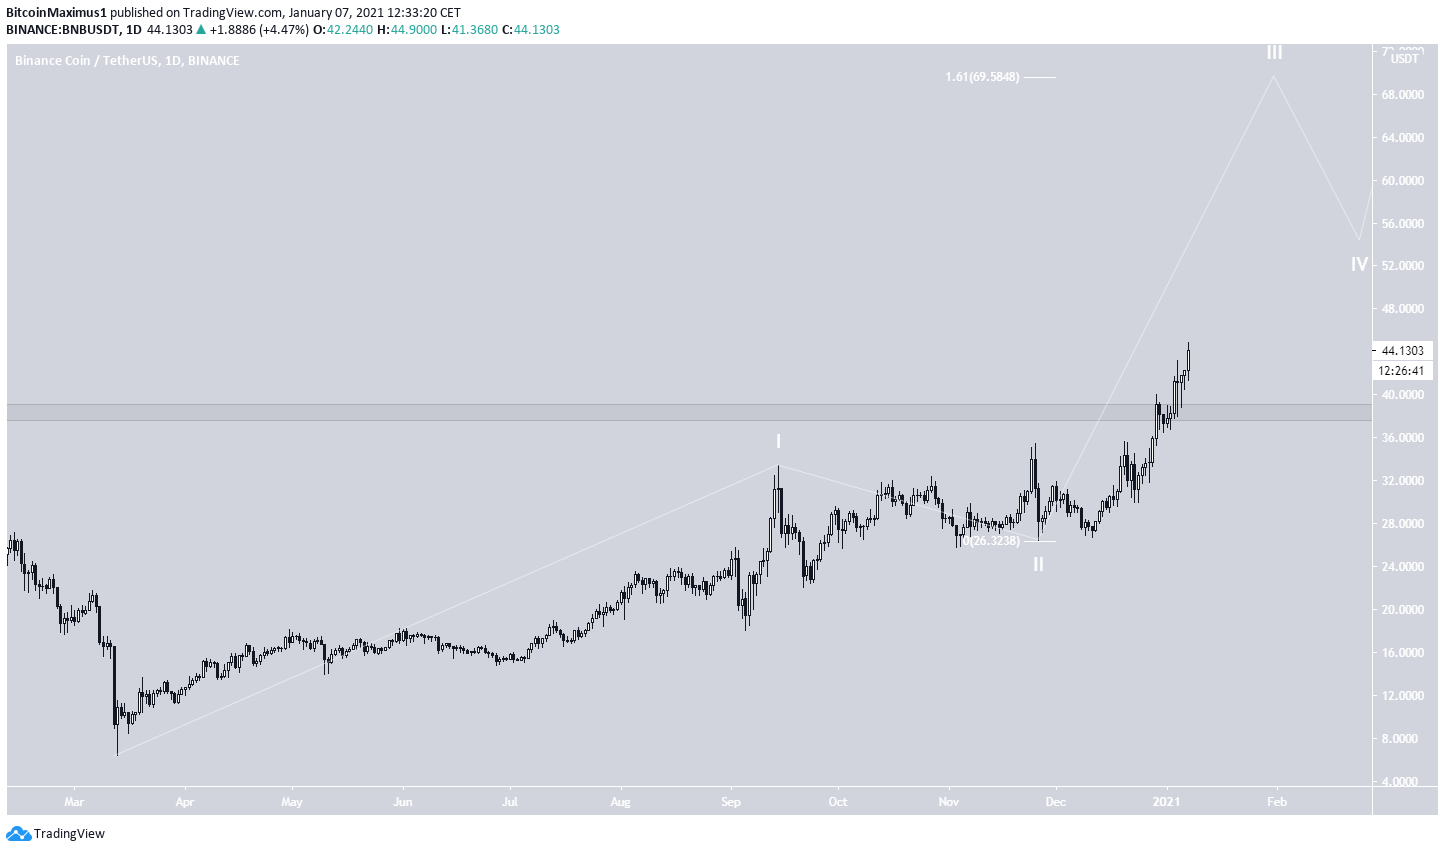
The wave count suggests that BNB is probably in wave 3 of a long-term bullish impulse (shown in white below), which began in March.
A possible target for the top of the entire move is at $69.58, which would give waves 1:3 a 1:1.61 ratio, common in bullish impulses.
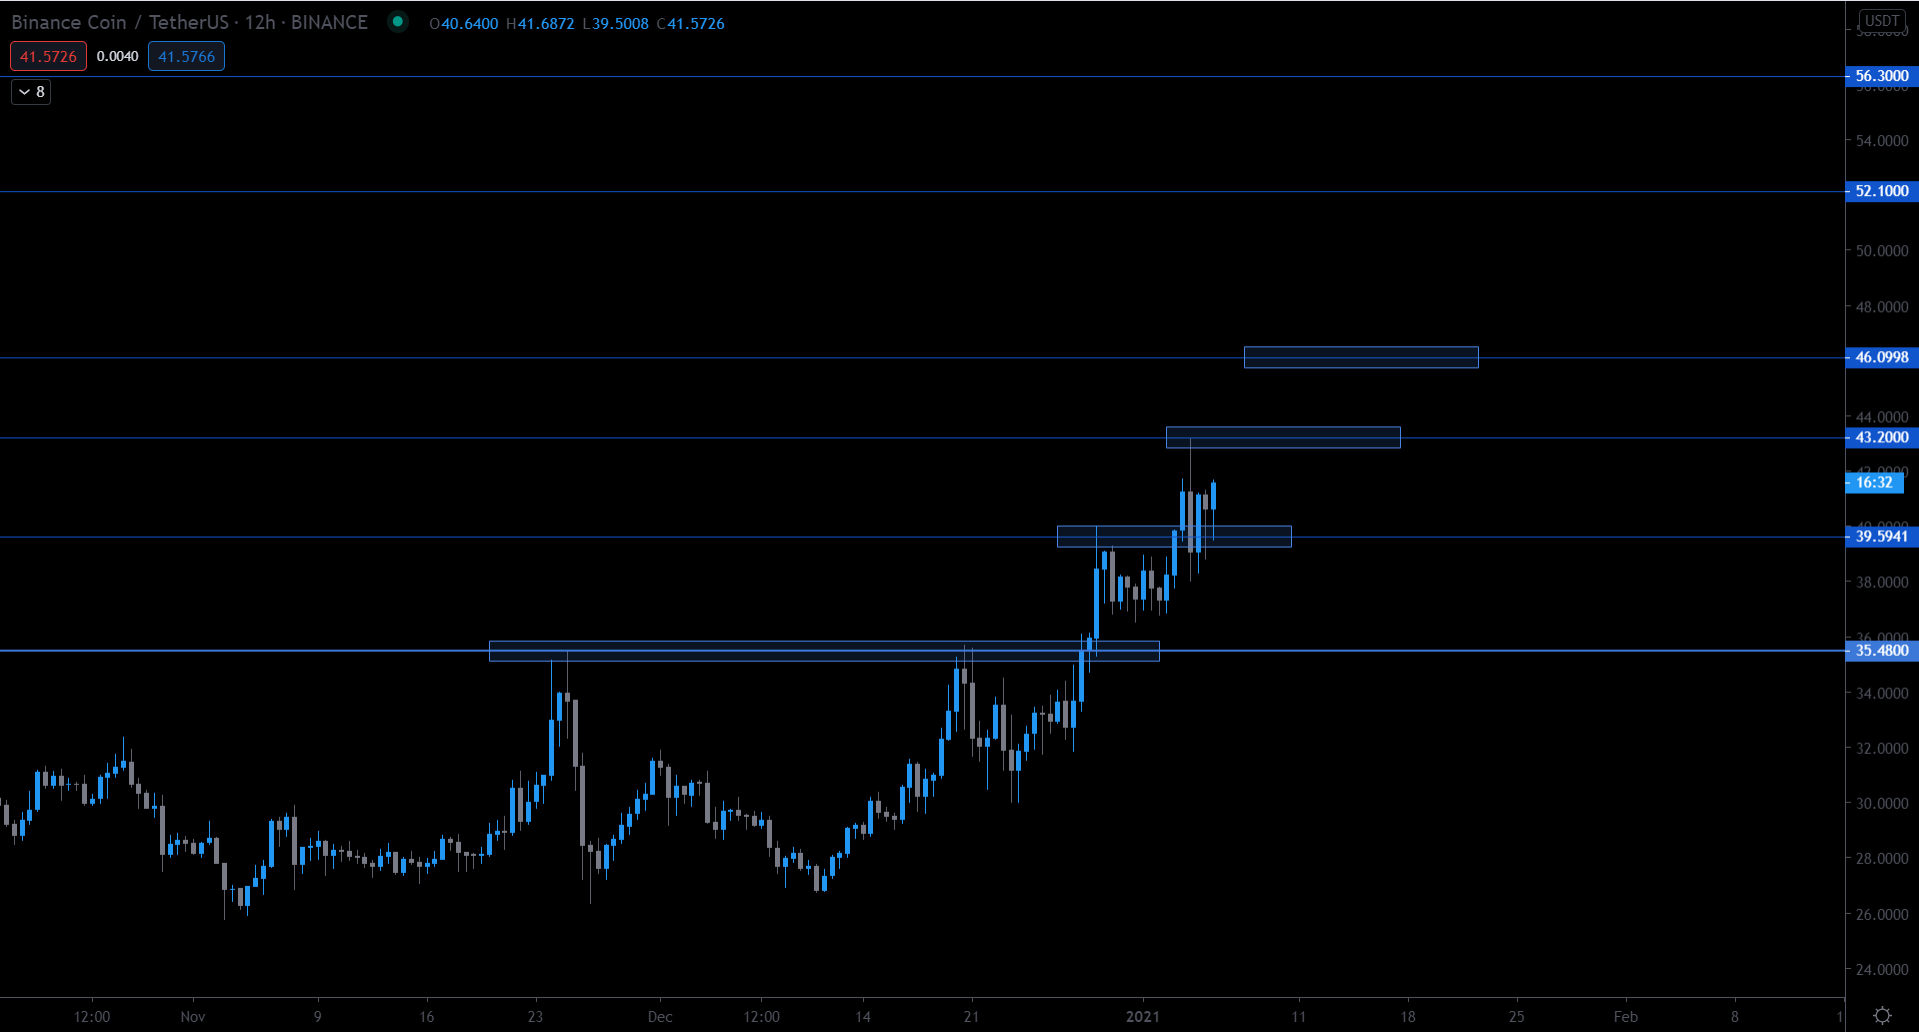
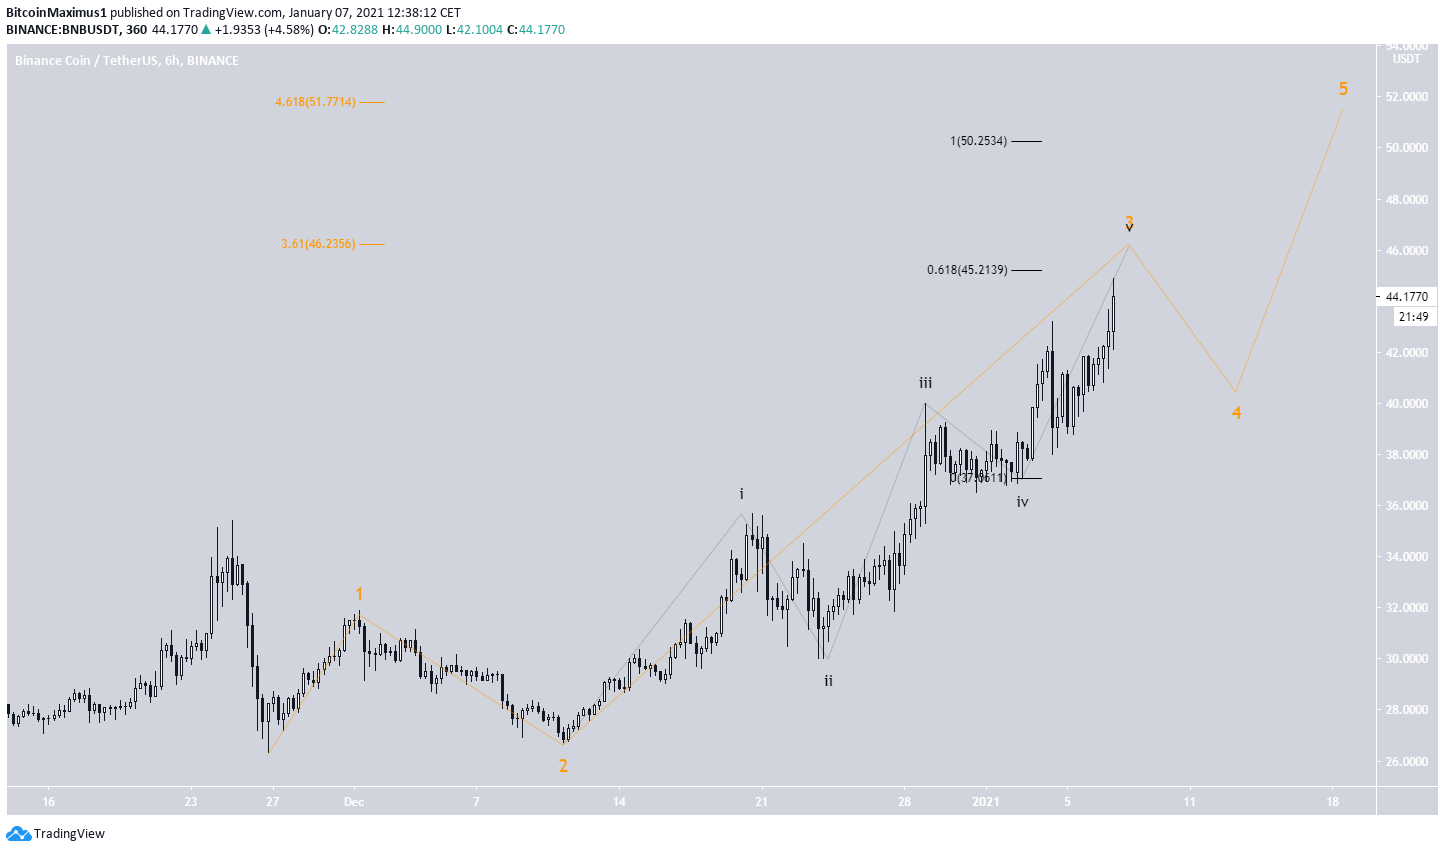
The short-term chart shows that BNB is likely nearing the top of sub-wave 3 (shown in orange), while the minor sub-wave count is given in black.
The most likely targets for the top of sub-wave 3 are at $46 and $50-$51, found using a combination of fib extensions (orange) and projections (black).
Conclusion
To conclude, as long as BNB is trading above its short-term ascending support line, it should continue rallying towards $50 and possibly $70.
For BeInCrypto’s latest Bitcoin (BTC) analysis, click here!
Disclaimer: Cryptocurrency trading carries a high level of risk and may not be suitable for all investors. The views expressed in this article do not reflect those of BeInCrypto.


