


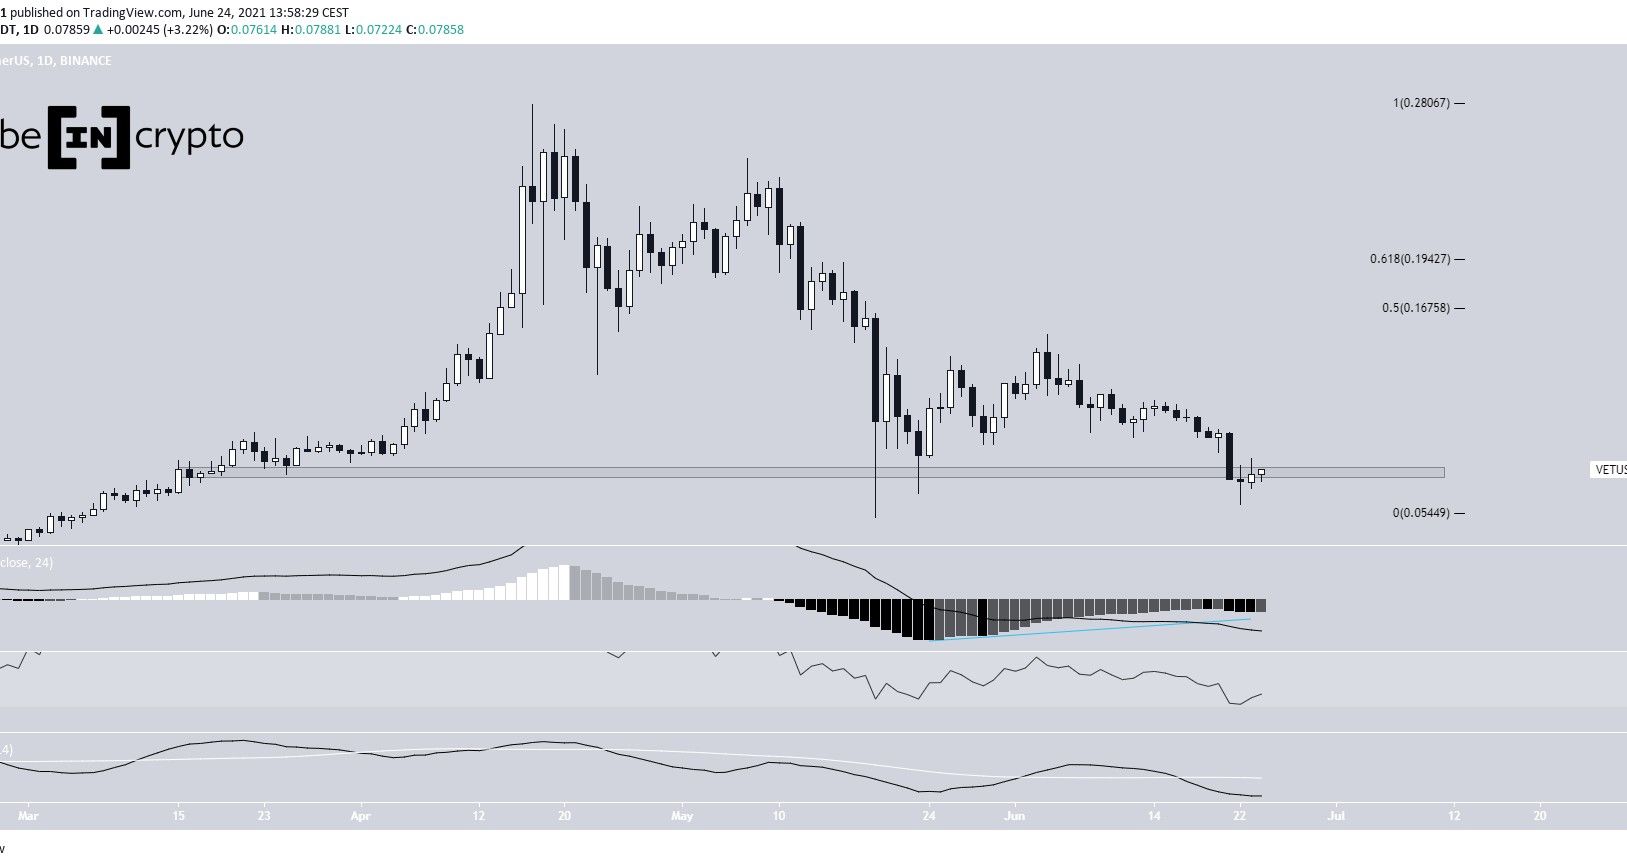
VeChain (VET) has returned to the $0.076 horizontal support area, potentially creating a double bottom pattern.
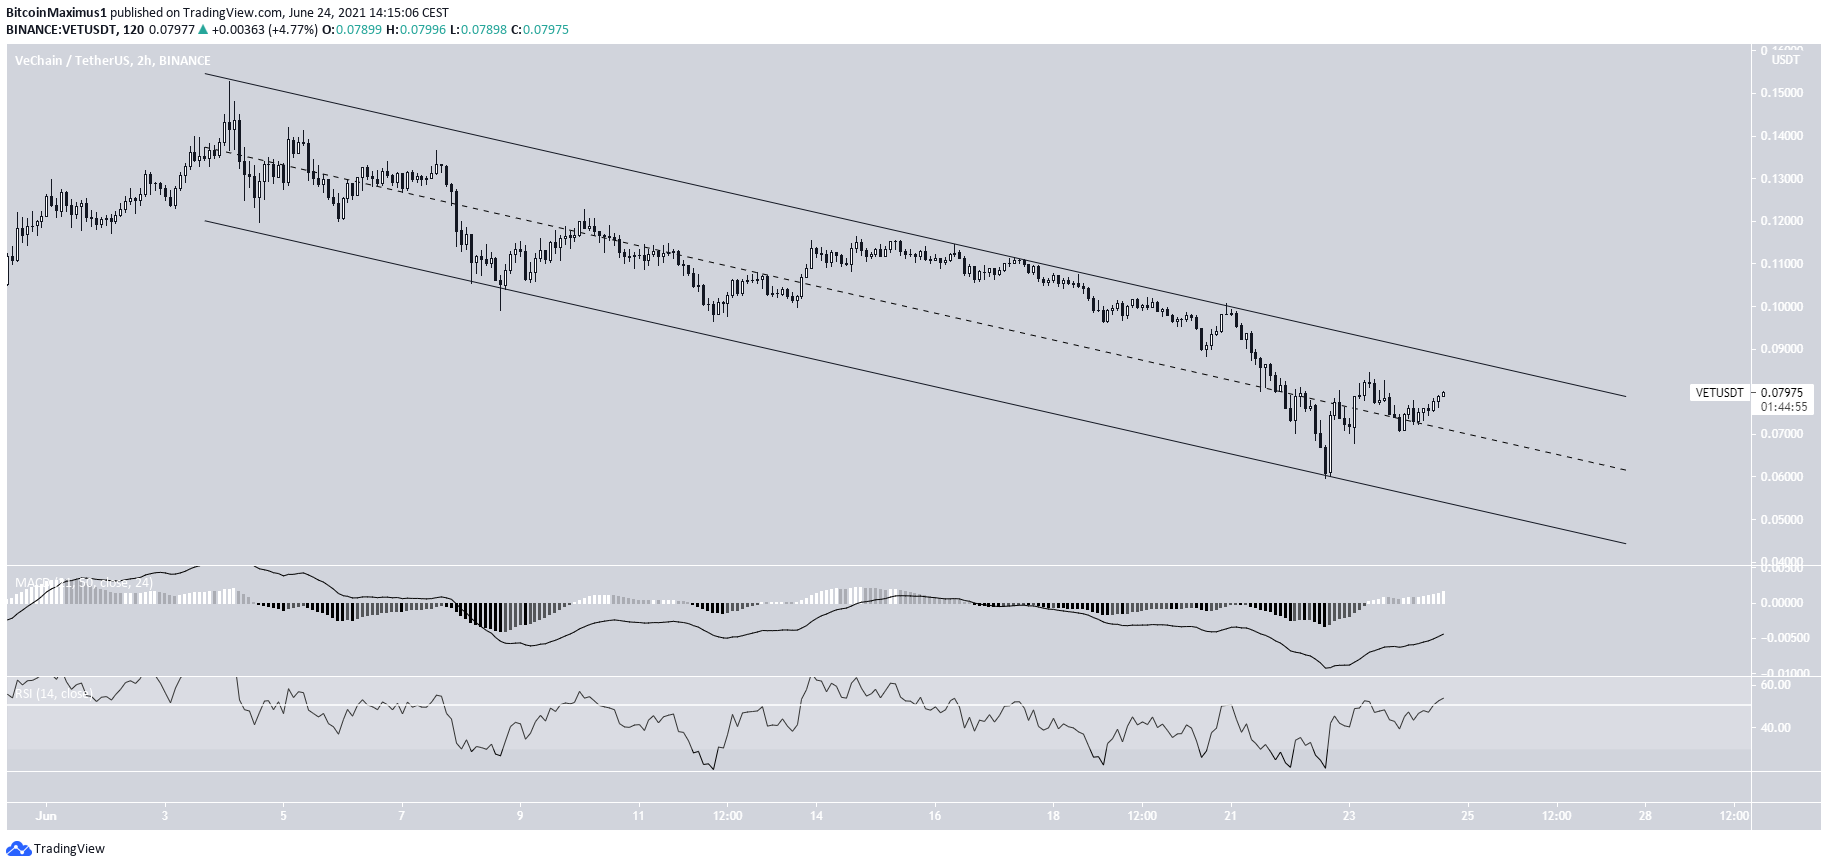
VET is trading inside a short-term descending parallel channel, a breakout from which would confirm the double bottom pattern.
Ongoing VET decrease
VET has been falling since reaching an all-time high price of $0.279 on April 17. On May 19, it reached a low of $0.052 and bounced. The bounce validated the $0.076 level as support.
On June 23, the token returned to the same support area, potentially creating a double top pattern.
However, technical indicators are still bearish. While the MACD histogram has generated bullish divergence, it is still negative. In addition, the RSI & Stochastic oscillator are both decreasing.
If an upward move transpires, the closest resistance levels would be at $0.167-$0.194, the 0.5-0.618 Fib retracement resistance levels.
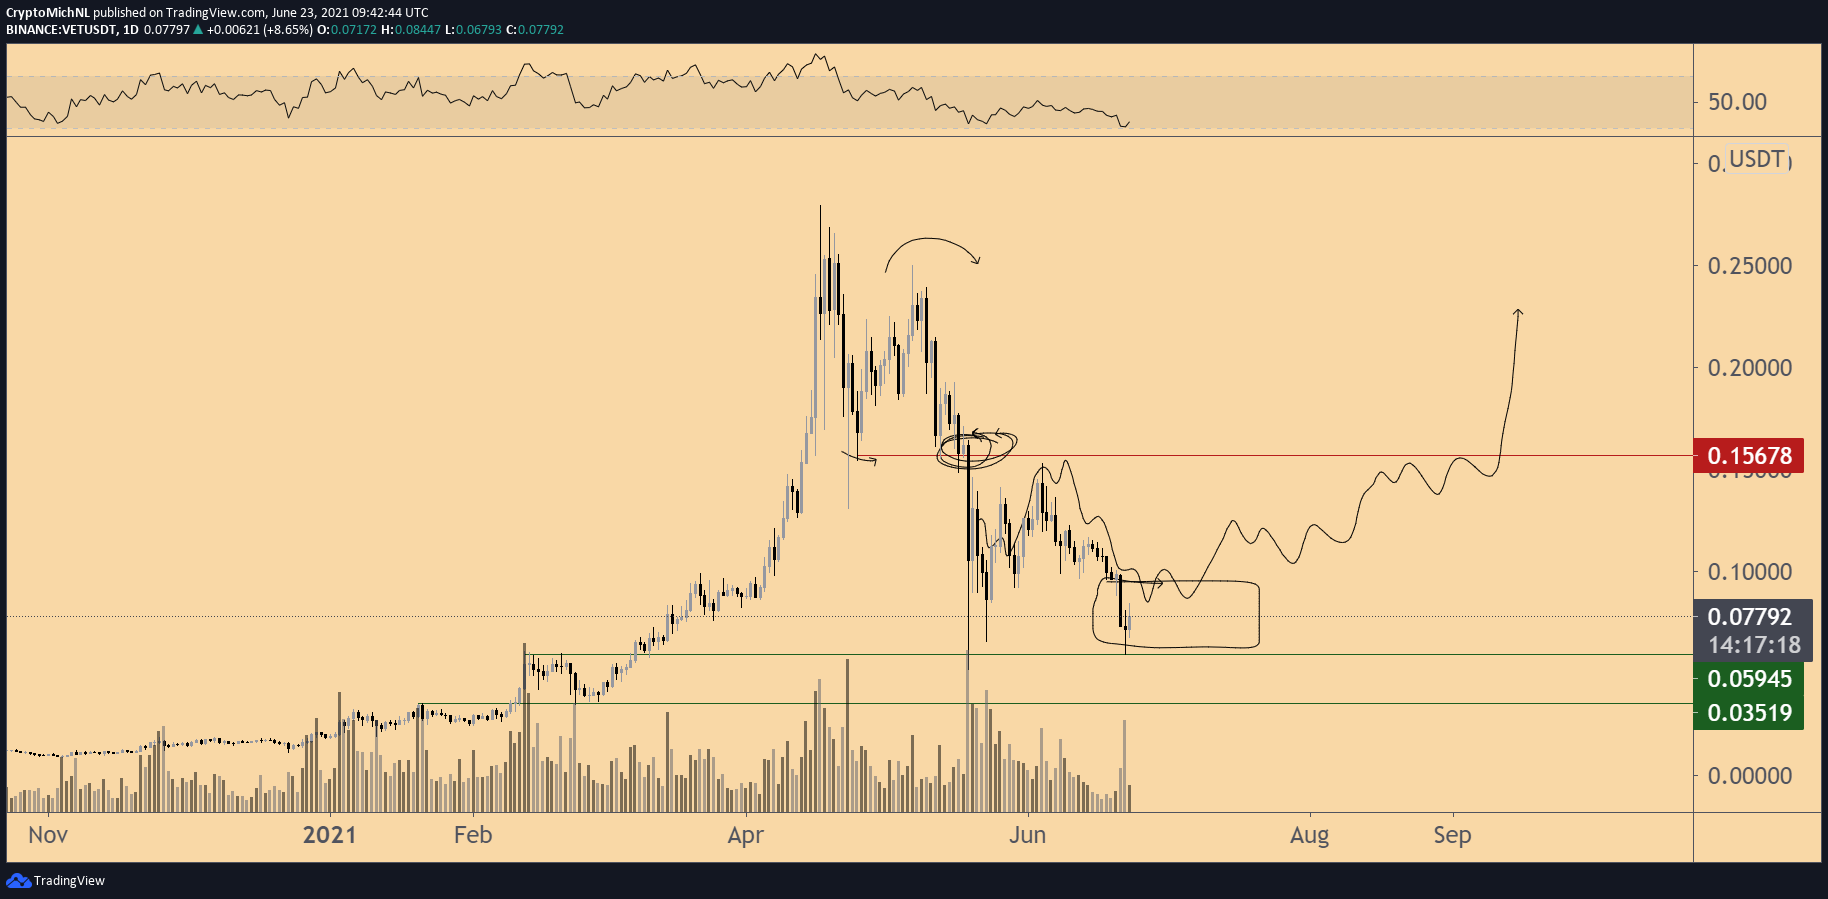
Cryptocurrency trader @CryptoMichNL outlined a VET chart, stating that the current bounce could lead to significantly higher prices. If the pattern plays out, the upward movement could indeed transpire.
Short-term channel
The shorter-term two-hour chart shows that VET is trading inside a descending parallel channel. This structure usually contains corrective movements.
In addition, both the MACD & RSI are increasing. The former is positive while the latter is above 50.
A breakout from the channel would go a long way in confirming the possibility of the longer-term double bottom pattern.
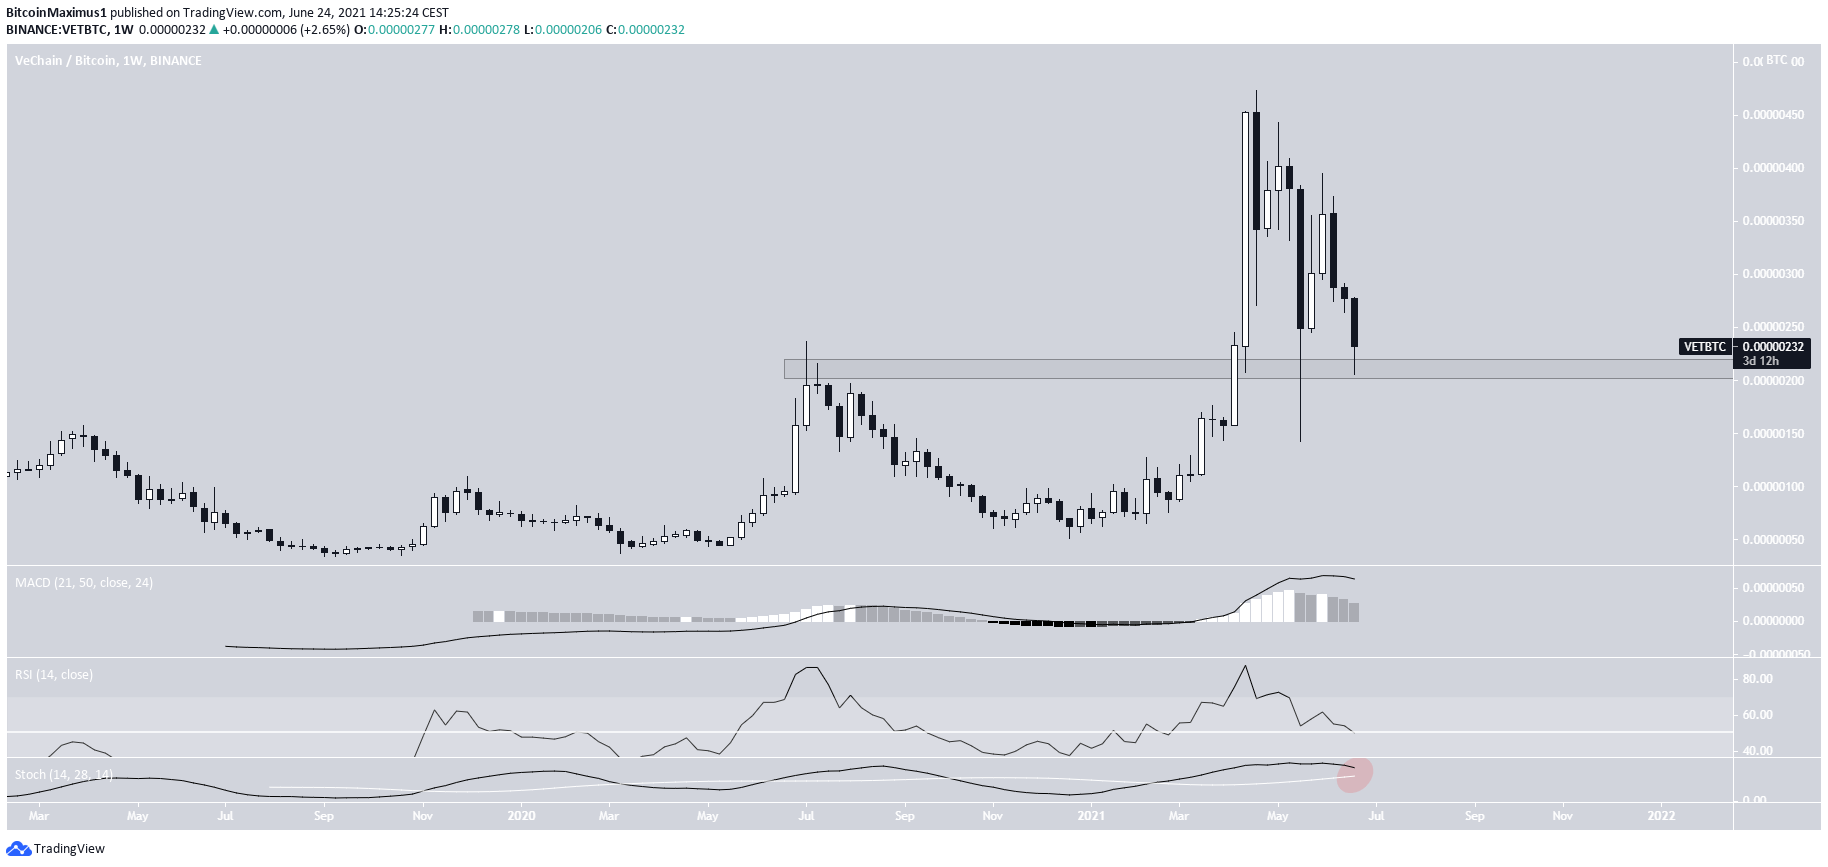
VET/BTC
VET/BTC has also been moving downwards since April. However, it is trading above the 215 satoshi support area.
The area is crucial, since it previously acted as the top in July 2020. As long as the token is trading above this level, the trend can be considered bullish.
However, despite the bullish price action, technical indicators are bearish. The RSI has just fallen below 50, the Stochastic oscillator is close to making a bearish cross and the MACD is decreasing.
For BeInCrypto’s latest bitcoin (BTC) analysis, click here.


