


The VeChain (VET) price has regained the majority of its losses from the Nov. 26 decrease and is currently gearing up for another attempt at the closest resistance area.
Despite the corrective short-term pattern that VeChain has been trading in, technical indicators are bullish and support the possibility that the upward movement will continue.
VeChain Re-Tests Support
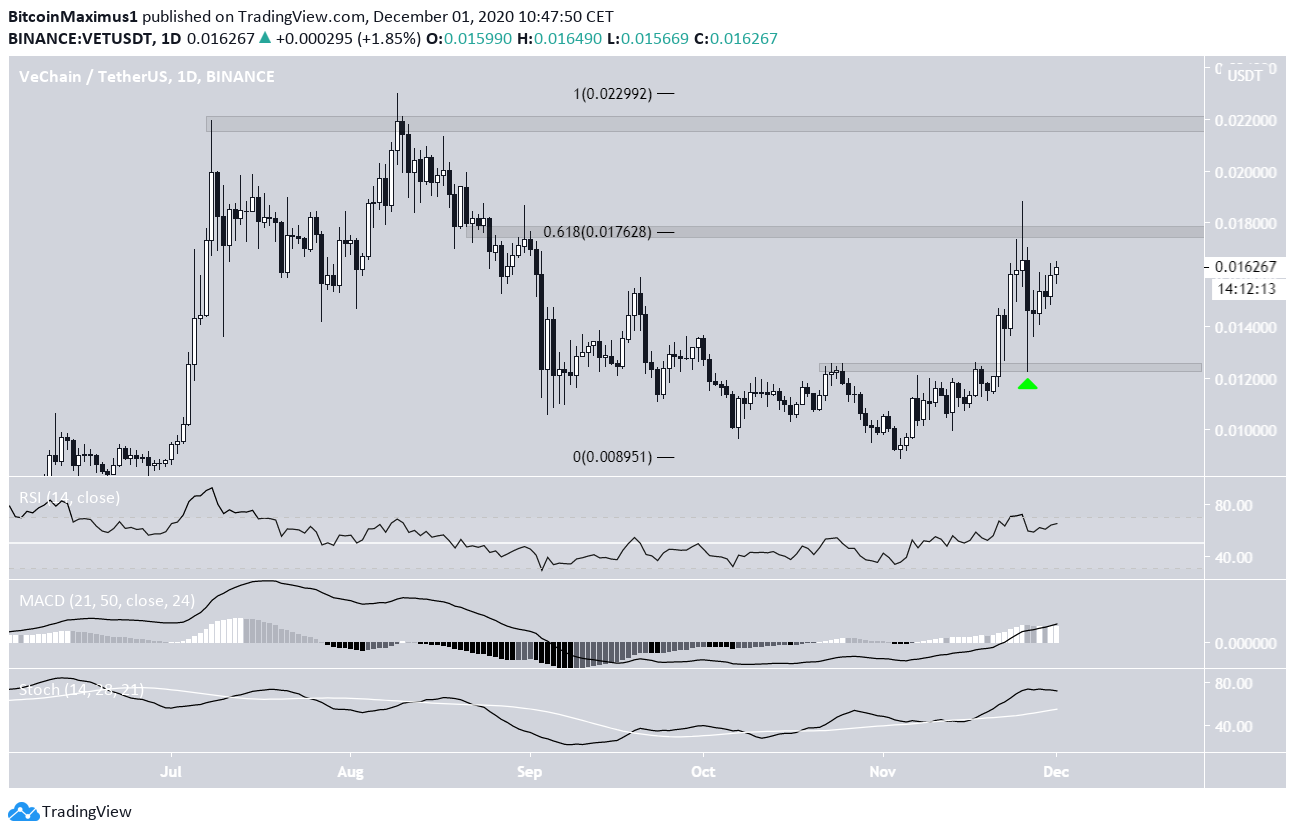
The VET price has been moving upwards since Nov. 5, when the price reached a low of $0.0091. The increase has been swift, culminating with a high of $0.0188 on Nov. 25 before getting rejected by the 0.618 Fib retracement level and dropping sharply the next day.
However, the decrease only served to validate the $0.0125 support area in the form of a long lower wick, and the price has been moving upwards since. Because of this, it seems likely that VET will make another attempt at overtaking the 0.618 Fib resistance at $0.0176.
Technical indicators are bullish and support the continuation of the upward move. If the price were to break out above the current resistance area, the next would be found at $0.022 — the range highs from July and August.
Short-Term Movement
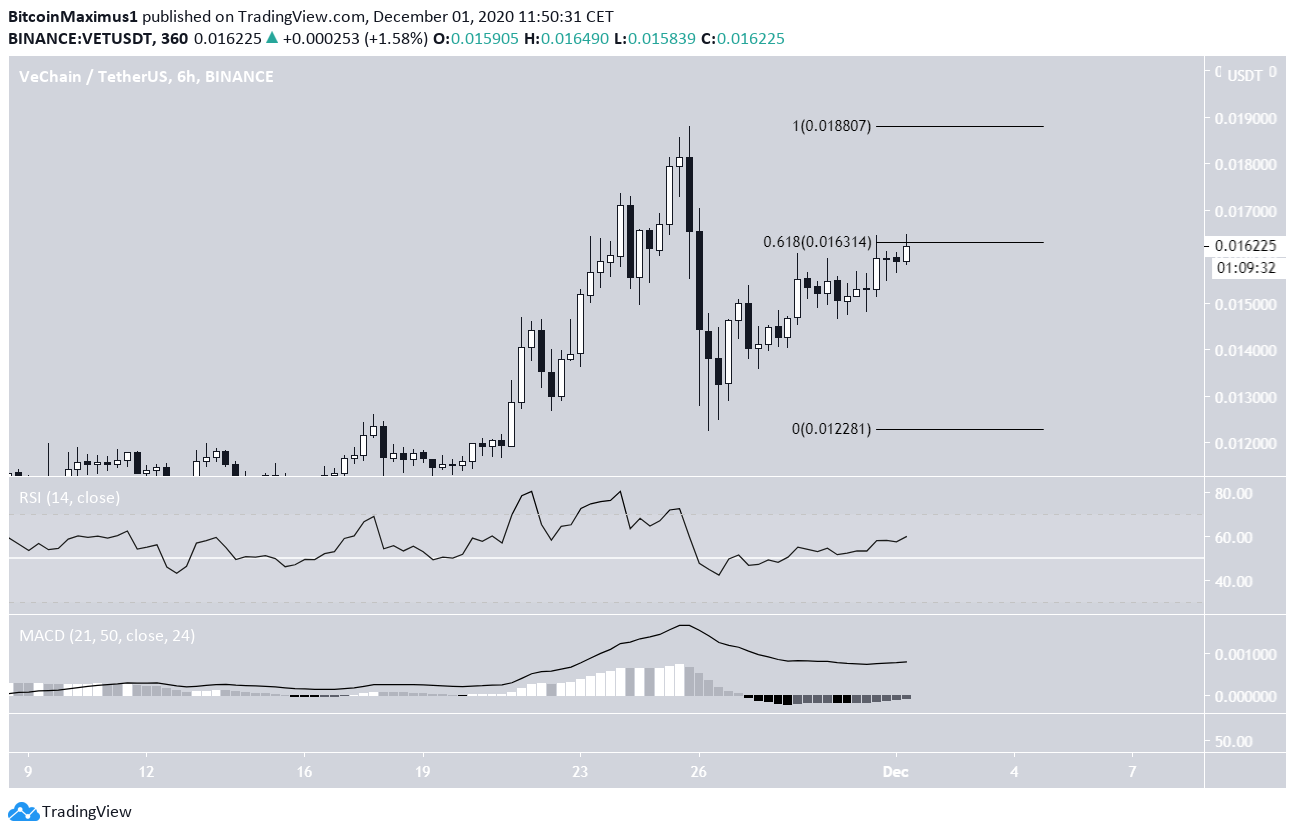
The six-hour chart shows that despite the bounce, VET is still trading at the 0.618 Fib retracement level, which is commonplace for corrections to end.
Therefore, if the current increase is just a retracement rather than a new upward movement, we would expect the price to reach a top soon.
However, similar to the daily time-frame, technical indicators are bullish, suggesting that the price is likely to break out.
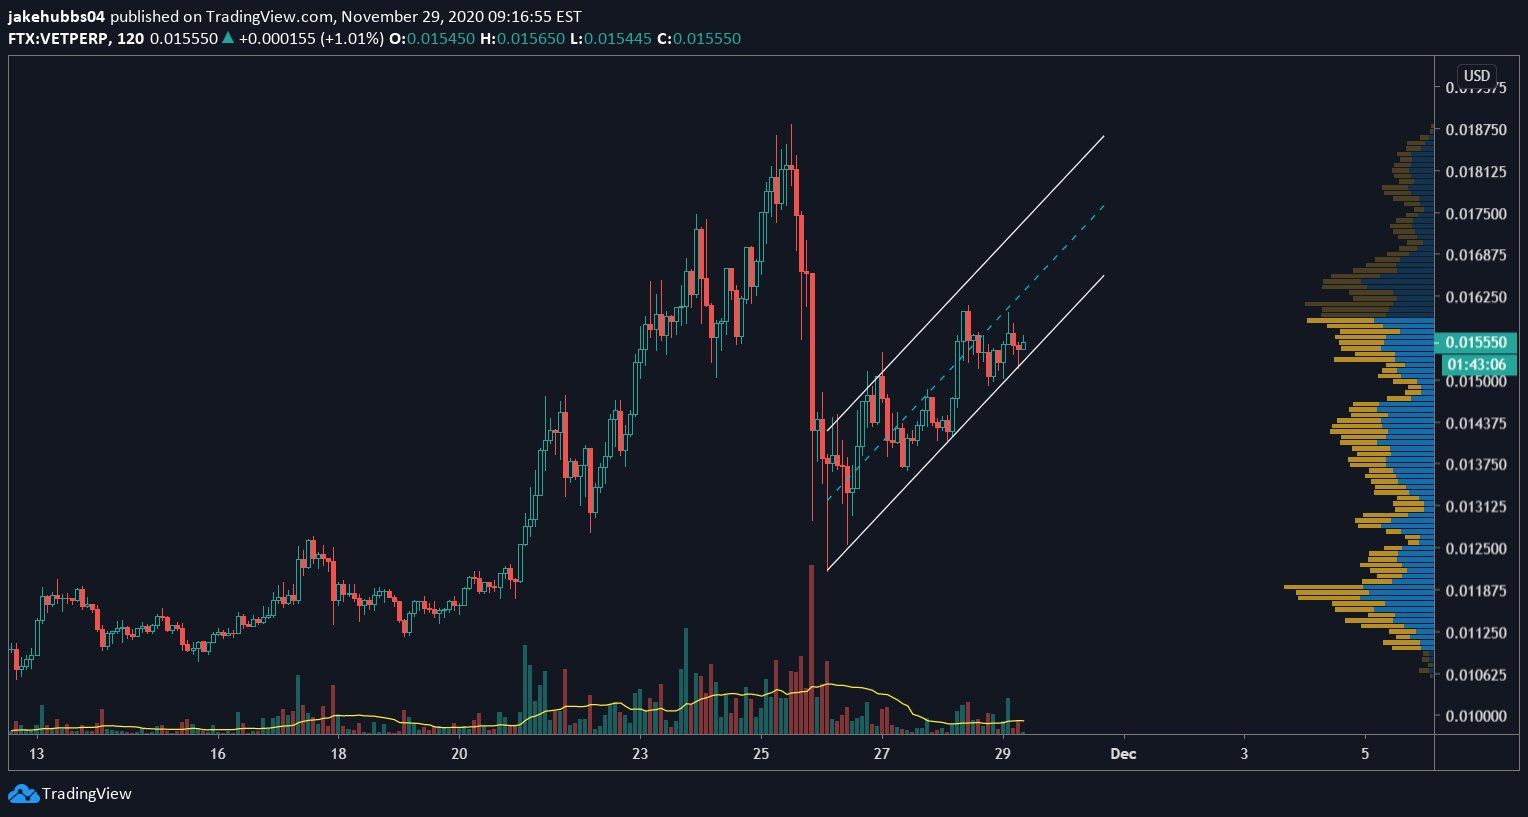
Cryptocurrency trader @Thetradinghubb outlined a VET chart which shows the same increase as outlined above. However, he stated that VET is channeling, thus the movement is likely corrective.
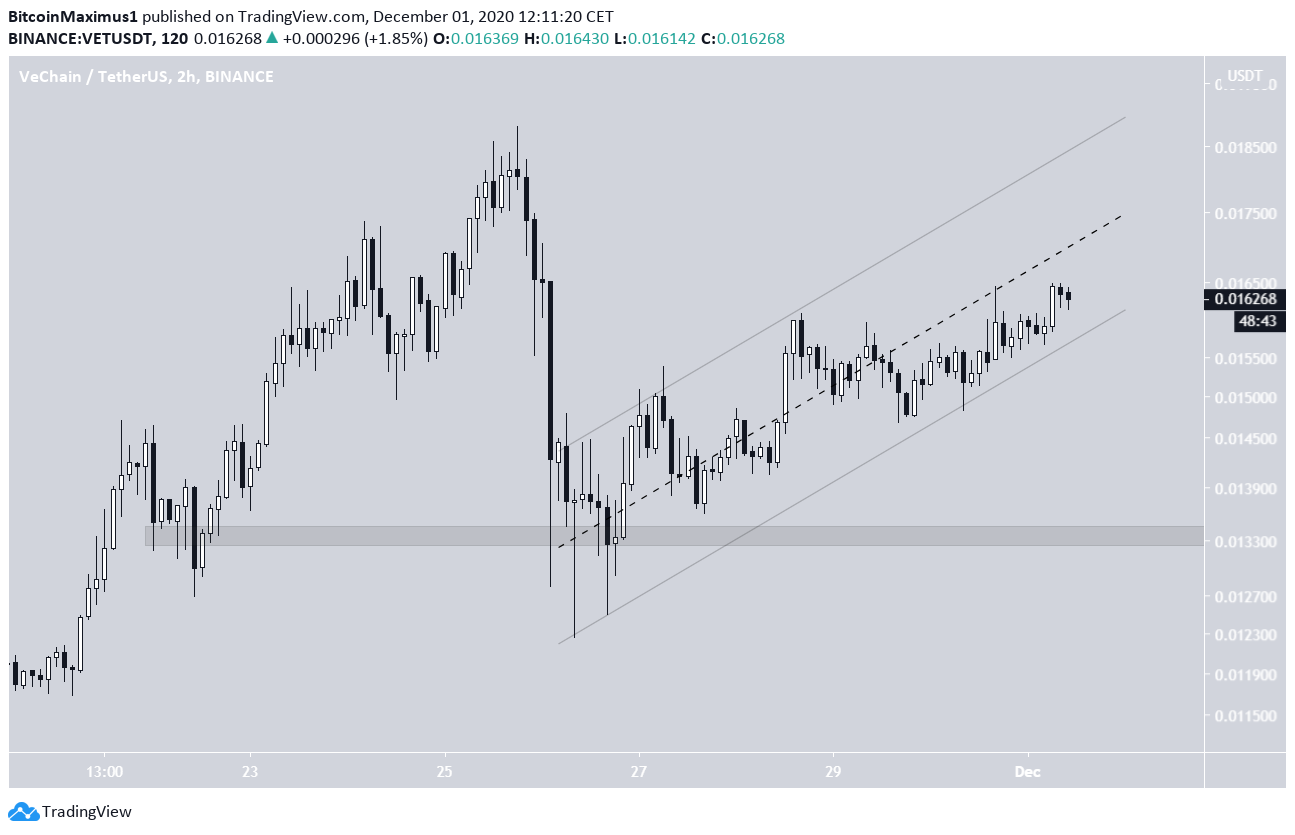
The two-hour chart shows that the price is indeed trading inside the lower portion of a parallel ascending channel, a movement that is often corrective. A breakdown from the channel could cause a drop to $0.0133.
Besides the channel, there are no other signs that point to the increase being corrective. So, unless VET closes below the support line of the channel, the price is expected to move upwards towards the resistance area at $0.0176.
For BeInCrypto’s latest Bitcoin analysis, click here!
Disclaimer: Cryptocurrency trading carries a high level of risk and may not be suitable for all investors. The views expressed in this article do not reflect those of BeInCrypto


