


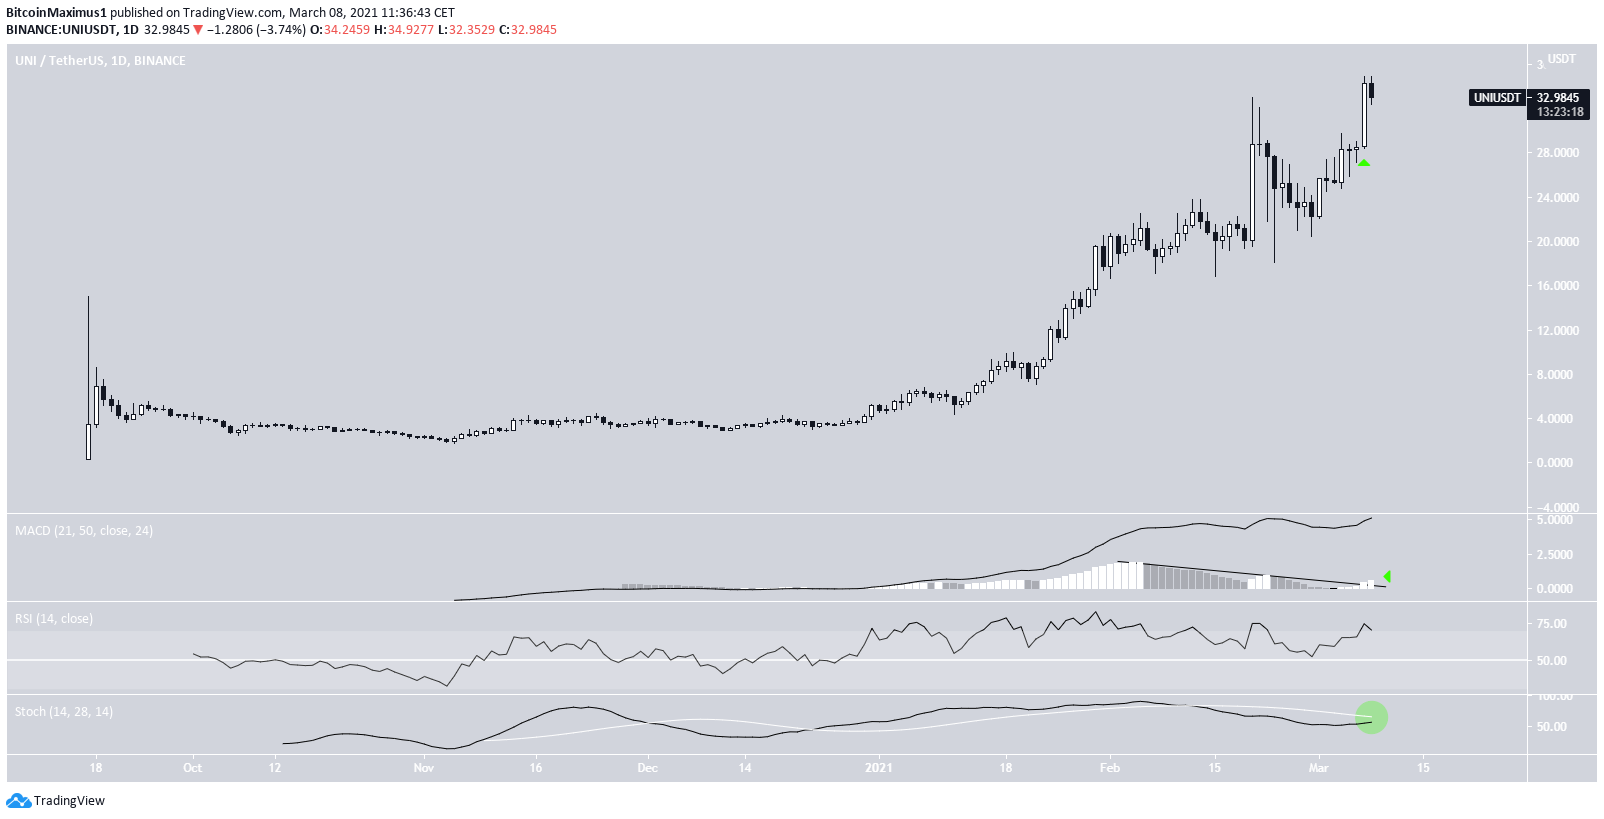
Uniswap Token (UNI) reached an all-time high price of $34.92 on March 8, 2021.
Since it successfully completed a support retest, UNI is expected to continue increasing towards higher levels.
UNI Celebrates All-Time High
UNI had been increasing rapidly since the beginning of the year. However, it reached a then all-time high price of $32.99 on Feb. 20 and started to decrease after.
The drop continued for roughly a week, but the token has been moving upwards since then.
The price broke out on March 7, creating a bullish engulfing candlestick, and reached an all-time high price of $34.92 the next day.
The breakout is likely valid since the MACD broke its bearish trendline and the Stochastic oscillator is close to making a bullish cross.
UNI Trajectory
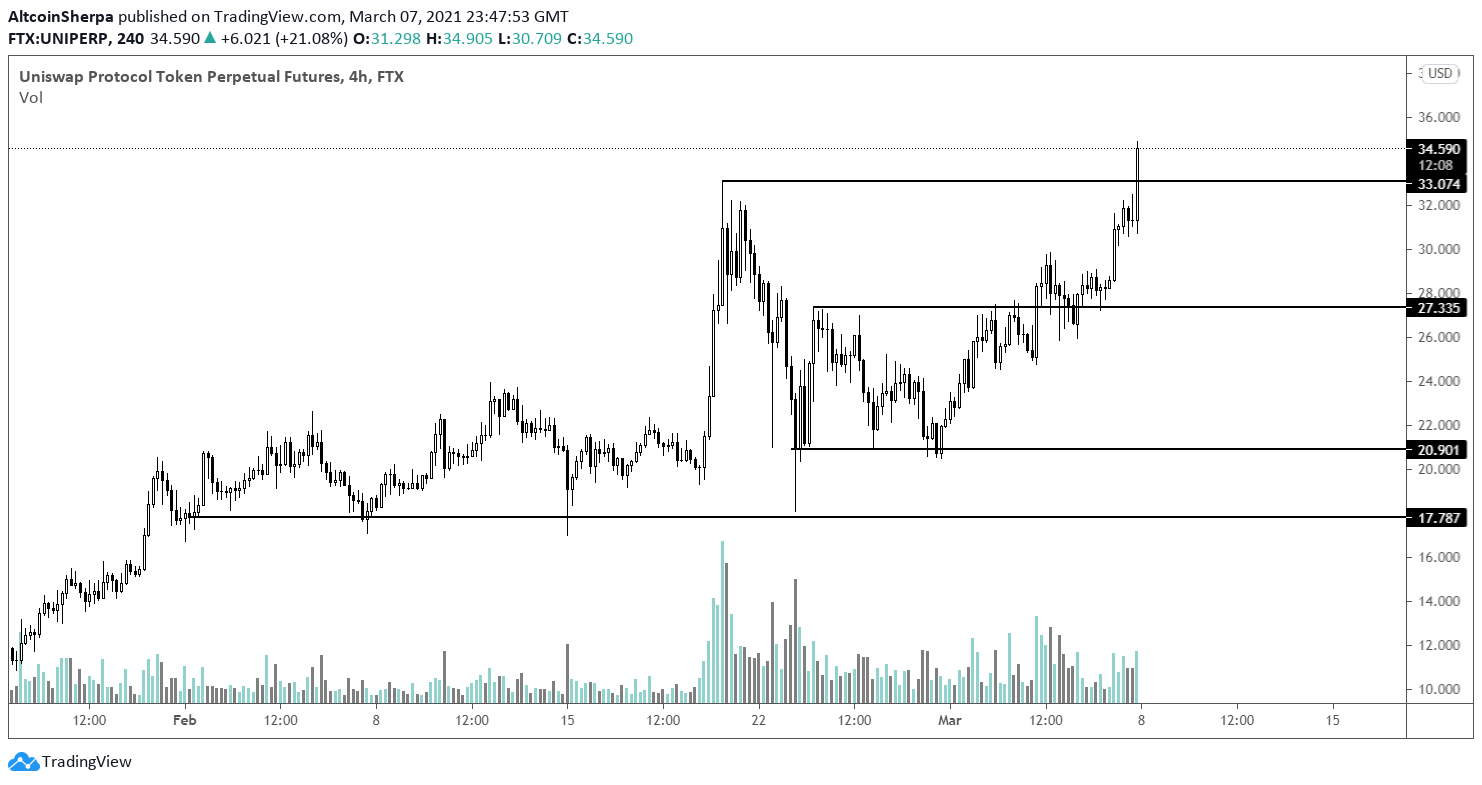
Cryptocurrency trader @Altcoinsherpa outlined a UNI chart, stating that it’s now in price discovery due to yesterday’s bullish close. As seen above, technical indicators also support the validity of the breakout.
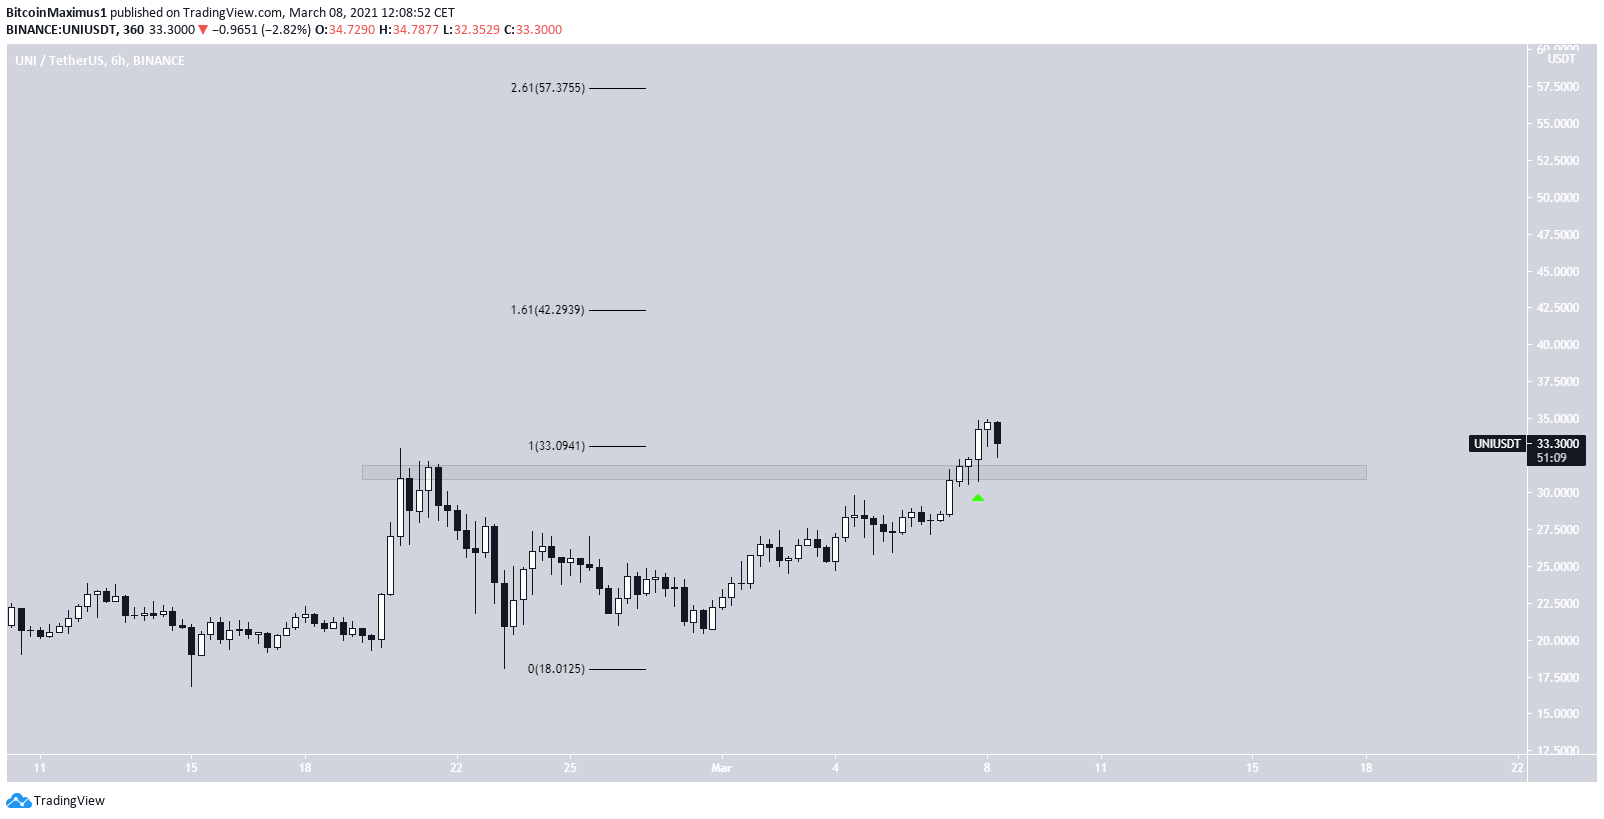
A closer look at the movement reveals that prior to the breakout, the price retested the previous all-time high resistance at $31.
Using an external Fib retracement on the most recent downward movement, we can find resistance levels at $42.25 and $57.40
DEFI Index
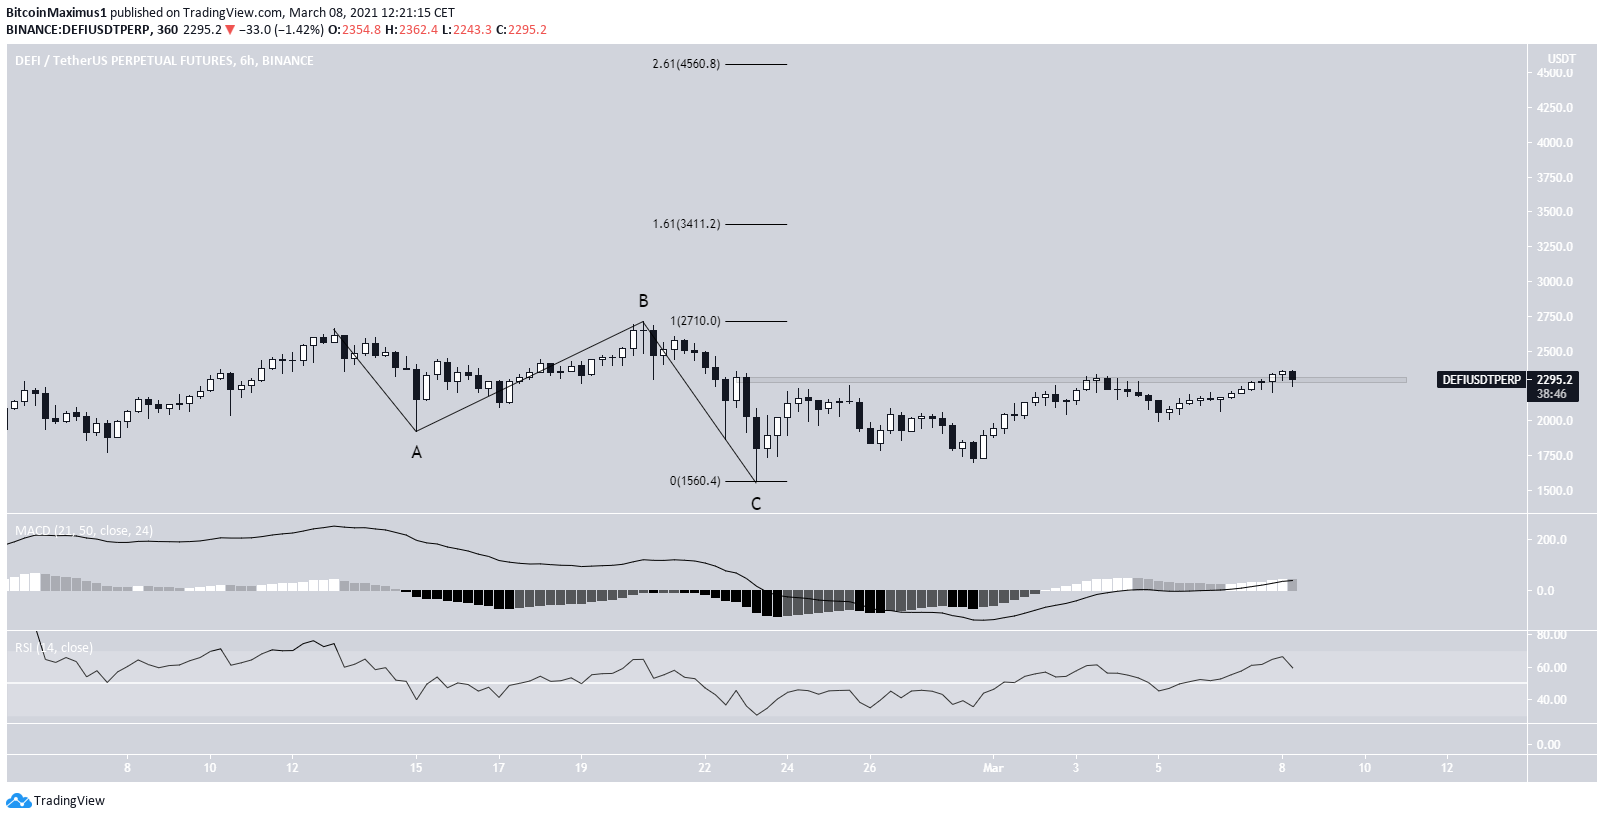
The DEFI Index reached an all-time high price of $2,711 on Feb. 20 but has been decreasing since.
The movement between Feb. 13-20 looks like a completed irregular flat correction. Therefore, the index is expected to increase and move towards a new all-time high.
While the RSI and MACD support this, the DEFI Index has to clear the $2,300 resistance area before potentially moving higher.
If it does, the next closest resistance areas would be found at $3,411 and $4,560. These targets were found using the same external retracement levels used in the previous section.
Conclusion
Despite being at an all-time high price, UNI is expected to continue increasing towards the $42-$57 range.
The DeFI index is expected to eventually reach a new all-time high, following in the footsteps of UNI.
For BeInCrypto’s latest Bitcoin (BTC) analysis, click here.


