


The Uniswap (UNI) price has broken down from a crucial support level and has been falling since. While the price has shown some preliminary bullish reversal signs, it hasn’t yet been confirmed.
UNI Breaks Down From Support
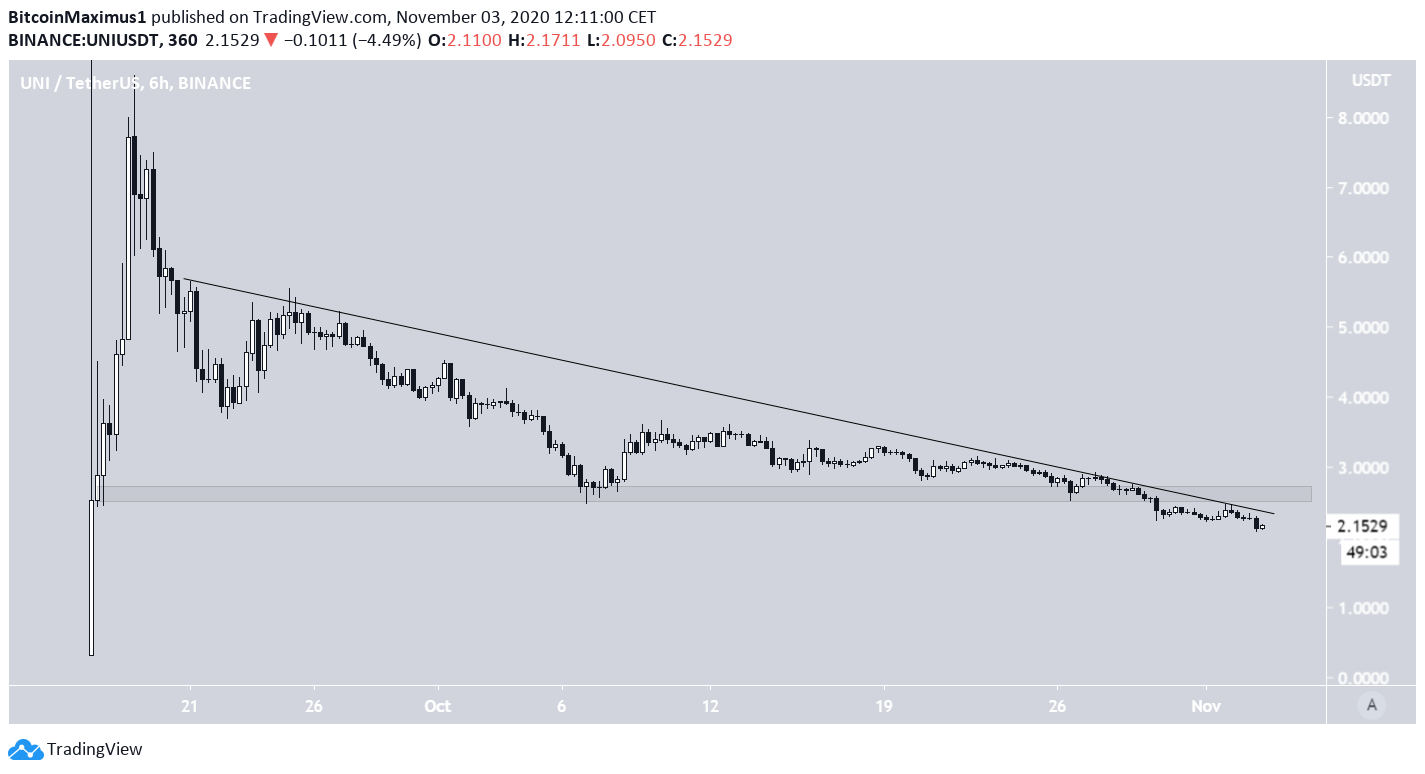
The UNI price has been gradually declining since it reached a high of $8.6 on Sept 18. While the fall has been swift, the price seemingly found support above the $2.60 area on Oct 7 and began an upward move.
However, it was rejected once more by the descending resistance line, and on Oct 29 broke down. Currently, there are no horizontal support levels besides the $0.30 area, which was the beginning of the upward move. There is also no descending support line that UNI is following.
When Will the Decline Come to an End?
Cryptocurrency trader @CryptoNewton stated that the UNI price is trading inside a parallel channel and could soon drop to $1.53.
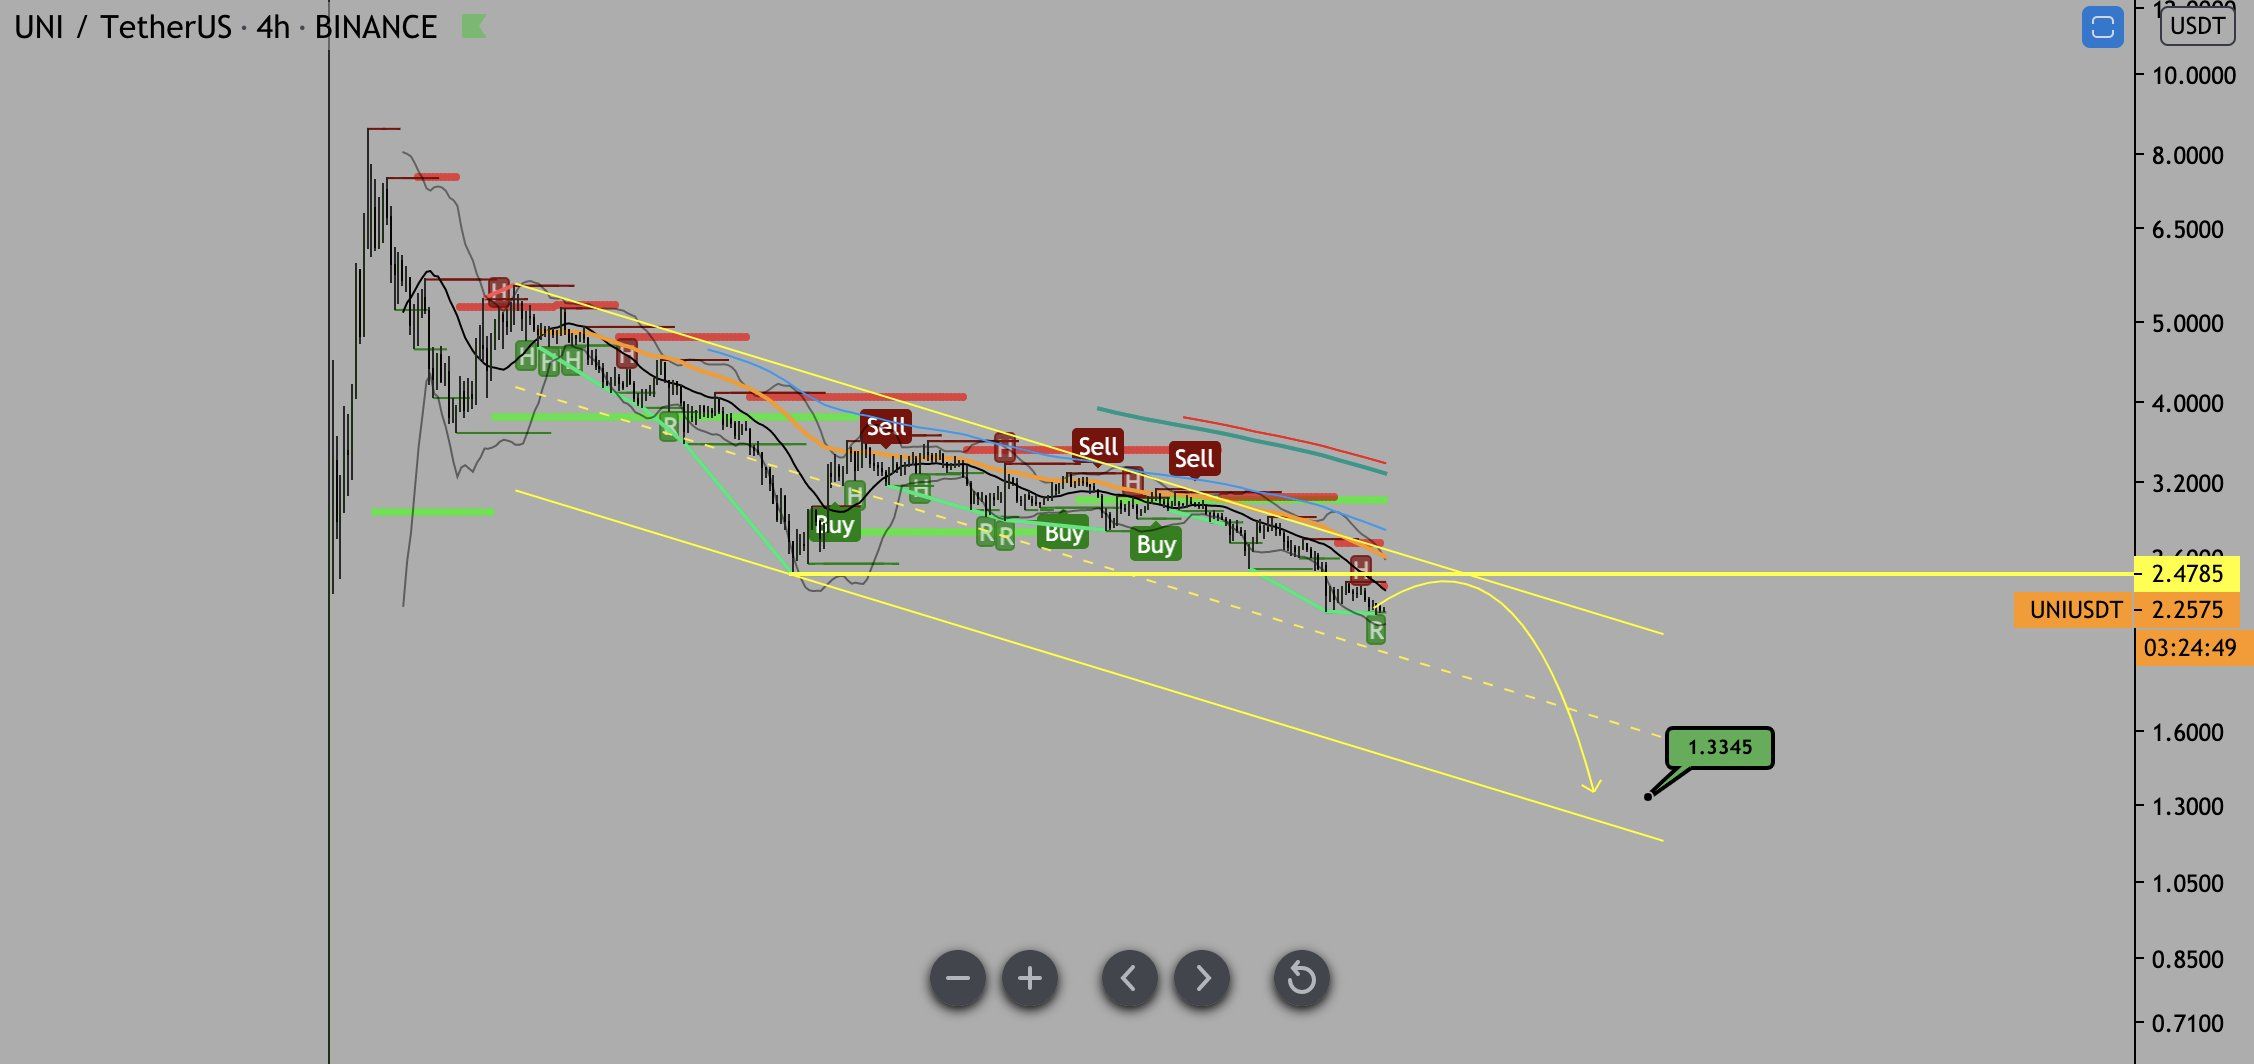
Since the support line has not been validated enough times, the channel ahs been created by projecting the resistance line to the two lows.
By doing so, the middle of the channel falls at $1.30, while the support line is at $0.60.
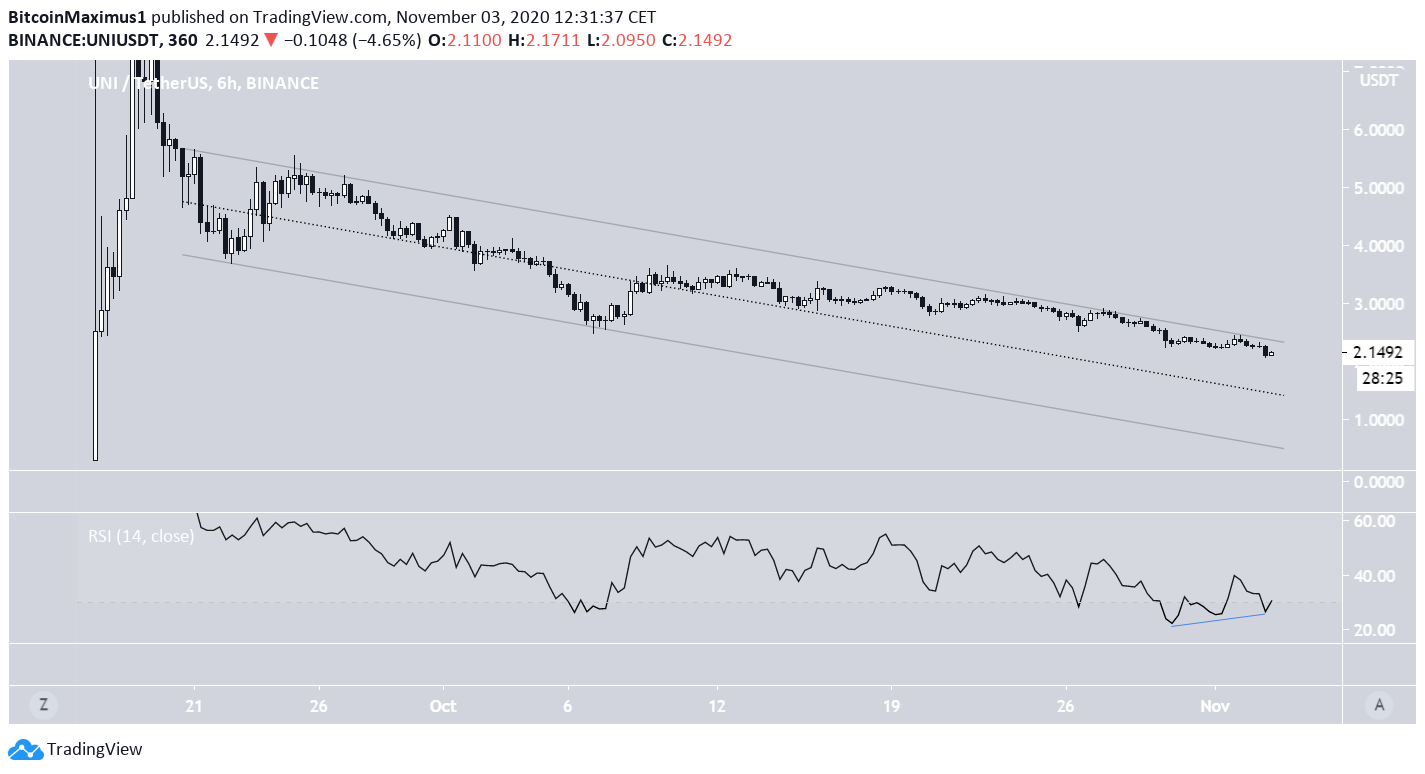
The RSI has begun to generate bullish divergence and is in oversold territory, however, there is no confirmation that the price has begun a reversal. A breakout from the resistance line of the channel would signal that the price has begun a relief rally.
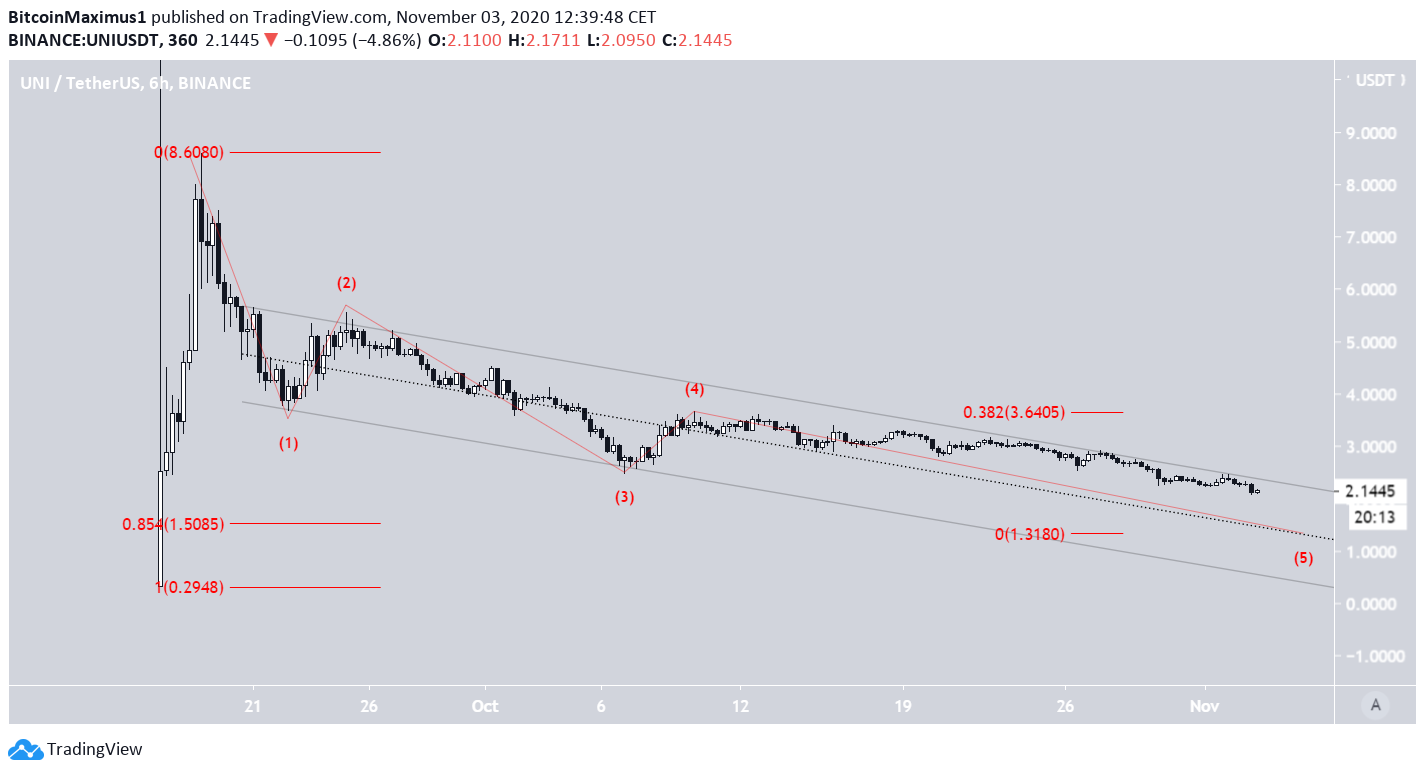
As for the wave count, it’s possible that UNI is in the fifth and final wave of a bearish impulse (shown in red below).
A likely target for the bottom of the move would be between $1.30 and $1.50, found by using a retracement of the entire move and on waves 1 – 3.
Furthermore, this area is very close to the middle of the channel, making it a likely level for a bottom.
Conclusion
To conclude, due to the lack of horizontal support levels, it’s not certain where the decline will stop for UNI. When using Fib levels, the first preliminary support area is found between $1.30 – $1.50.
For BeInCrypto’s latest Bitcoin analysis, click here!
Disclaimer: Cryptocurrency trading carries a high level of risk and may not be suitable for all investors. The views expressed in this article do not reflect those of BeInCrypto.


