The prices of two DeFi coins, DIA (DIA) and Mantra DAO (OM), recently fell to all-time lows. However, they both have legitimate bullish structures intact and could move upwards if they were to break out from their current resistance levels.
DIA (DIA)
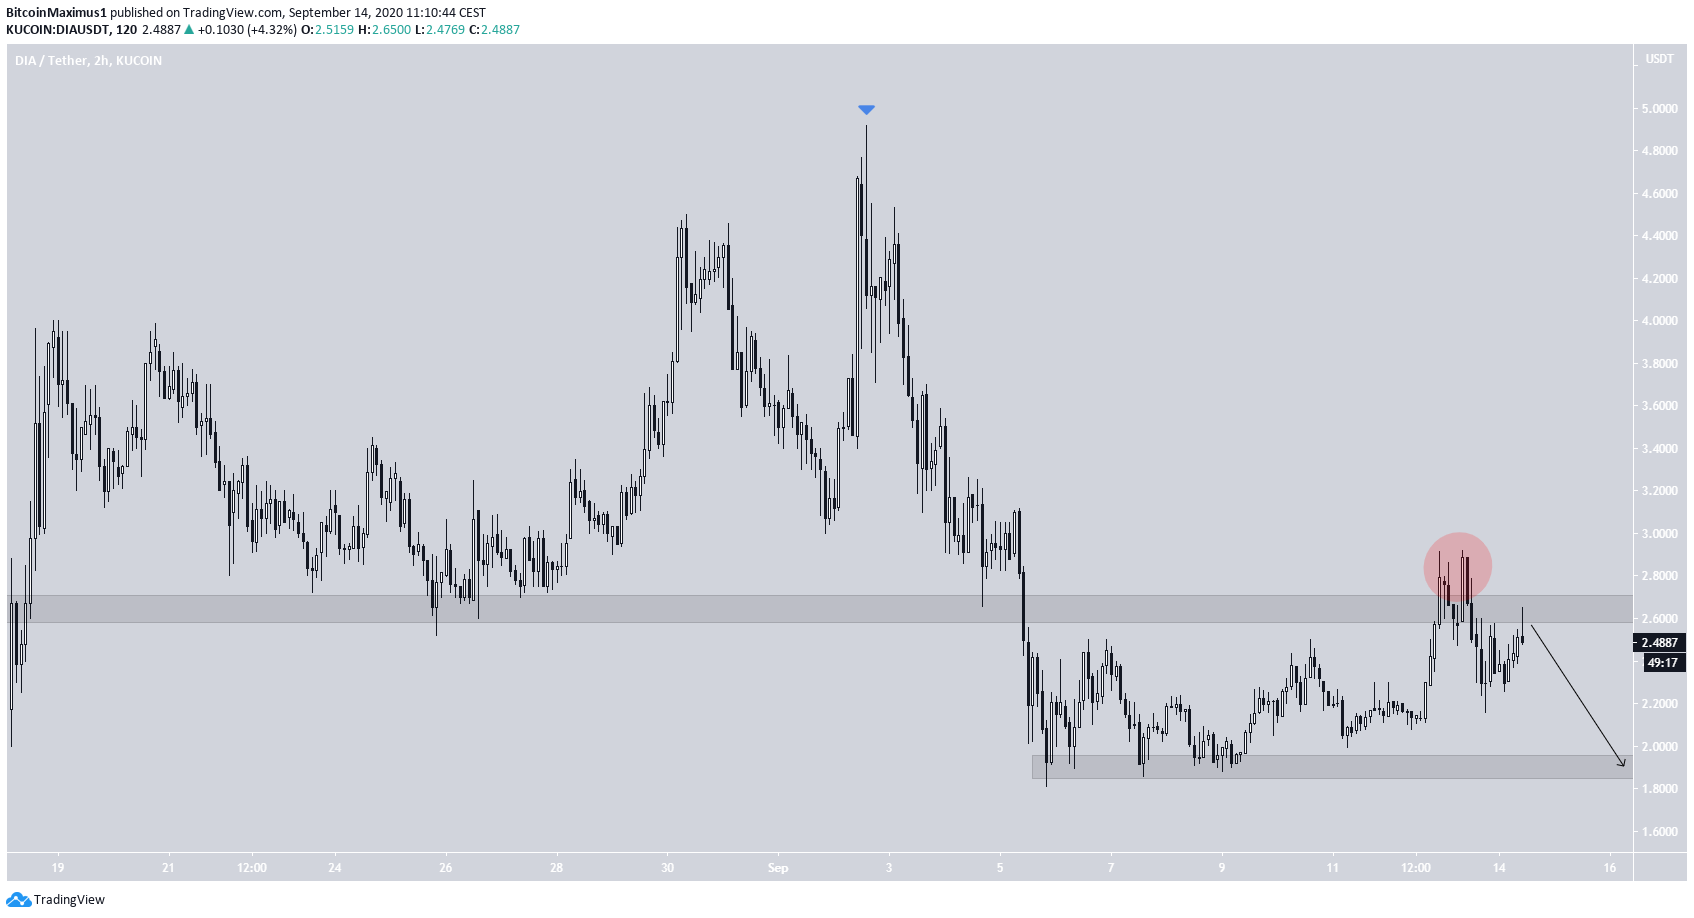
The DIA price has been falling since September 2, when it reached a high of $4.92. The decline culminated with a low of $1.80 on September 5. The price has been increasing since, creating a minor support area at $1.90.
However, the previous support area of $2.65 has now turned to resistance. In addition, the September 13 rally above this resistance area is considered a deviation above the range high. It was subsequently followed by a decline below resistance. This suggests that the price is likely to decrease towards $1.90.
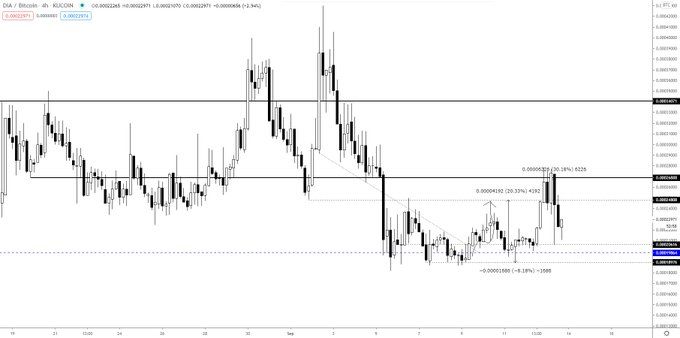
Cryptocurrency trader @TheEuroSniper outlined a DIA chart, stating that the price has reached all of his targets. However, he did not indicate where the price is heading to next. The target was reached during the previous deviation, and the price has fallen to support since.
Future Move
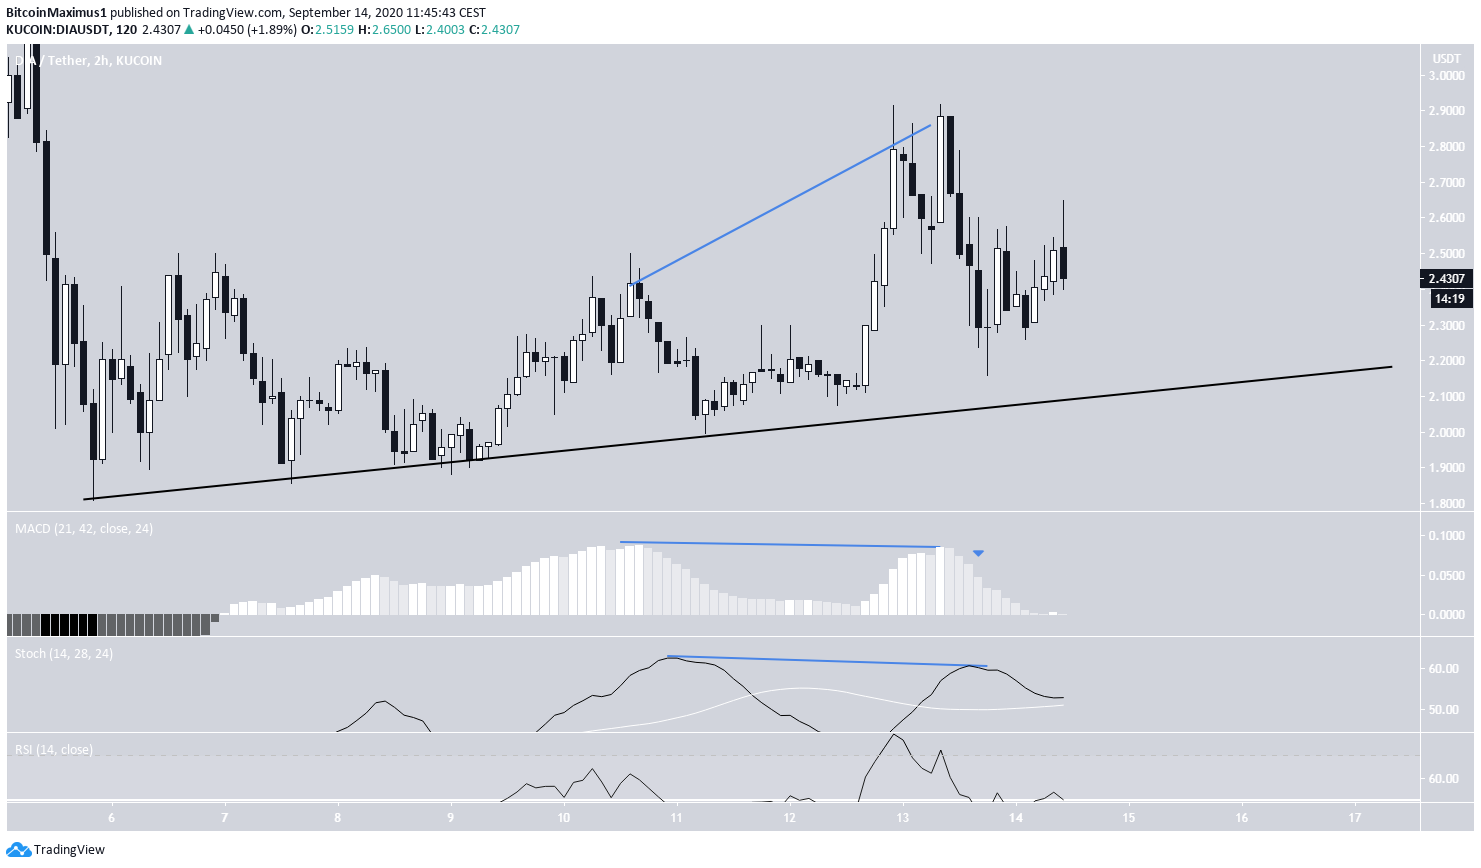
The shorter-term chart shows an ascending support line that the price has been following since the low on September 5. In addition, technical indicators show considerable weakness in the form of bearish divergence in both the MACD and Stoch RSI, the latter of which is in the process of making a bearish cross.
The price should fall back to this ascending support line and then possibly continue increasing at its rate.
The movement above/below $2.65 and $1.90 will likely determine where the price heads to next. A breakout above the $2.65 area would likely take the price towards the previous highs at $4, while a decline below the $1.90 area could take it to a new all-time low.
Mantra DAO (OM)
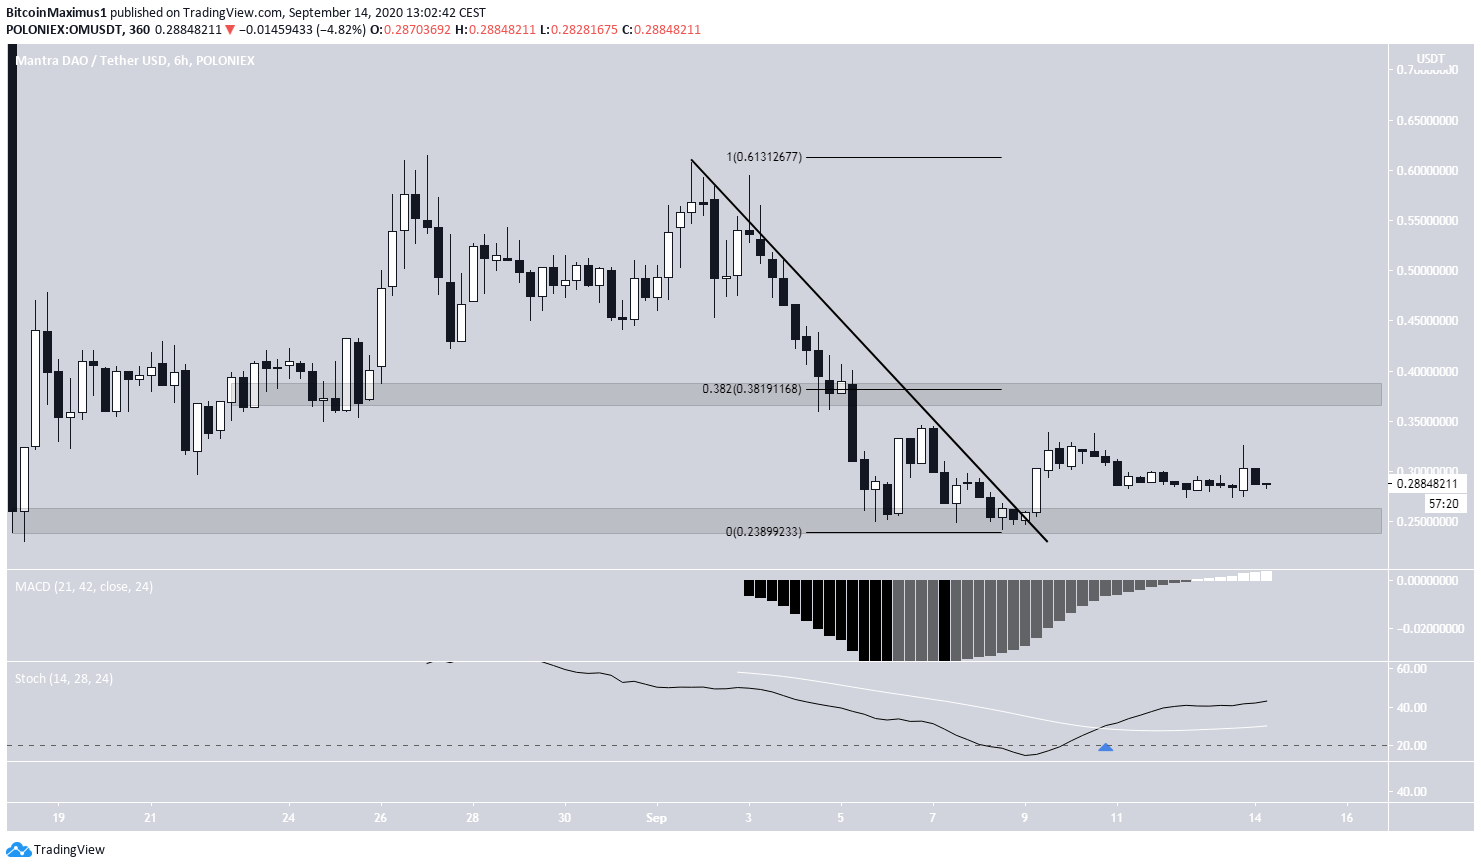
The OM price has been falling since a high of $0.60 on September 1, following a descending resistance line. On September 5, the price broke out from this descending resistance line but failed to sustain the upward momentum.
The main resistance and support levels are found at $0.38 and $0.25, respectively. A breakout above the former (which is also the 0.382 Fib level) would likely take the price towards the $0.61 highs.
Technical indicators are bullish since there is a bullish cross on the Stochastic RSI. The MACD has turned positive. Therefore, at least an upward move towards $0.38 is expected and possibly an eventual breakout towards $0.61.