


Donald Trump’s newly launched meme coin OFFICIAL TRUMP (TRUMP) has emerged as the market’s top performer, recording a 268% surge in value over the past 24 hours. Its market capitalization has soared past $14 billion, propelling it into the top 20 cryptos list within just 24 hours of its launch.
However, signs suggest that the rally may be losing steam, pointing to a possible correction in the near term.
TRUMP Is Overbought
TRUMP’s technical indicators suggest that the meme coin is now overbought, sparking fears of an imminent correction. For example, its Relative Strength Index (RSI) is 98.88 as of this writing, indicating the explosive demand for TRUMP.
This momentum indicator measures an asset’s overbought and oversold market conditions. It ranges between 0 and 100, with values above 70 indicating that the asset is overbought and due for a correction. On the other hand, values below 30 suggest that the asset is oversold and may witness a rebound.
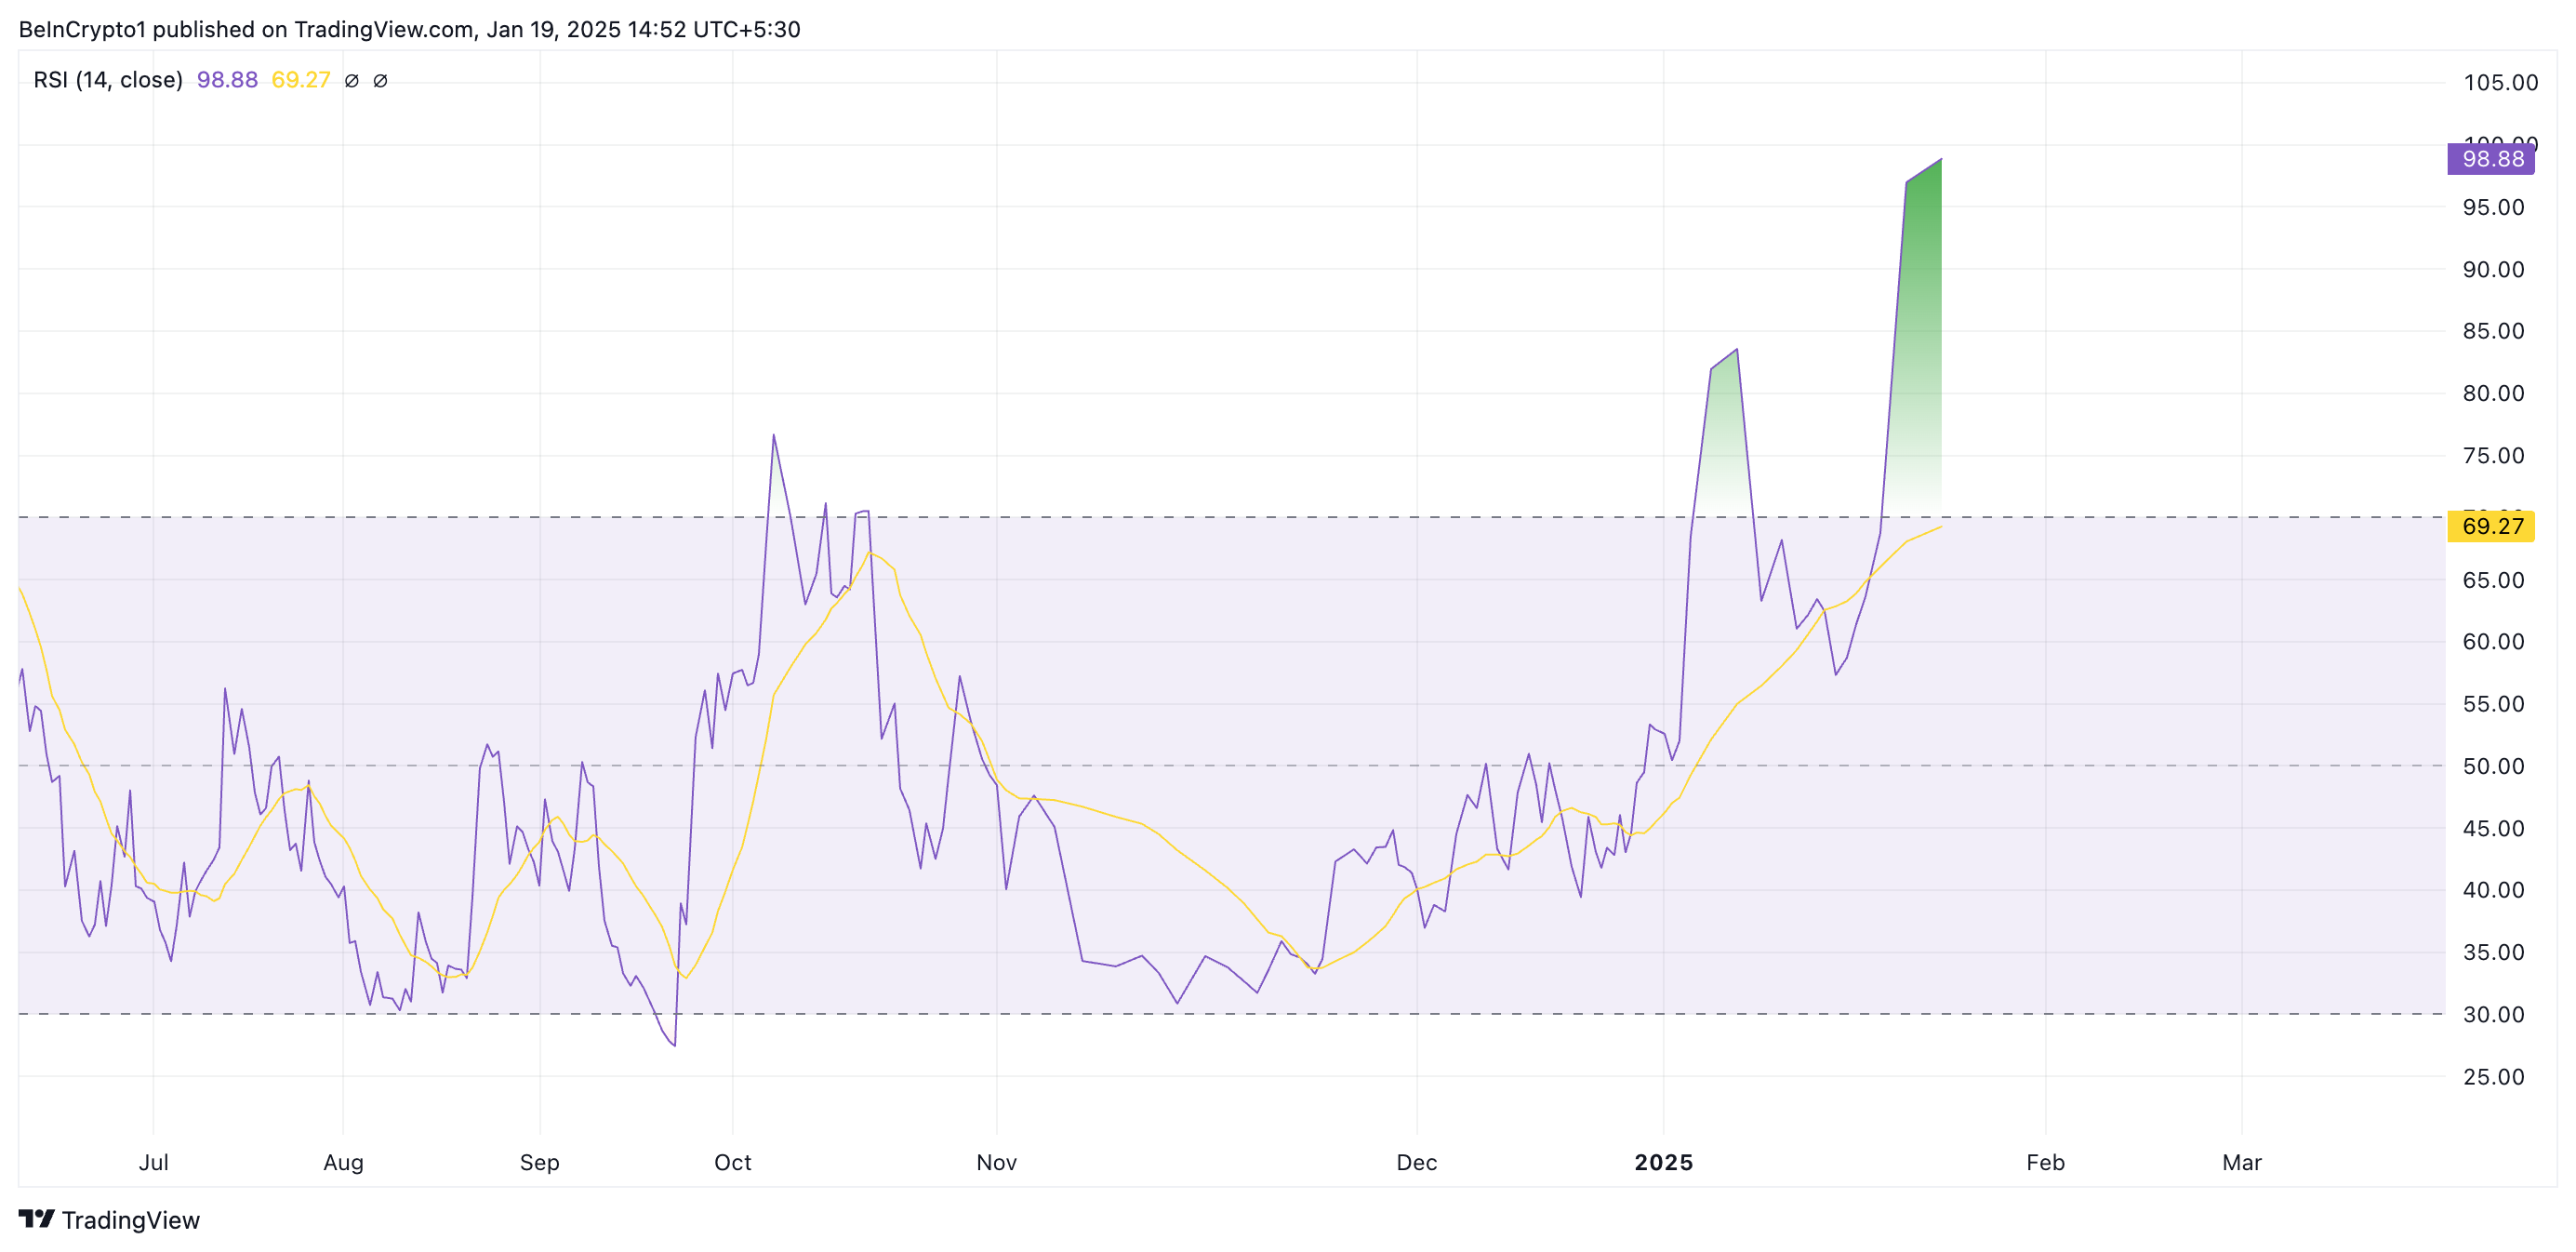
At 98.88, TRUMP’s RSI indicates that the meme coin is extremely overbought, suggesting unusually high buying pressure. This signals a potential reversal or correction as the price may struggle to sustain its current trajectory.
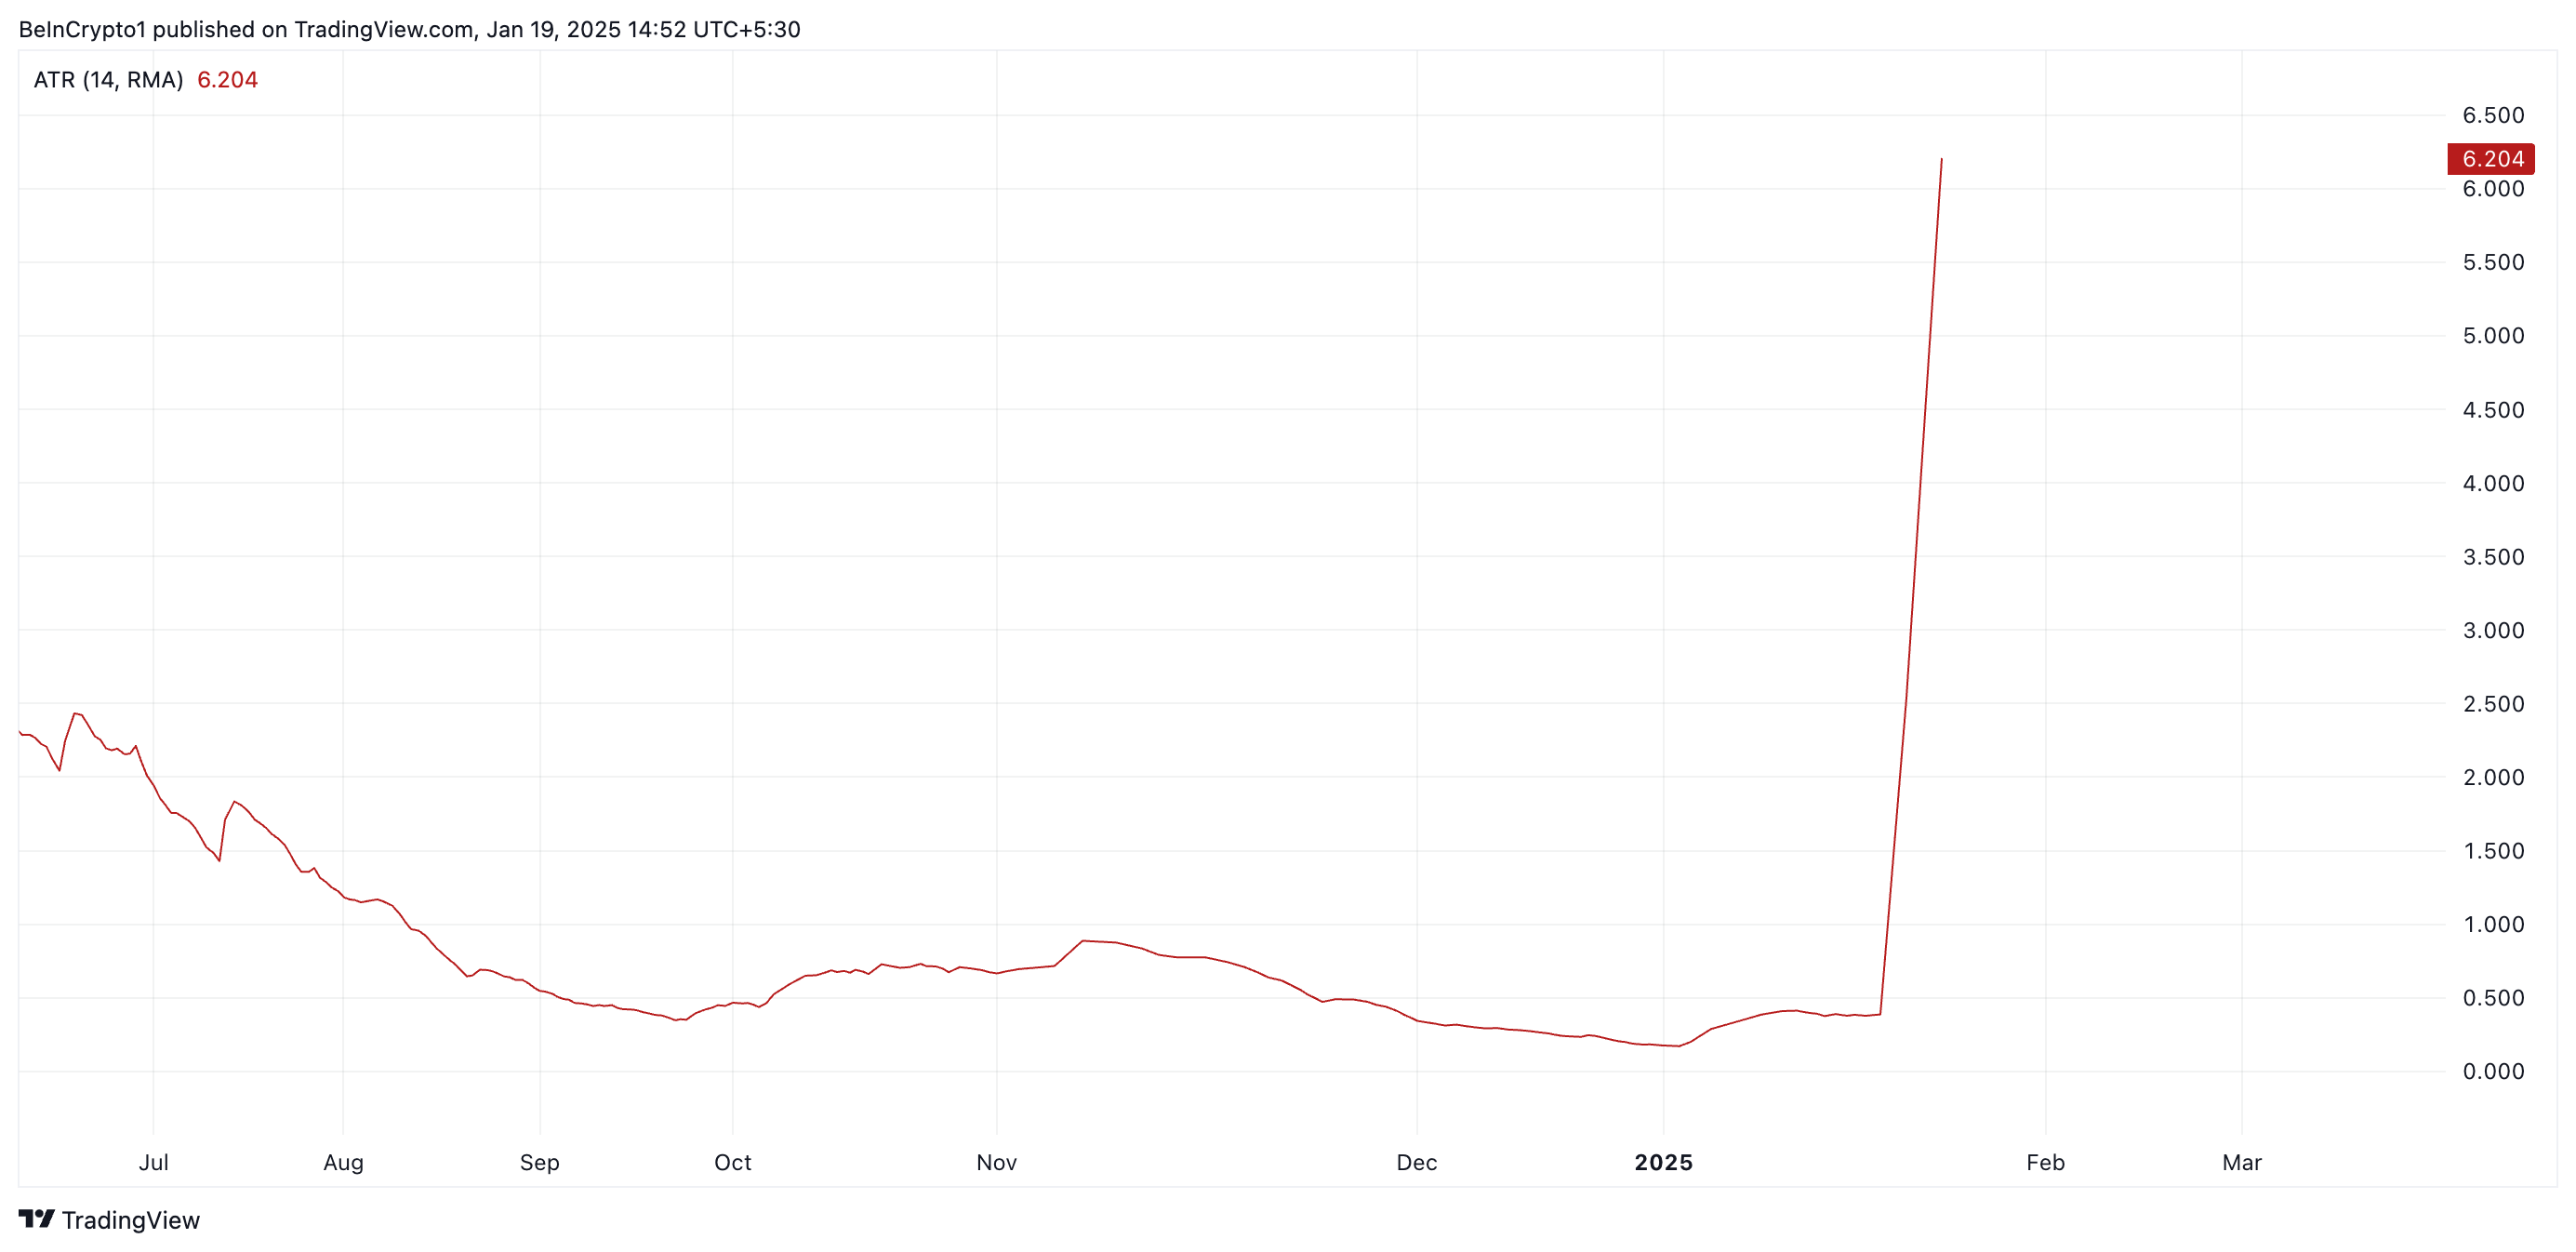
Furthermore, the TRUMP market is highly volatile, increasing the risk of a downside swing. This is reflected by its rising Average True Range (ATR), currently at 6.20.
The ATR measures market volatility by calculating the average range between an asset’s high and low prices over a specific period. When it climbs like this, it indicates heightened volatility, signaling the likelihood of price swings in either direction.
TRUMP Price Prediction: Token’s Price Teeters Between $31.64 Support and New All-Time High
According to readings from TRUMP’s Fibonacci Retracement tool, once the correction sets in, its price could fall toward support at $31.64. If the bulls cannot defend this zone, the downtrend could continue to $15.58.
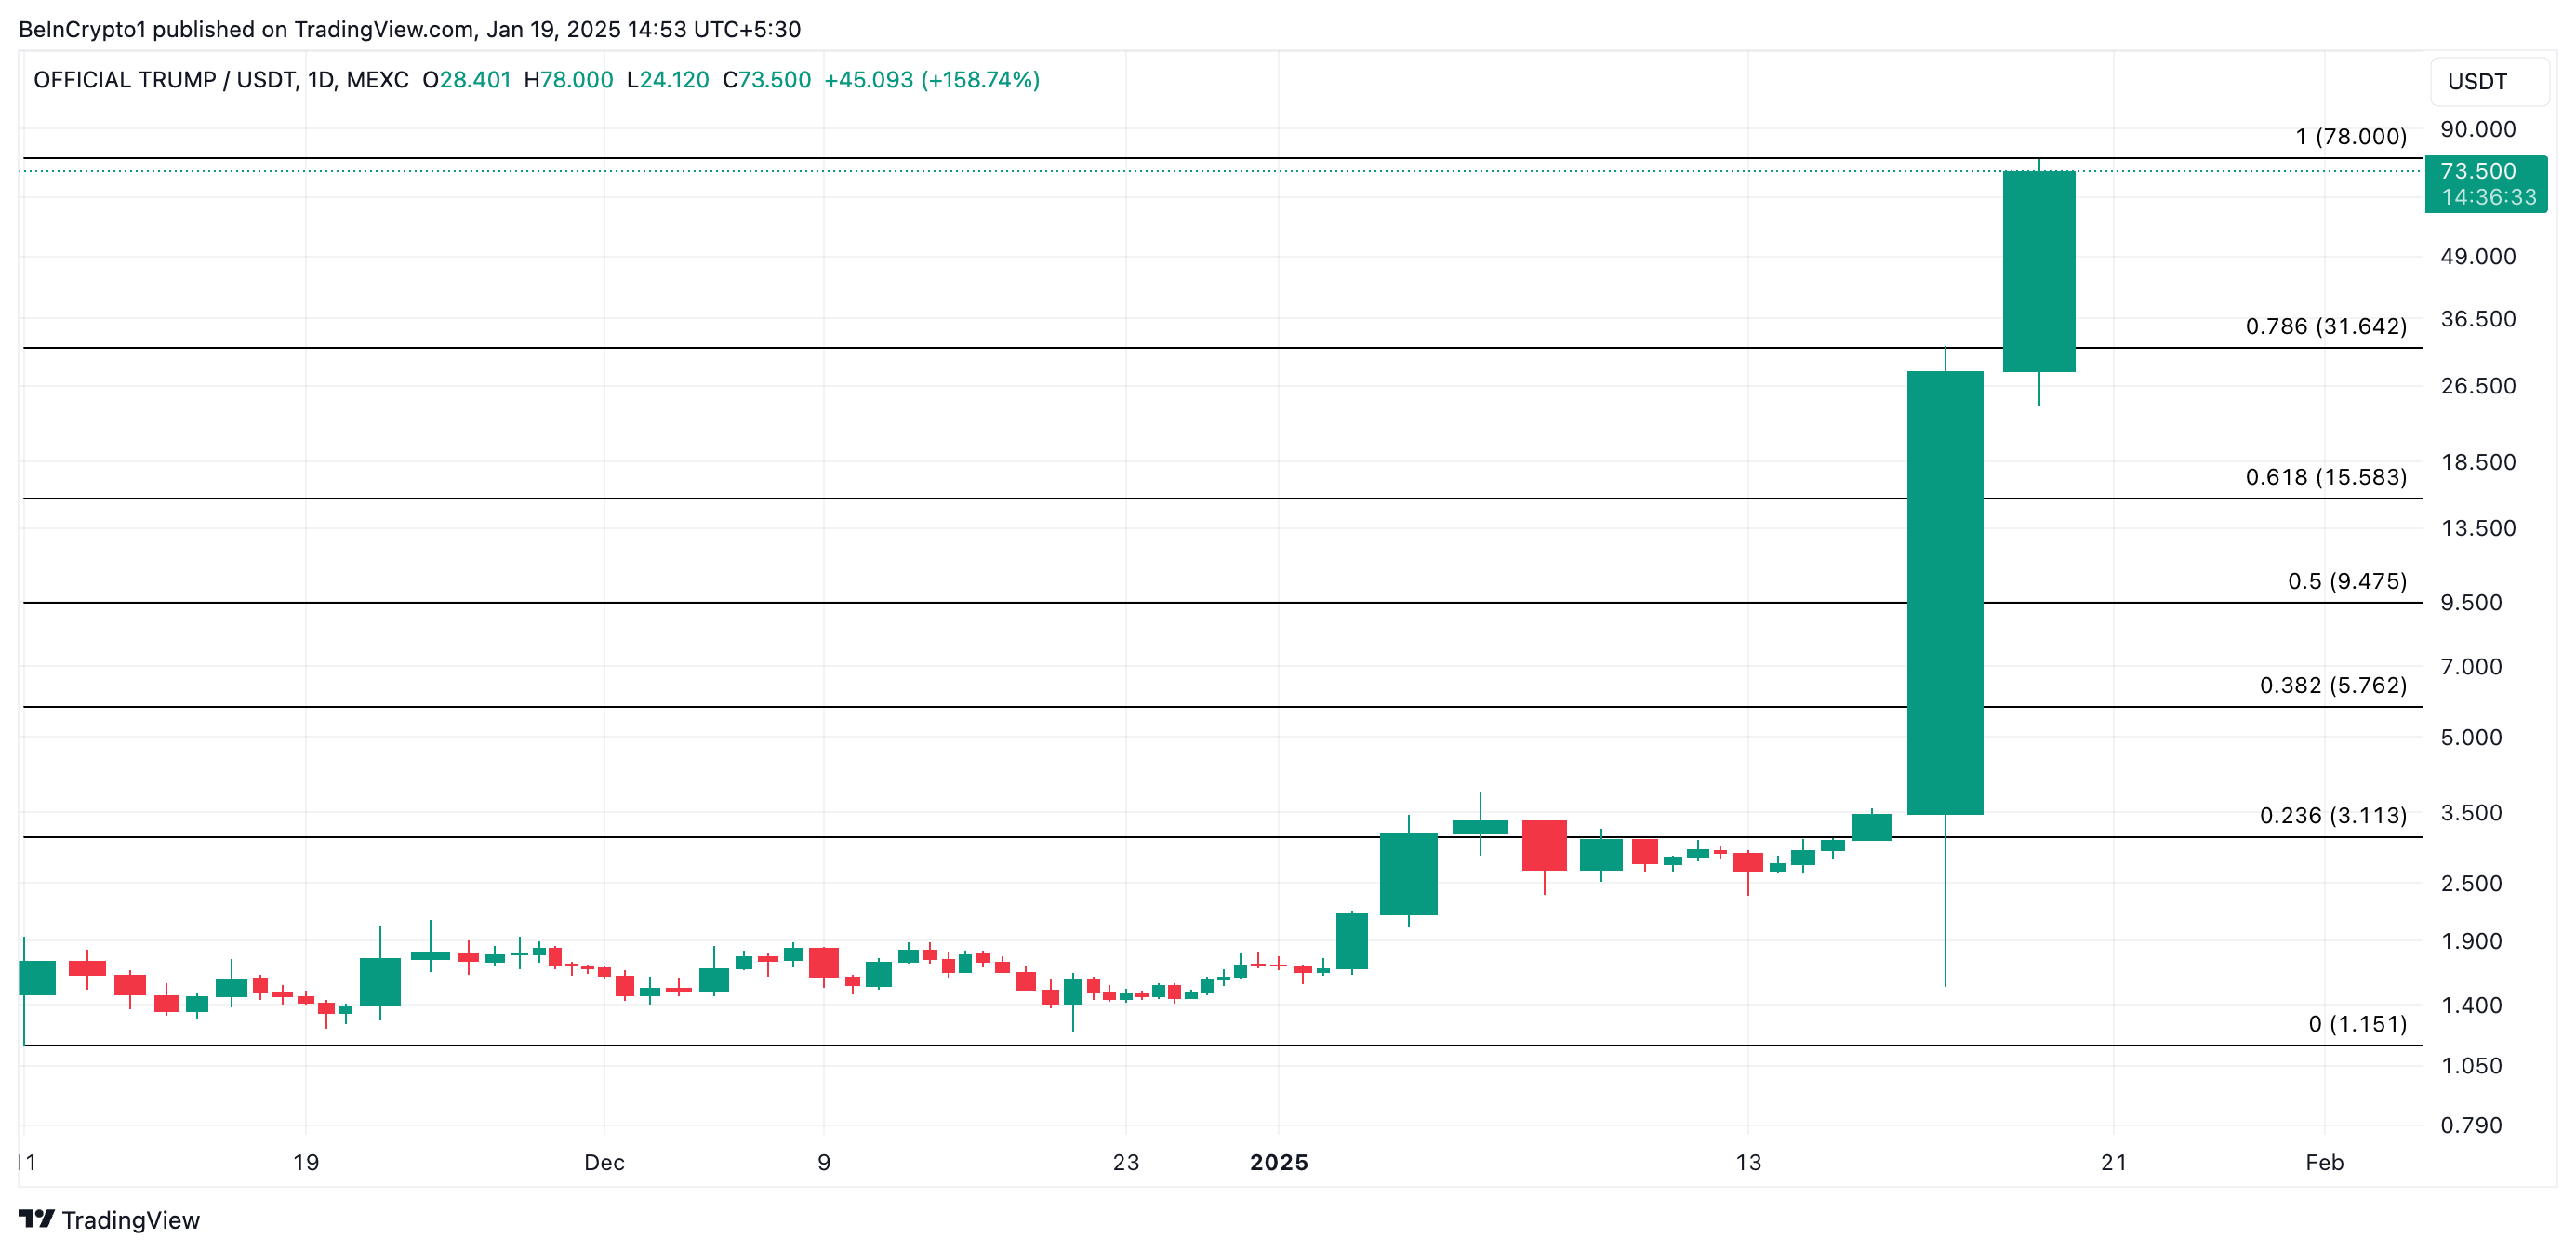
On the other hand, a sustained spike in coin accumulation will push the meme coin to a new all-time high, invalidating the bearish outlook above.



