


The TRON (TRX) price is in the process of validating the $0.055 area as resistance. If it fails to reclaim it, the continuation of the downward movement is expected.
TRX is the native token of the TRON blockchain, created by Justin Sun. The TRON ecosystem also contains a plethora of other digital assets.
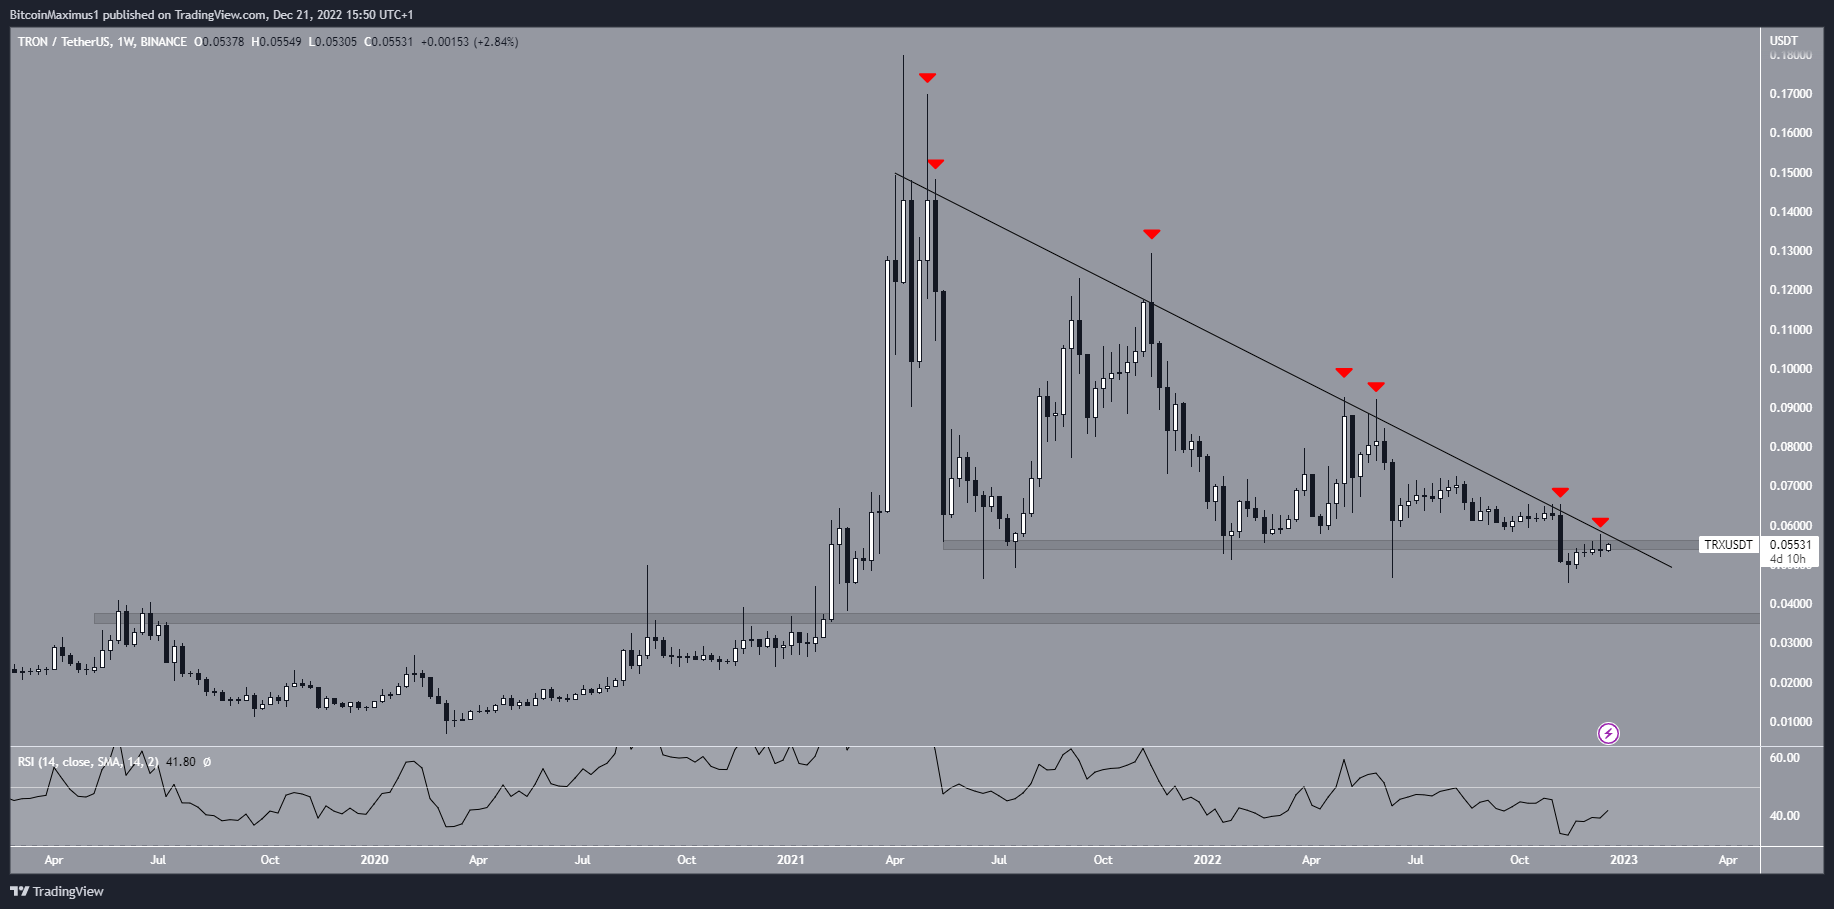
The weekly time frame outlook for TRON is bearish. The TRX price has decreased below a descending resistance line since April 2021.
So far, the line has caused numerous rejections (red icons), the most recent leading to a breakdown from the $0.055 support area. Since the area had previously acted as support since March 2021, the breakdown was a meaningful development.
Technical indicators support the continuation of the downward movement. The weekly RSI is below 50 and decreasing. This is considered a bearish sign. When combined with the breakdown from the $0.055 area, it indicates that the trend is bearish.
Currently, the TRON price is in the process of validating the $0.055 area as resistance. Due to the bearish readings, the most likely TRX price forecast would be a rejection followed by a downward movement. If that occurs, the next closest support area would be at $0.036.
On the other hand, a reclaim of the $0.055 area and breakout from the descending resistance line would indicate that the trend is bullish instead.
TRX Price Faces Confluence of Resistances at $0.055
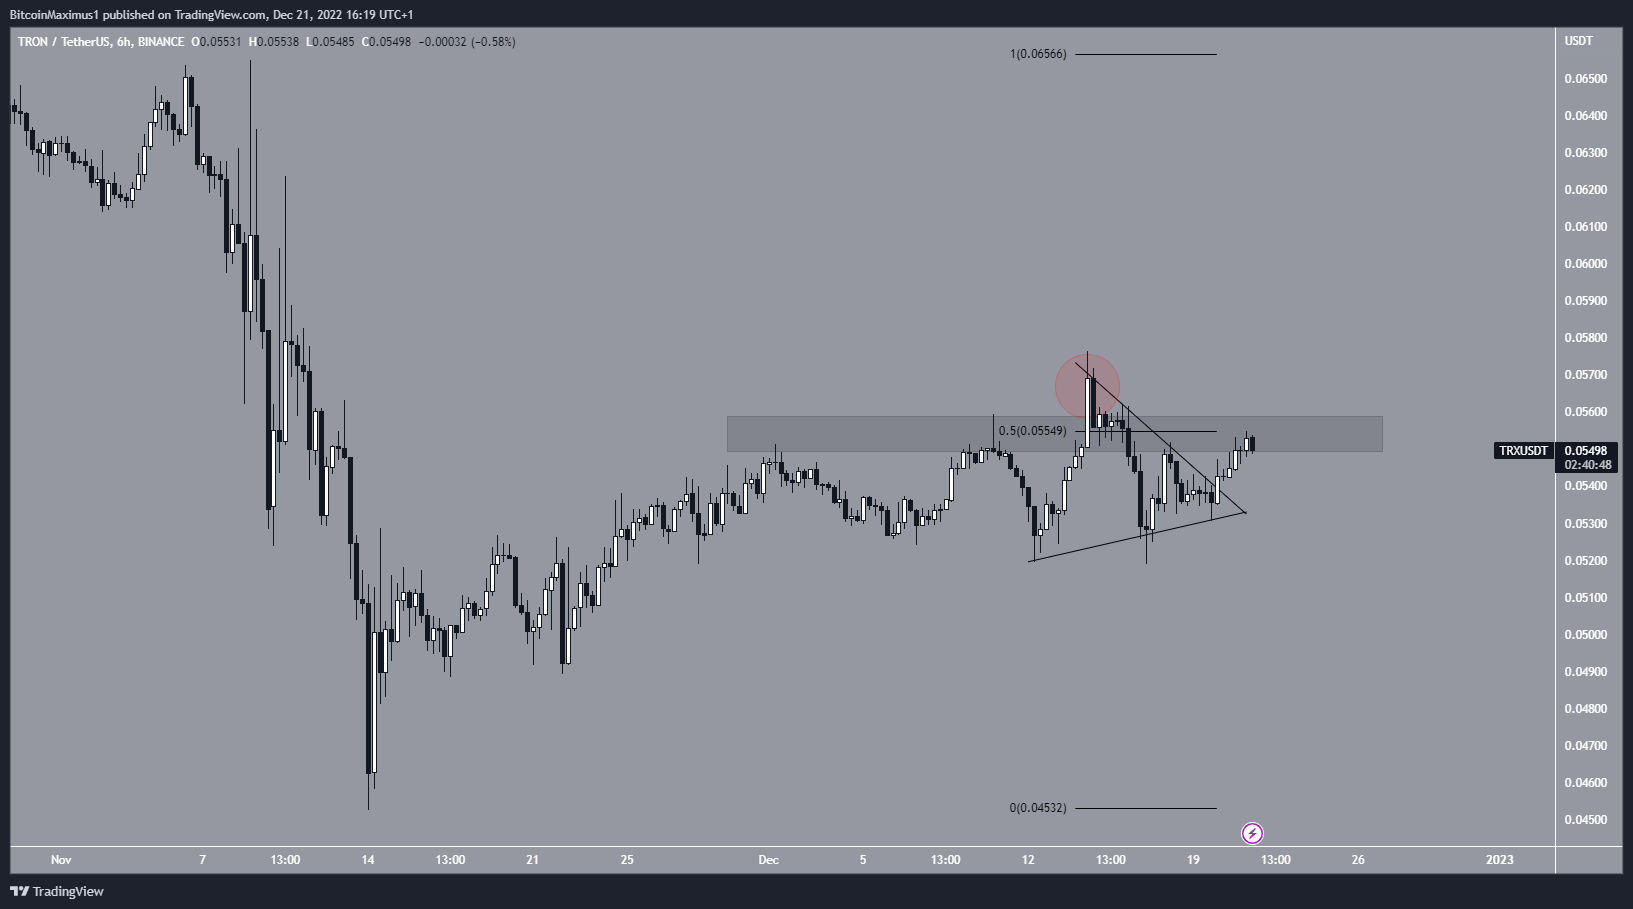
The short-term six-hour chart shows that the $0.055 area is also the 0.5 Fib retracement resistance level, increasing its significance. The TRON price deviated above it (red circle) on Dec. 14 before falling down.
In the past 24 hours, the TRX price broke out from a short-term symmetrical triangle. However, it has yet to move above the $0.055 area. In order for the trend to be considered bullish, the TRON price has to reclaim this area.
To conclude, due to considerable bearish readings from the weekly time frame, the expected TRX price forecast is bearish, predicting a drop toward $0.036. Reclaiming the $0.036 area would negate this bearish outlook.
For BeInCrypto’s latest crypto market analysis, click here.


