


The Tron (TRX) price risks breaking down from a long-term horizontal support area. If it occurs, this could trigger a 40% drop.
On Nov. 10, the Tron-based USDD stablecoin de-pegged to $0.97. USDD is an algorithmic stablecoin, and its de-pegging immediately creates flashbacks to the LUNA and UST collapse.
Despite these negative Tron news, the Tron founder Justin Sun announced that he was working with FTX in a plan to potentially rescue investors. Finally, the USDD vs USDC/USDT/DAI pool is out of balance, with USDD accounting for 82.27%.
Even considering this negative Tron news, the TRX price has increased considerably in the past 24 hours.
TRX Price Prediction: Weekly Breakdown Could Lead to 40% Drop
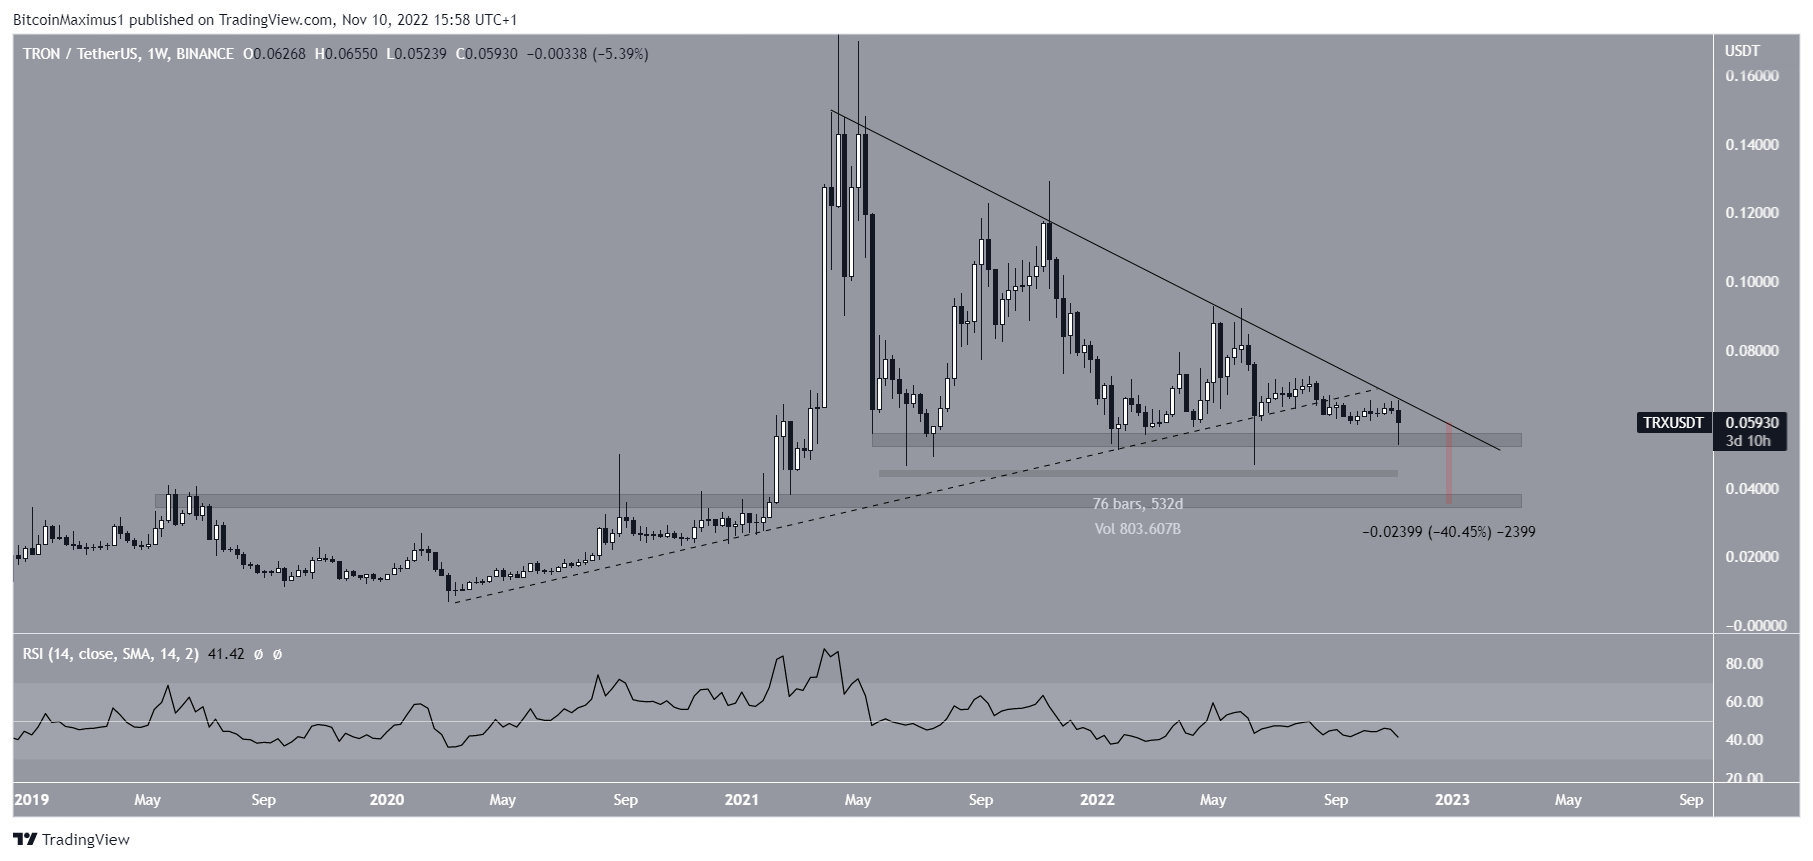
The Tron price has fallen underneath a descending resistance line since reaching a maximum price of $0.18 in April 2021. While underneath the line, it also broke down from an ascending support line that had been in place since March 2020.
Currently, it is trading above the $0.055 horizontal support area. The area has been in place for 532 days.
If it breaks down, the Tron price could fall down to $0.036. This is a drop of 40% from the current price.
The weekly RSI supports this decrease. It has fallen below 50 and is decreasing.
Conversely, a breakout from the long-term line would invalidate this bearish Tron price prediction. This seems unlikely at the current time.
Short-Term Resistance Could Provide Confirmation
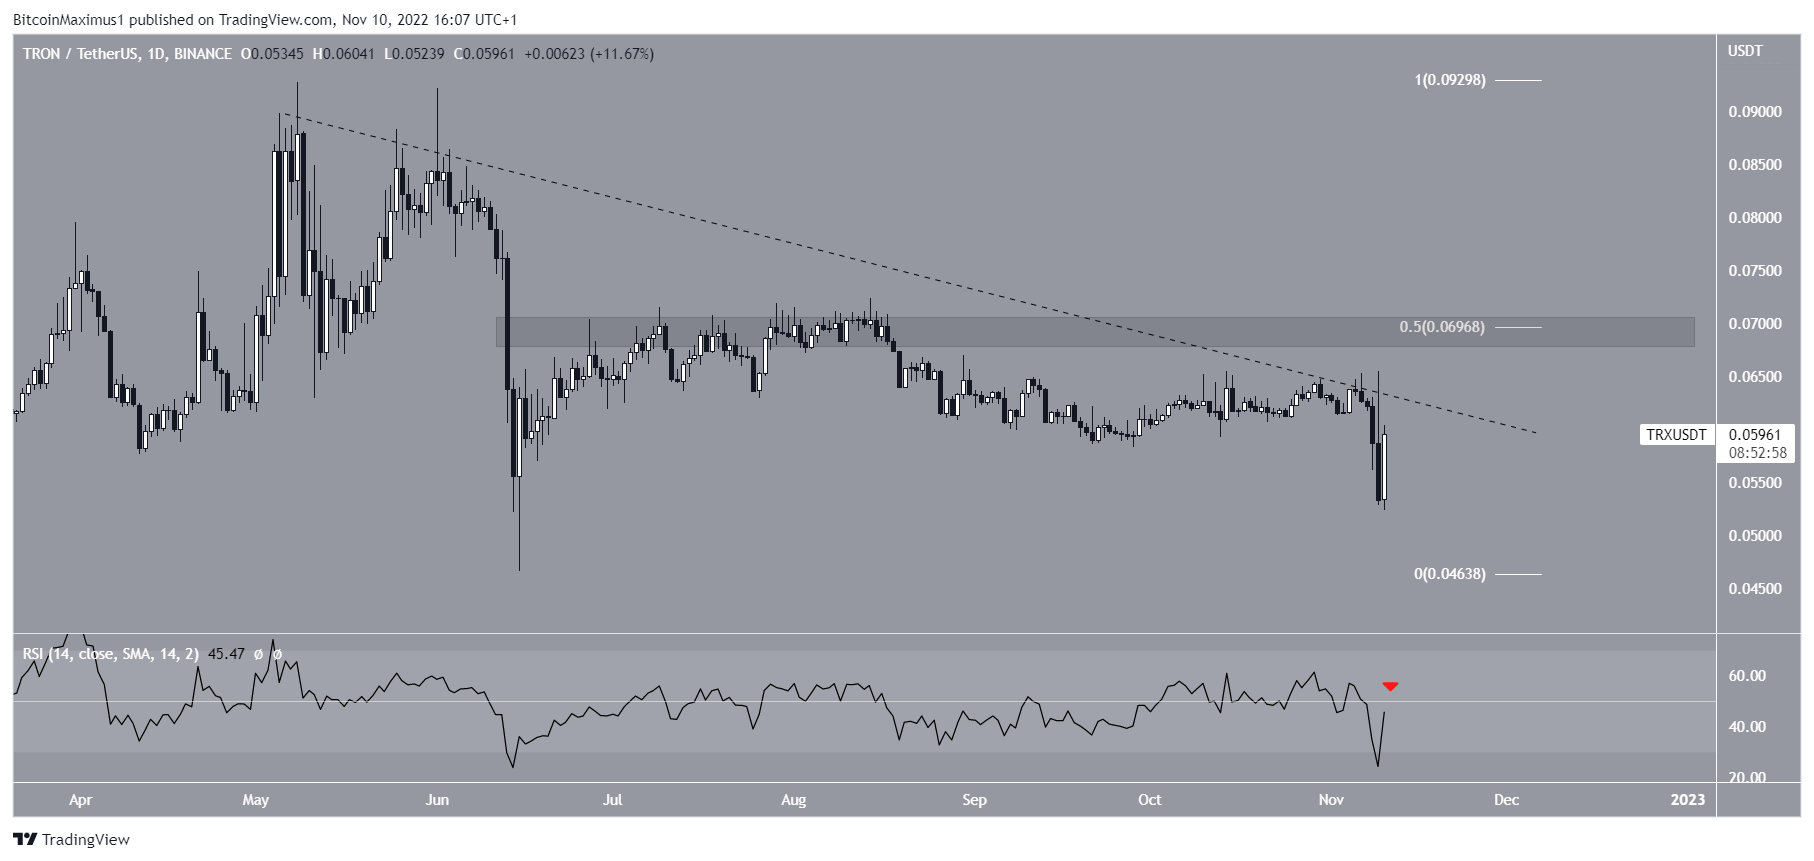
The technical analysis from the daily time frame supports the possibility of a breakdown. Firstly, it shows that the Tron price has followed a descending resistance line since May. The line rejected the price on Nov. 7 and initiated the ongoing downward movement.
Secondly, the daily RSI is below 50 and facing resistance from the line.
Even if the Tron price were to break out from the line, there would be strong resistance at $0.07, created by both the 0.5 Fib retracement resistance level and a horizontal resistance area. Therefore, unless the Tron price is successful in moving above it, the Tron price forecast remains bearish.
For BeInCrypto’s latest Bitcoin (BTC) analysis, click here.
Disclaimer: BeInCrypto strives to provide accurate and up-to-date information, but it will not be responsible for any missing facts or inaccurate information. You comply and understand that you should use any of this information at your own risk. Cryptocurrencies are highly volatile financial assets, so research and make your own financial decisions.


