


TRON (TRX) has been moving upwards since Jan 24 and managed to reach a new yearly high on March 31.
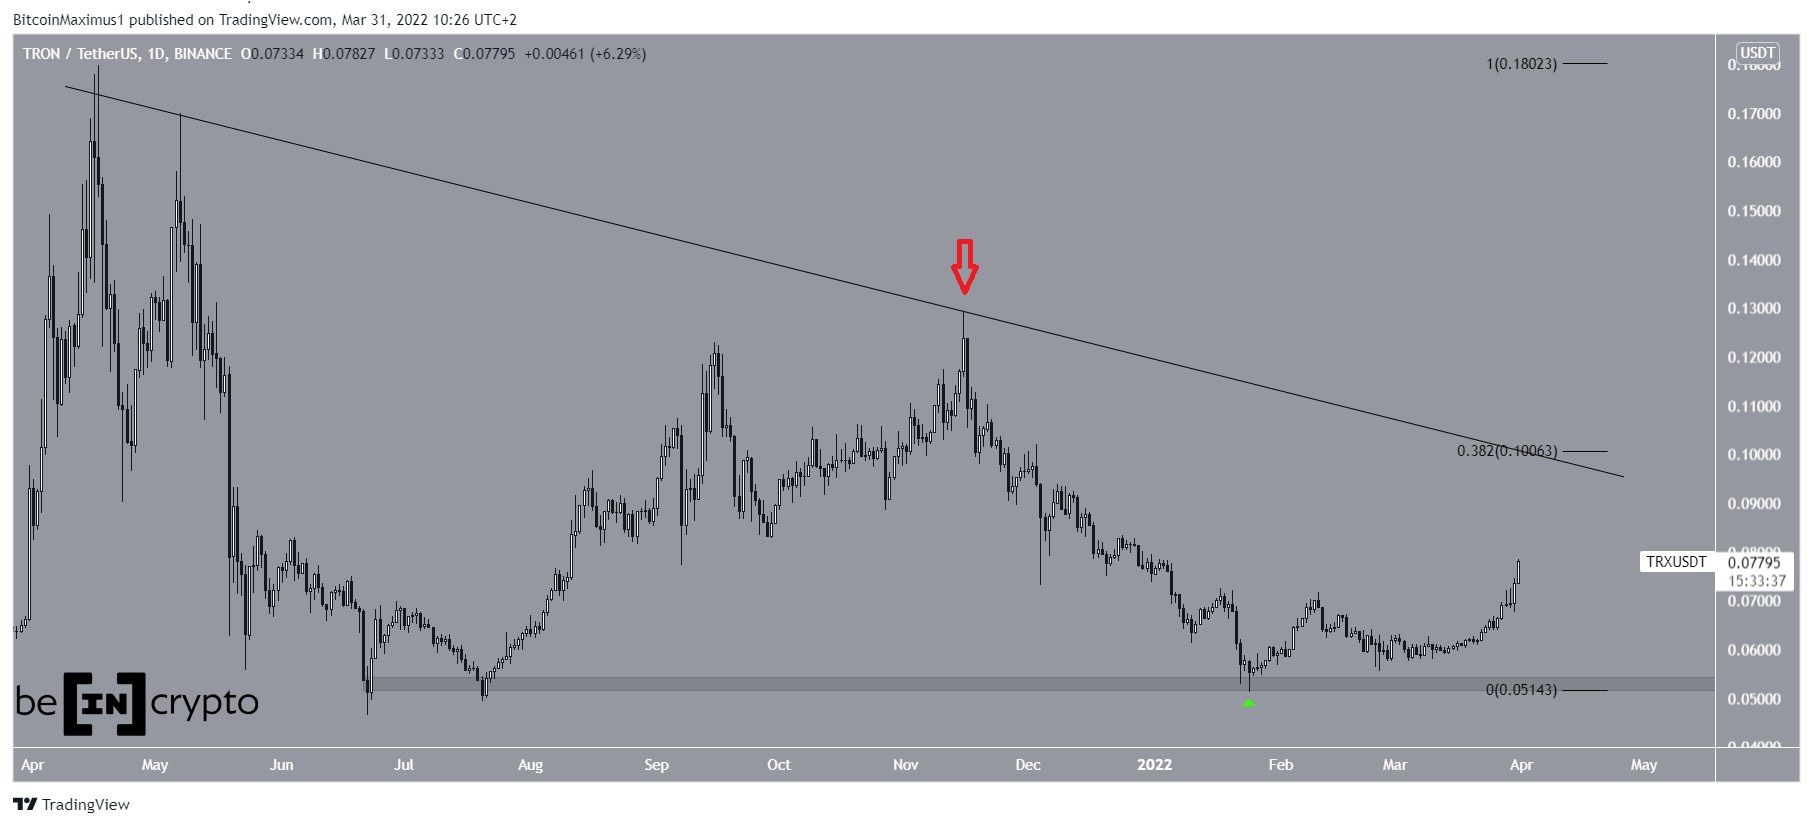
TRX has been falling underneath a descending resistance line since reaching an all-time high price of $0.18 on April 17 2021. The decrease led to a low of $0.046 on June 22.
Afterward, TRX bounced but created a lower high on Nov 15, validating the descending resistance line in the process (red arrow).
After the ensuing decrease, TRX bounced (green icon) at the $0.052 horizontal support area and began the current upward movement.
The next closest resistance is at $0.10. This is the 0.382 Fib retracement resistance level and coincides with the descending resistance line.
Ongoing TRX breakout
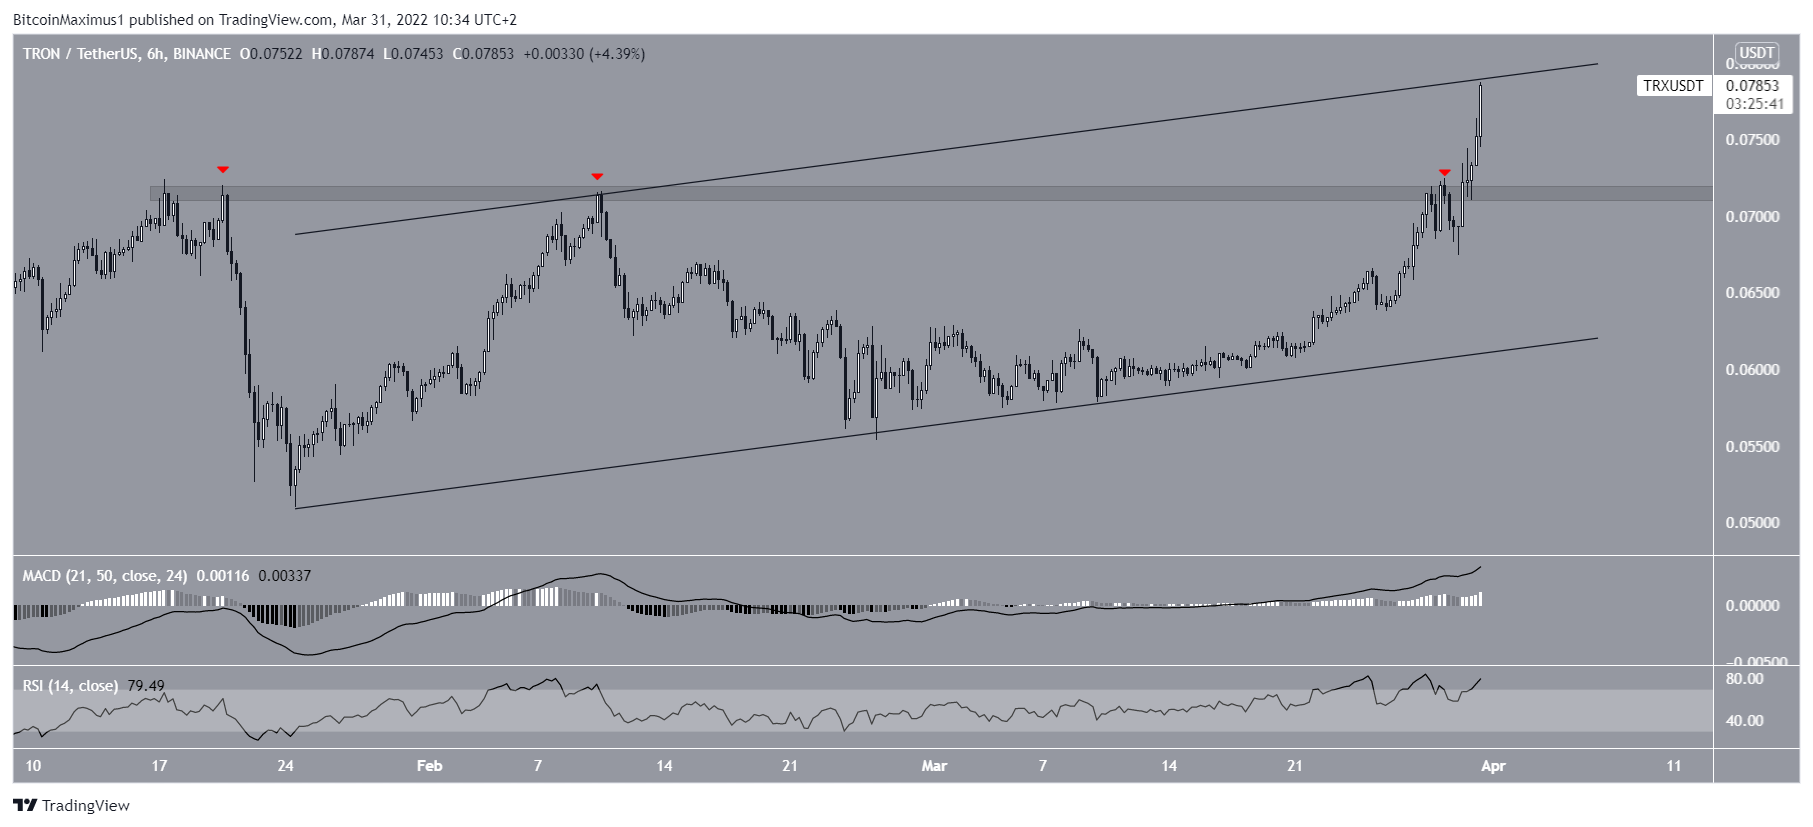
The six-hour chart shows TRX has broken out from the $0.0715 resistance area, which had been in place since Jan 16. The price broke out after three unsuccessful attempts.
Afterward, the price reached the resistance line of an ascending parallel channel that has been in place since Jan 24. A breakout above it would be expected to accelerate the rate of increase.
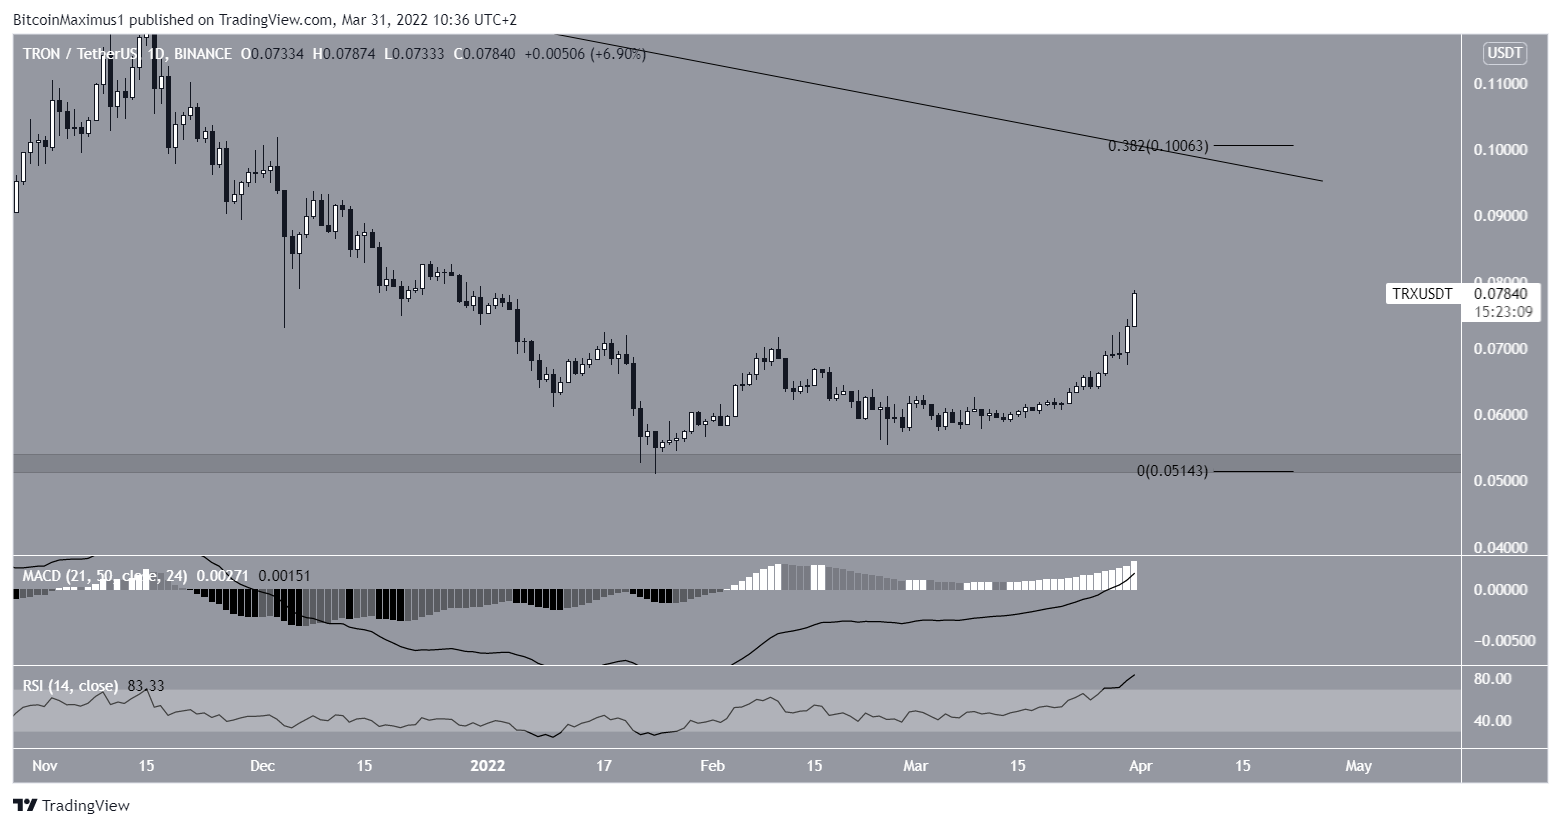
Furthermore, technical indicators in the daily time frame are also bullish. They support the possibility of a breakout from the channel and continuation of the upward movement towards $0.10.
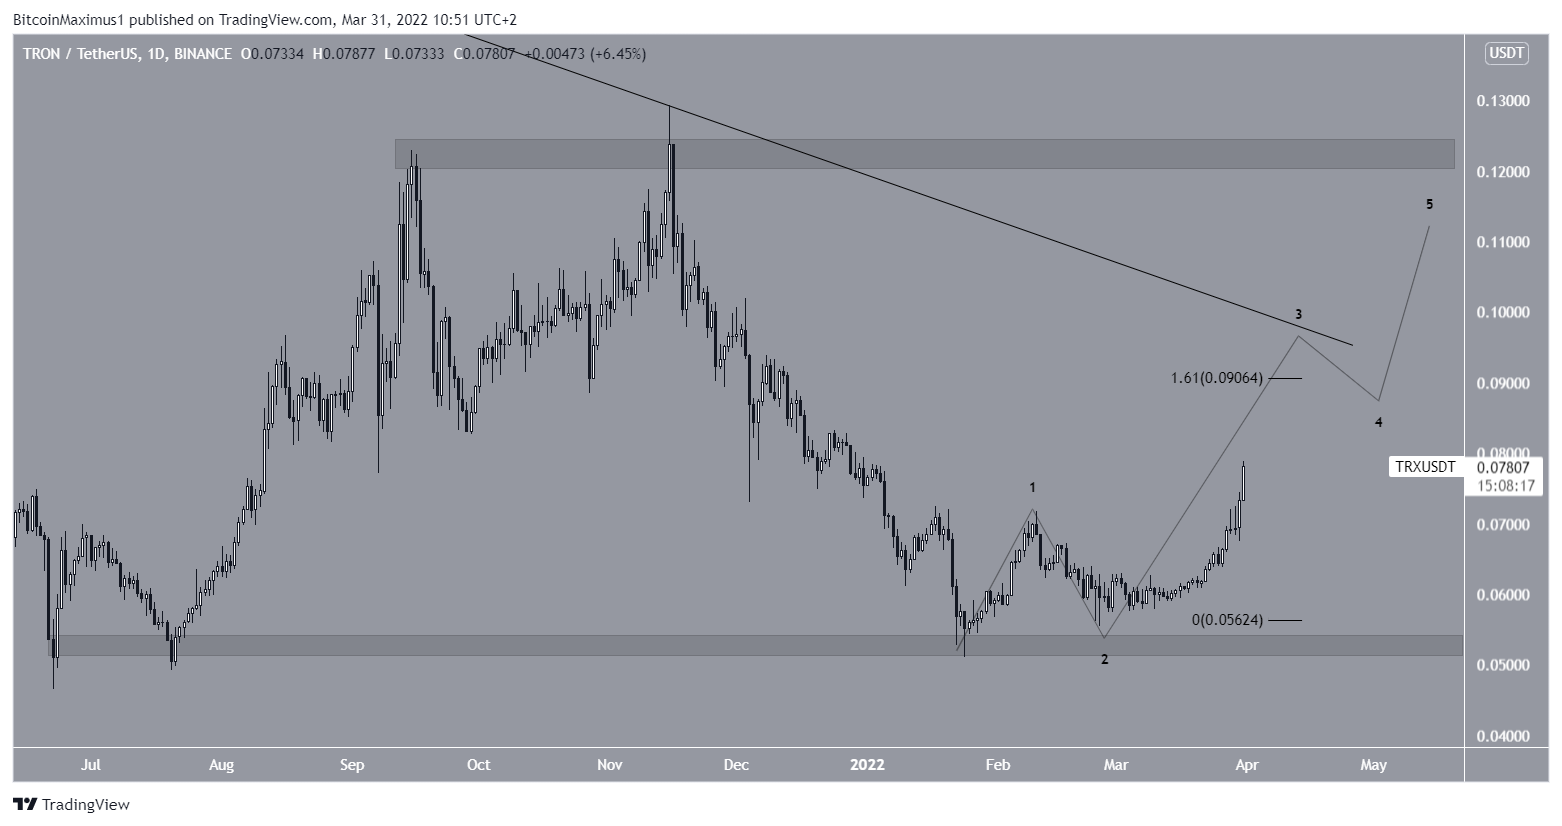
Wave count analysis
Cryptocurrency trader @AltstreetBet tweeted a chart of TRX, stating that he is expecting an acceleration of the upward movement in what is likely wave three.
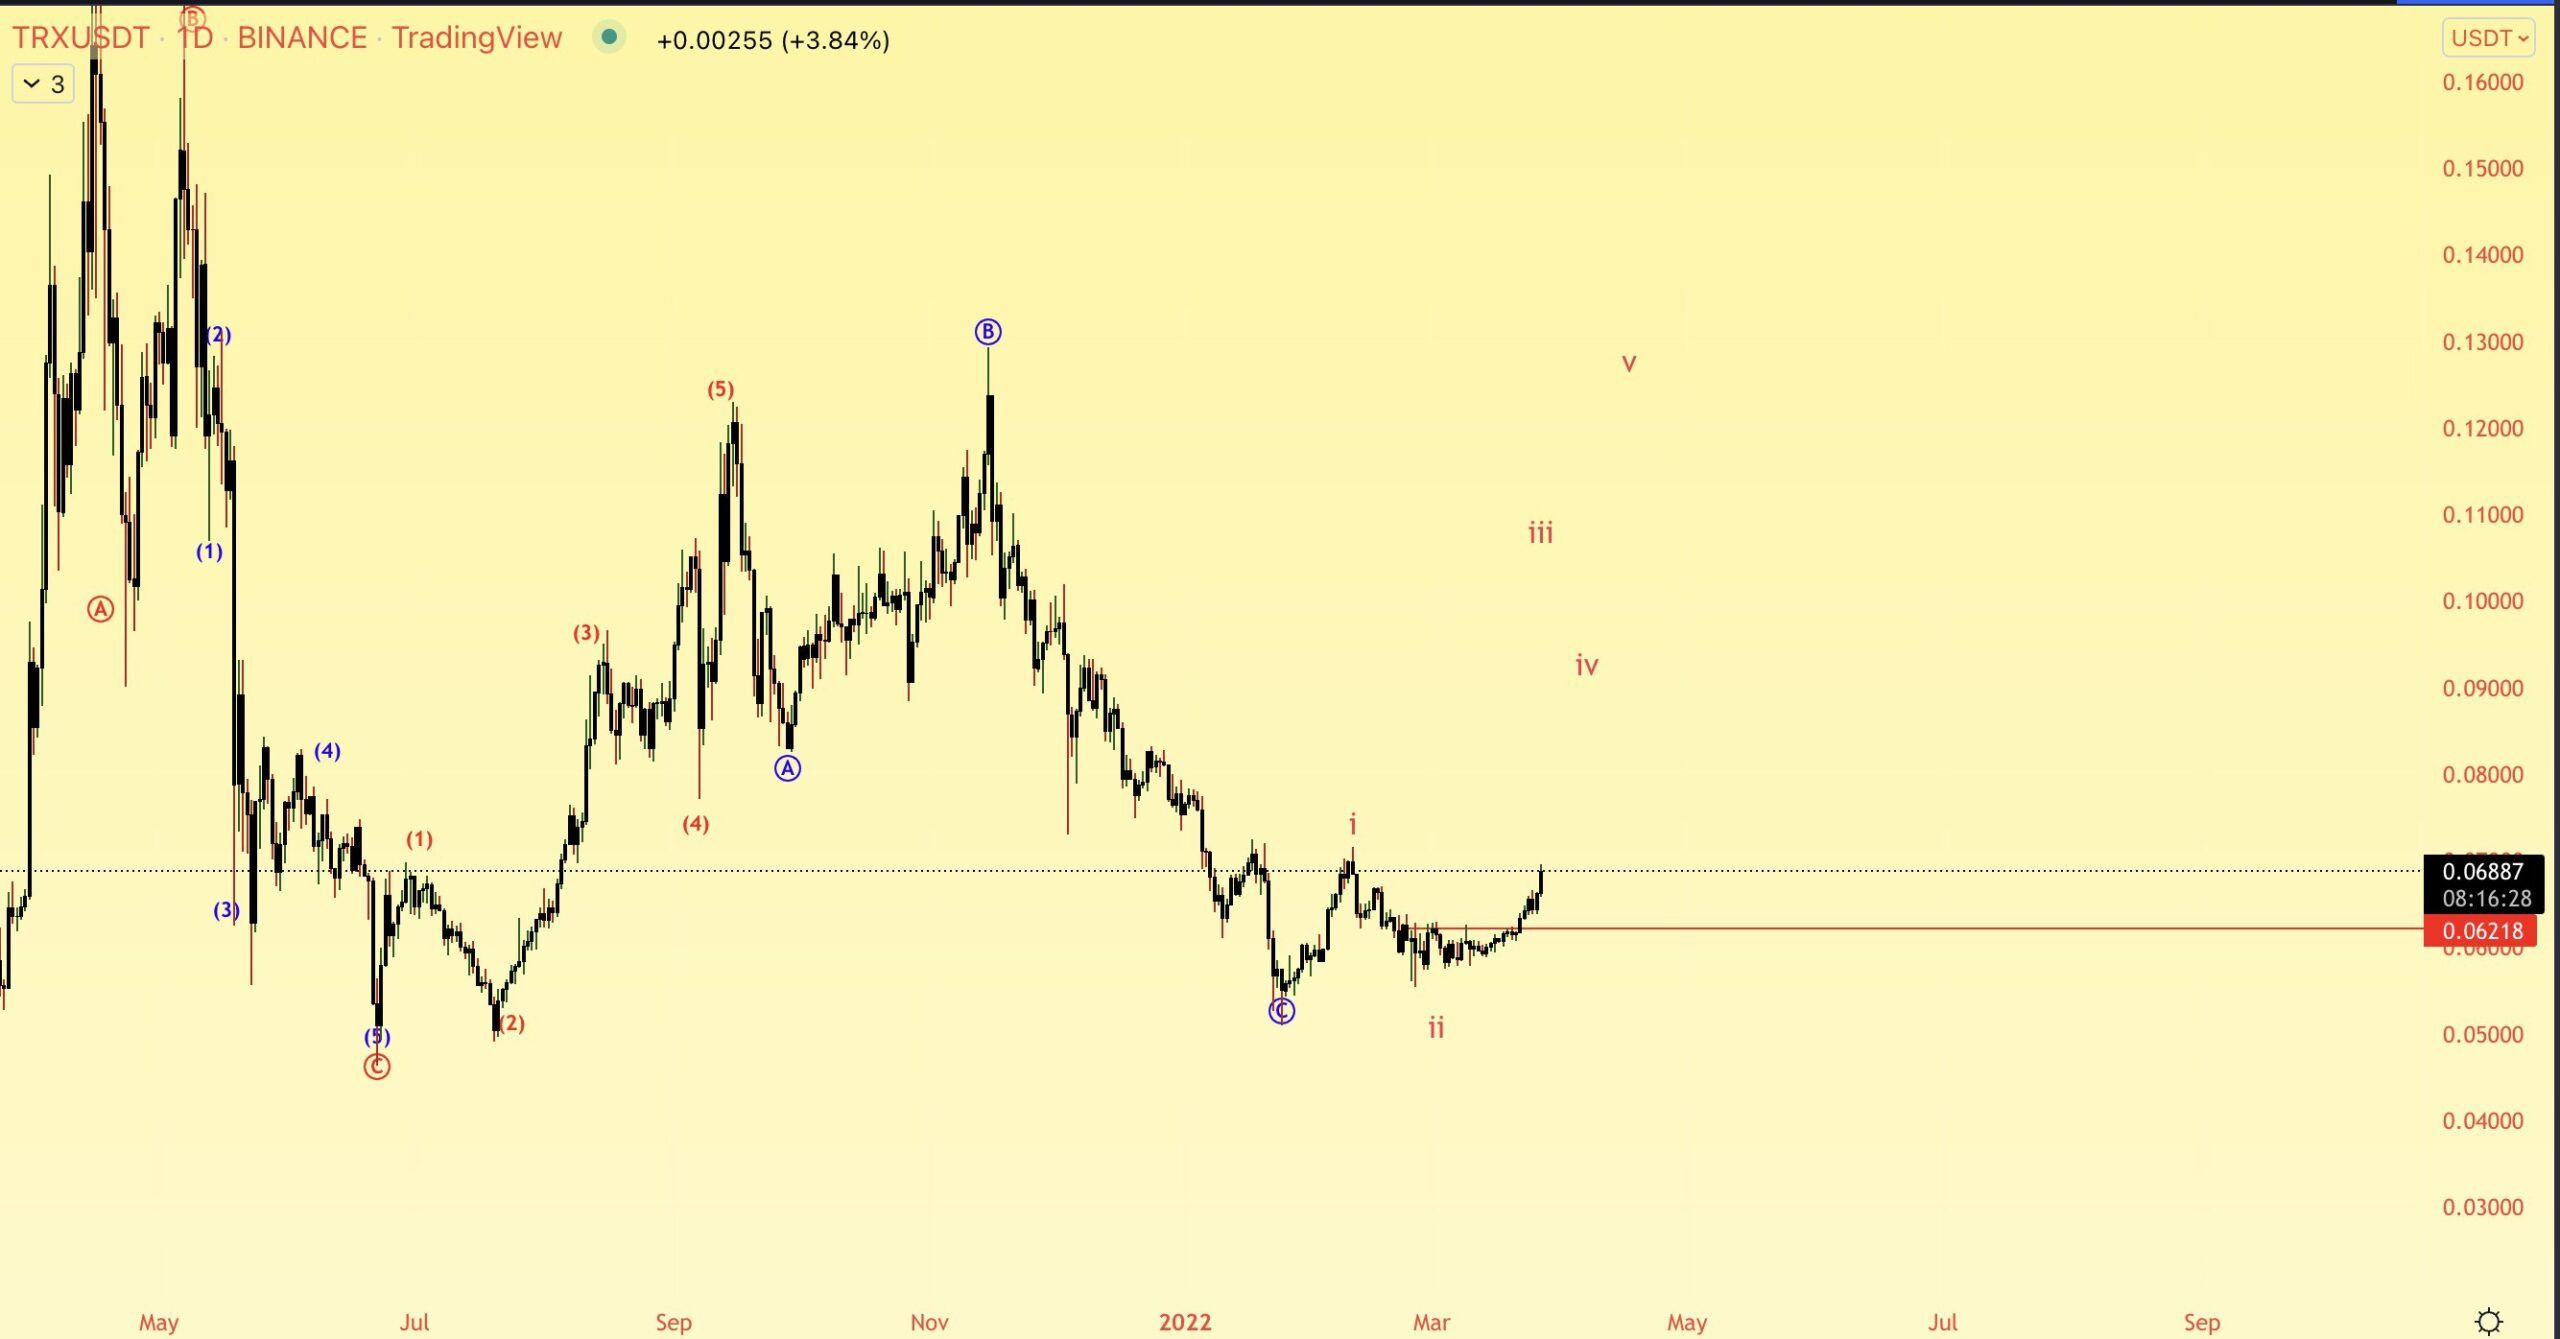
Since the tweet, TRX has resumed its upward movement in what could very well be wave three of a five-wave upward movement (black) that began on Jan 24. Measuring the length of wave one, wave three would be expected to go to at least $0.09. Potentially, it could reach the descending resistance line.
Afterward, wave five could cause a breakout from the line and potentially go all the way to the $0.125 resistance area.
For Be[in]Crypto’s previous Bitcoin (BTC) analysis, click here


