


On Jun 2, the TRON price reached a high of $0.041. A gradual increase ensued. Since then, TRX has made several lower highs and lows.
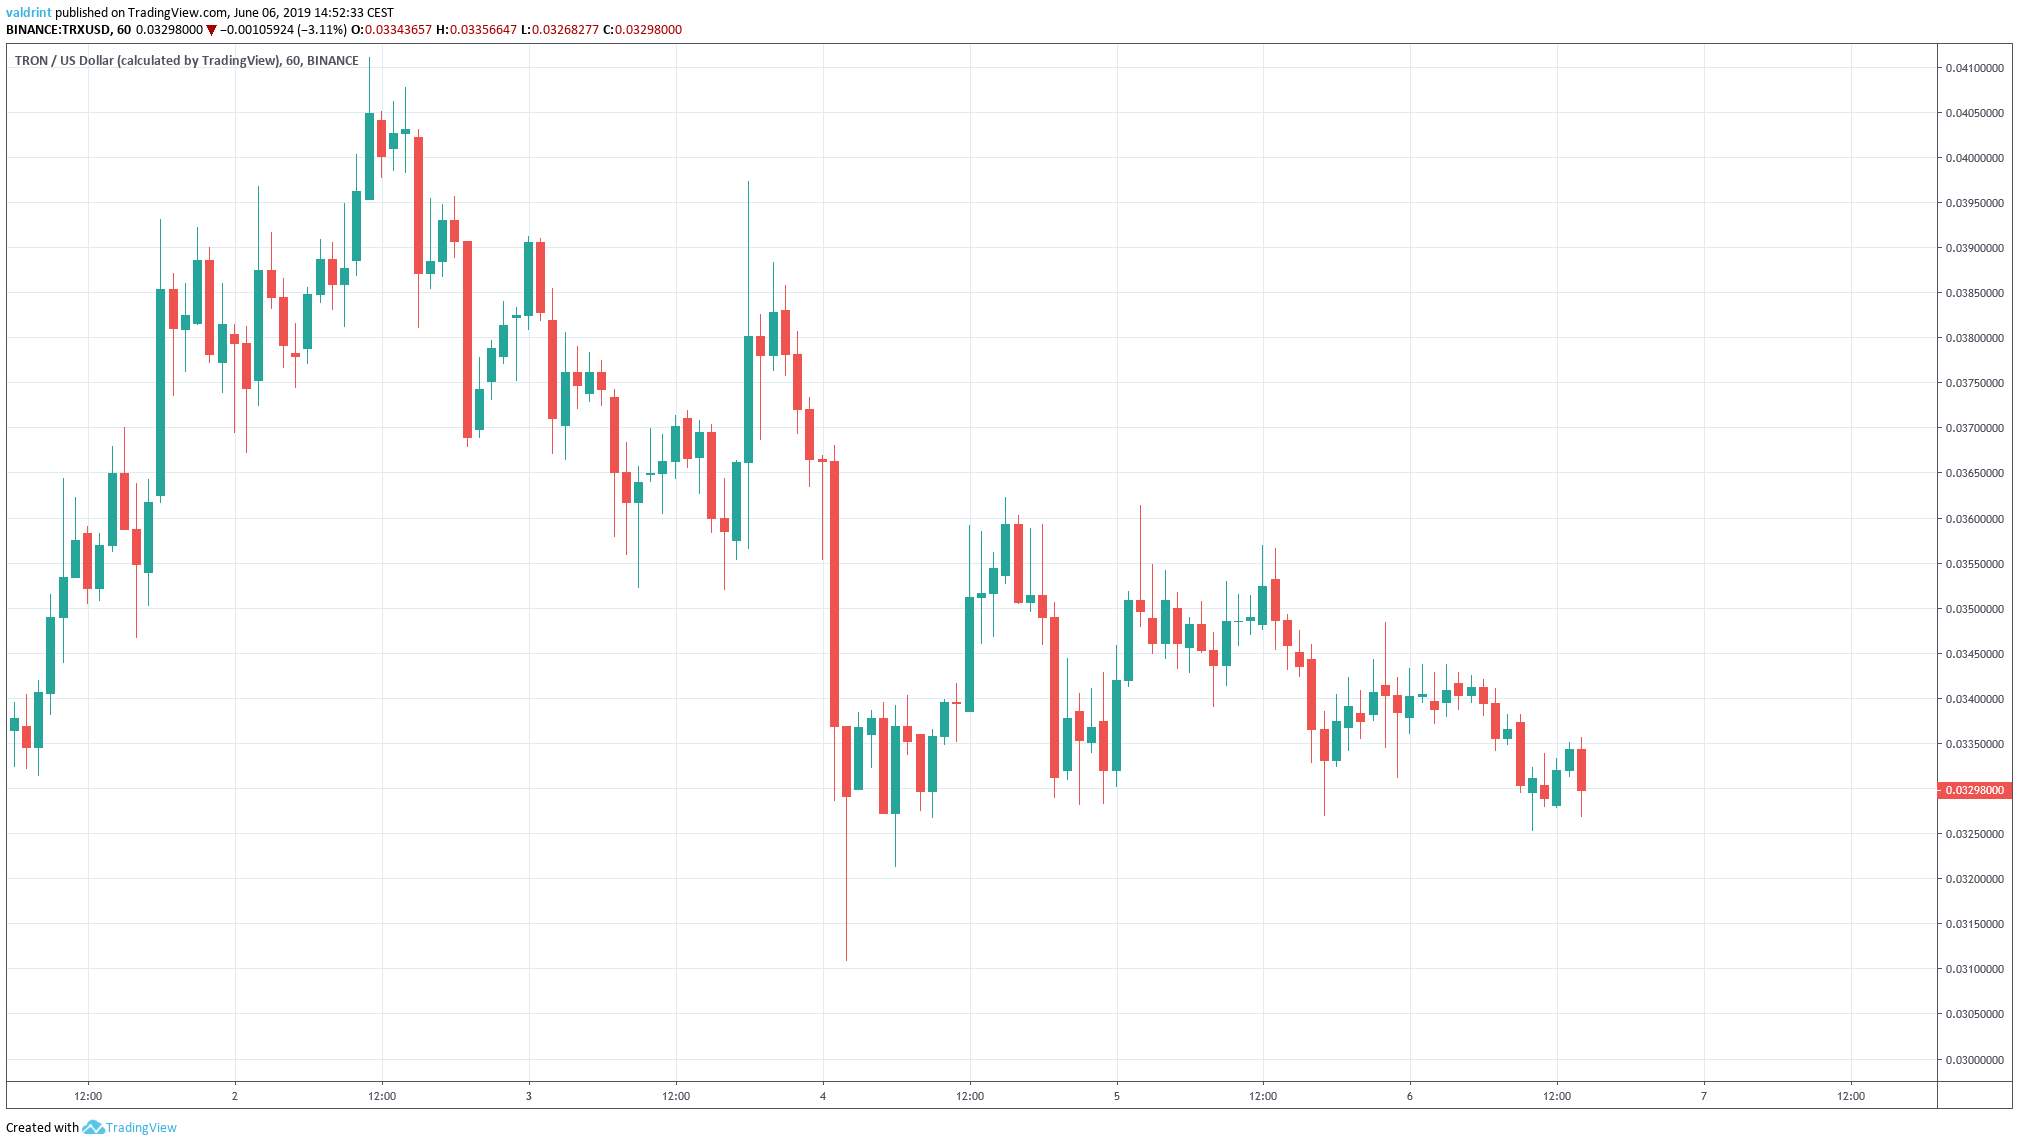
At the time of writing, the TRON price was trying to find support near $0.032.
In order to try and predict its future movements, we are going to analyze the price on different time-frames alongside technical indicators.
Tron (TRX) Price: Trends and Highlights for Jun 6
- The TRON price reached a high on Jun 2.
- It is trading inside a descending triangle.
- There is bearish divergence developing in the RSI.
- The moving averages have made a bearish cross.
- There is support near $0.03.
TRON Price: Descending Triangle
The price of TRX/USD is analyzed at one-hour intervals in order to trace its current pattern.
On Jun 2, the TRON price reached a high of $0.0411. A rapid downward move ensued. On Jun 4, the price made a low of $0.032.
Since then, it has been trading inside the descending triangle outlined below:
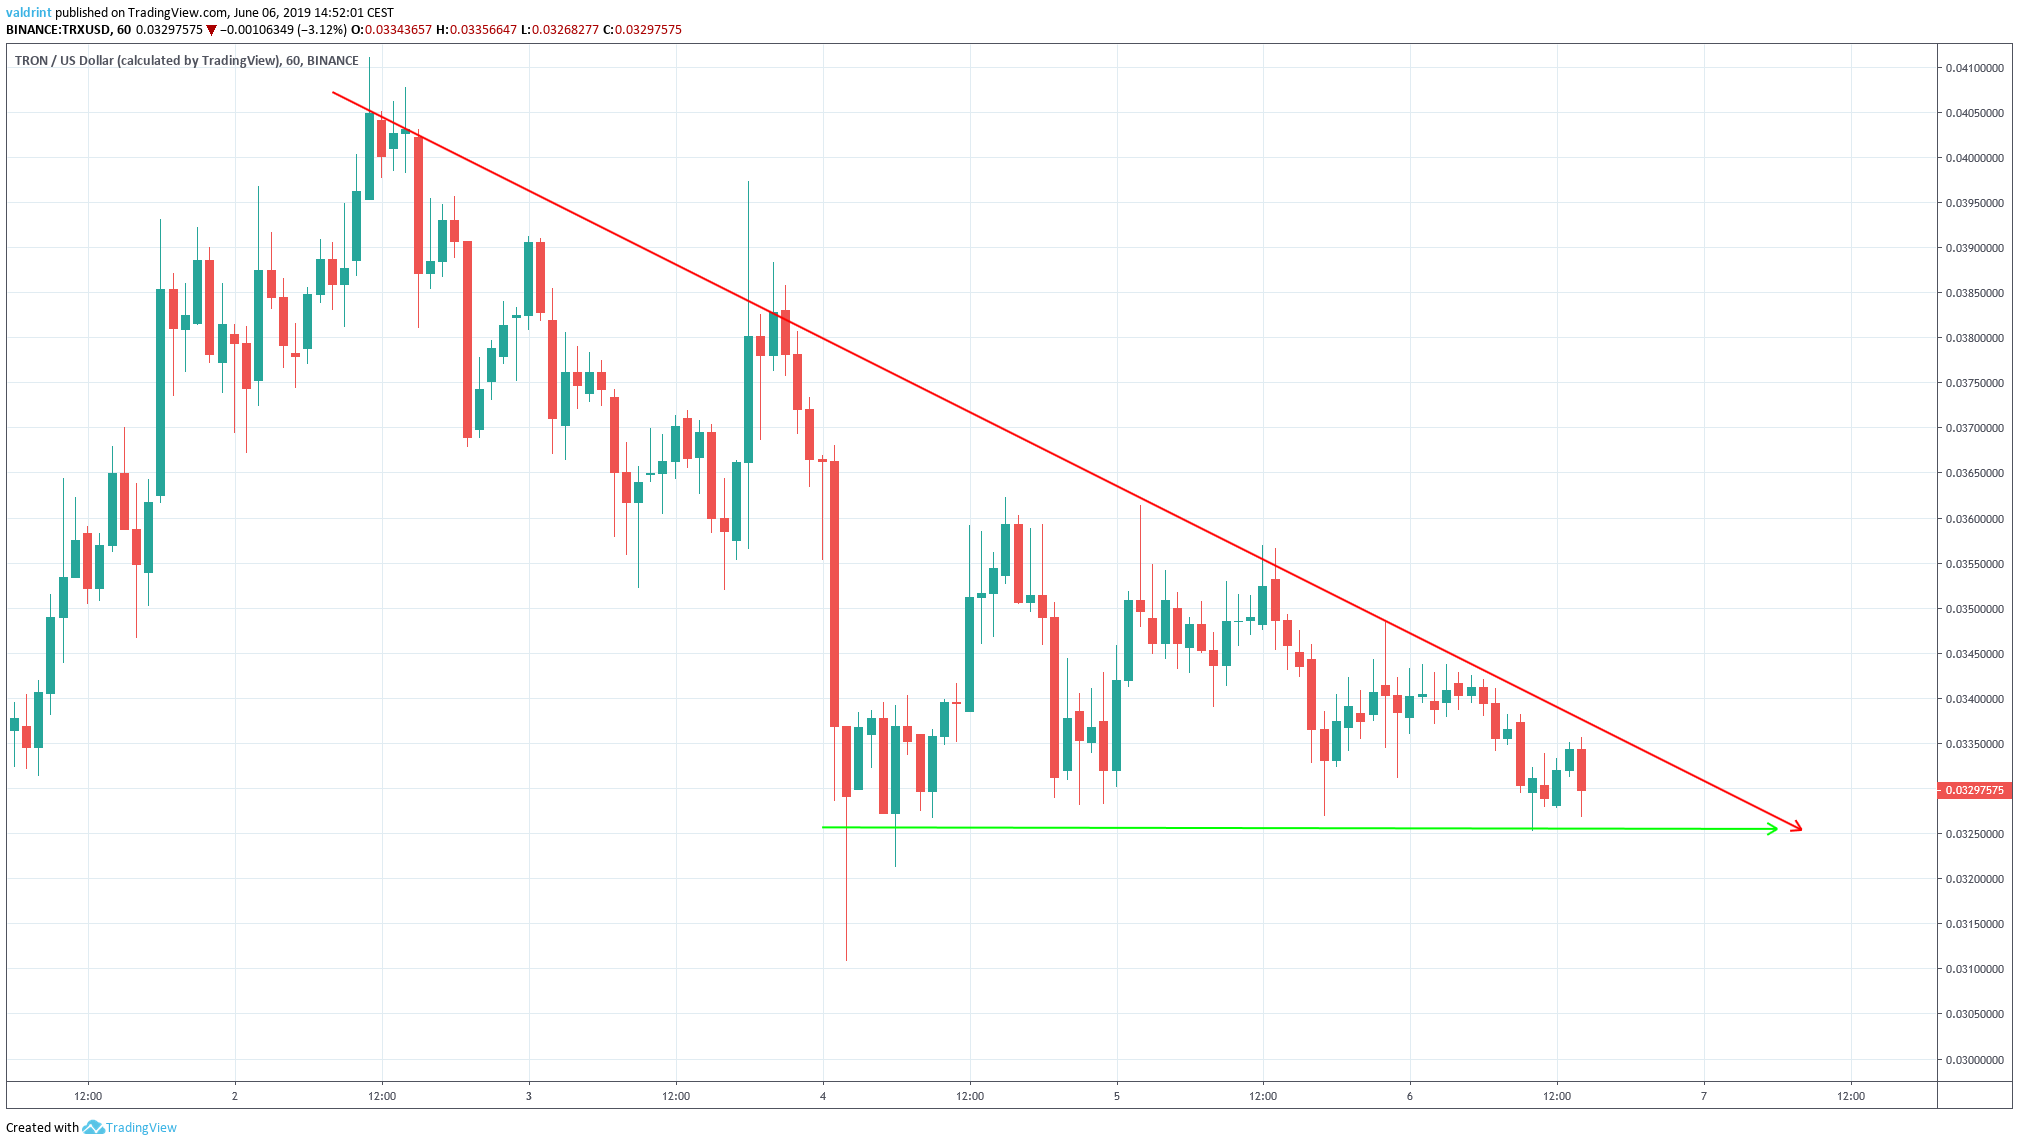
At the time of writing, it was trading very close to the support line of the triangle. It is also nearing the point of convergence between resistance and support lines.
Is a breakdown in store? Let’s look at some technical indicators and find out.
TRX Price: Moving Averages
The TRON price is analyzed at six-hour intervals alongside the RSI, the 10- and the 20-period moving averages (MA) below:
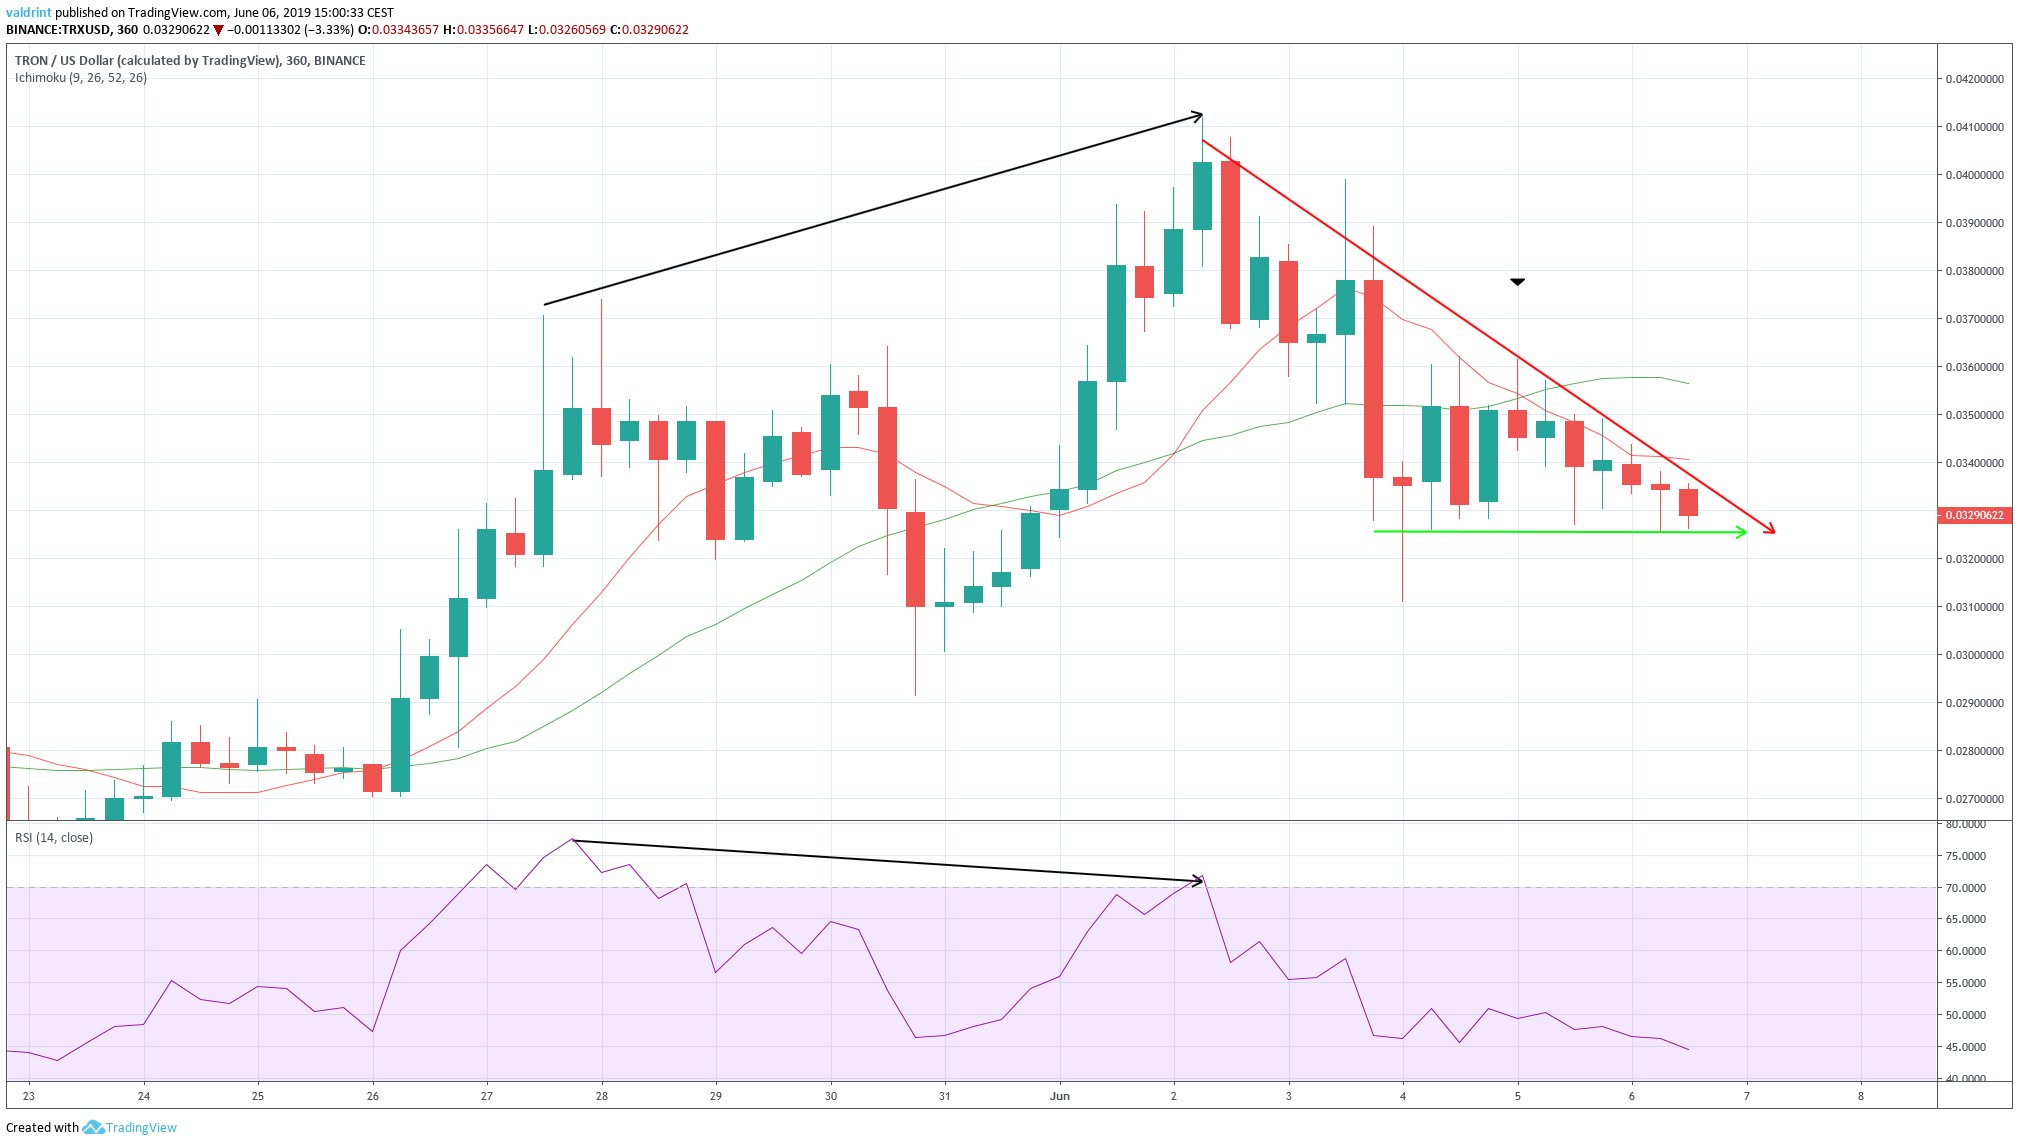
On May 28, the TRON price reached a high of $0.037. It continued to increase and reached a higher high of $0.040 on Jun 2. During this period, the RSI generated successive lower highs. This is known as bearish divergence and often precedes price decreases.
Furthermore, a bearish cross between the 10- and 20-period moving averages occurred on Jul 5. This often indicates that a downtrend has begun. Afterward, the 10-period MA offered very close resistance to the price.
The use of these indicators supports a breakdown from the triangle.
If that occurs, where will the price find support?
Reversal Areas
One support area is outlined below for TRX/USD.
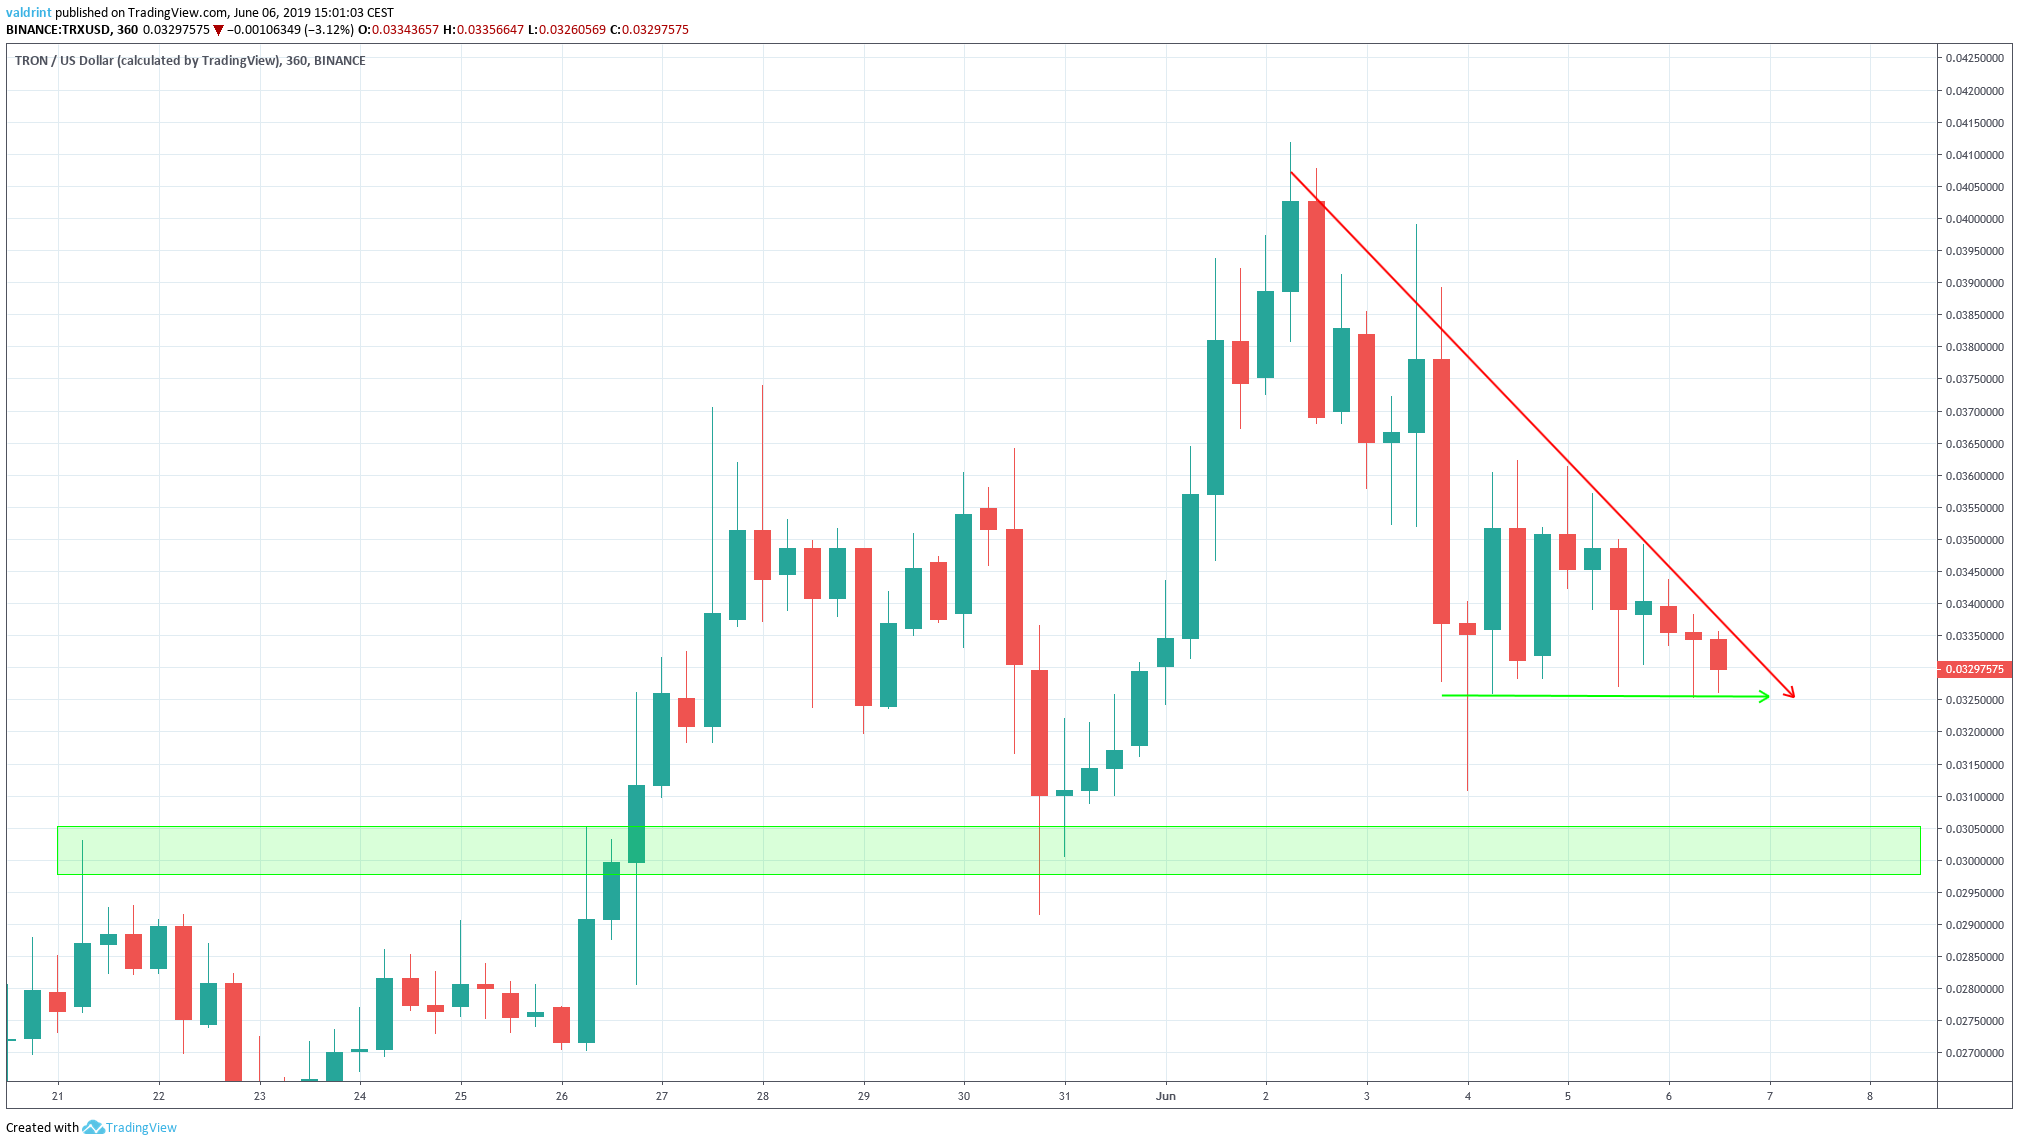
The closest support area is found near $0.03. If the TRON price breaks down from the triangle, it is likely to reach this area. The analysis of technical indicators supports this hypothesis.
Summary
The TRON price reached a high on Jul 2. Since then, it has been decreasing, trading inside a descending channel. The bearish divergence in the RSI and a bearish cross between the moving averages indicate that a breakdown is likely to occur.
What do you think of this altcoin analysis? Let us know in the comments below!
Disclaimer: This article is not trading advice and should not be construed as such. Always consult a trained financial professional before investing in cryptocurrencies, as the market is particularly volatile.


