


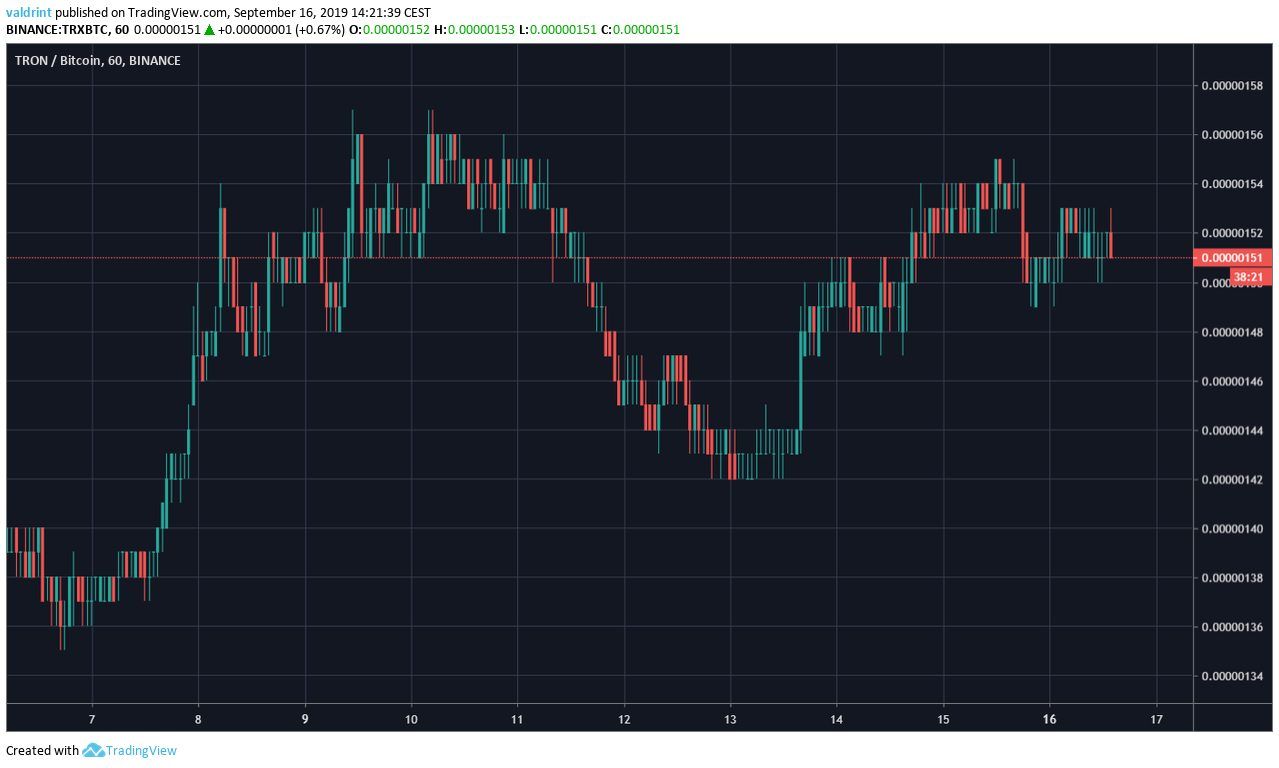
On September 7, 2019, the TRX price reached a low of 135 satoshis. An upward move followed, culminating with a high of 156 satoshis reached on September 10. The price has been decreasing since.
Will TRX initiate a reversal or are there further decreases in store? Keep reading below in order to find out.
For our previous analysis, click here.
TRON Price: Trends and Highlights for September 16
- TRX/BTC is trading inside a symmetrical triangle.
- It previously broke out above a descending resistance line.
- A bullish divergence has developed in the RSI & MACD.
- There is resistance near 165 and 180 satoshis.
Previous And Current Pattern
A look at the six-hour time-frame shows that TRX followed a descending resistance line since August 6.
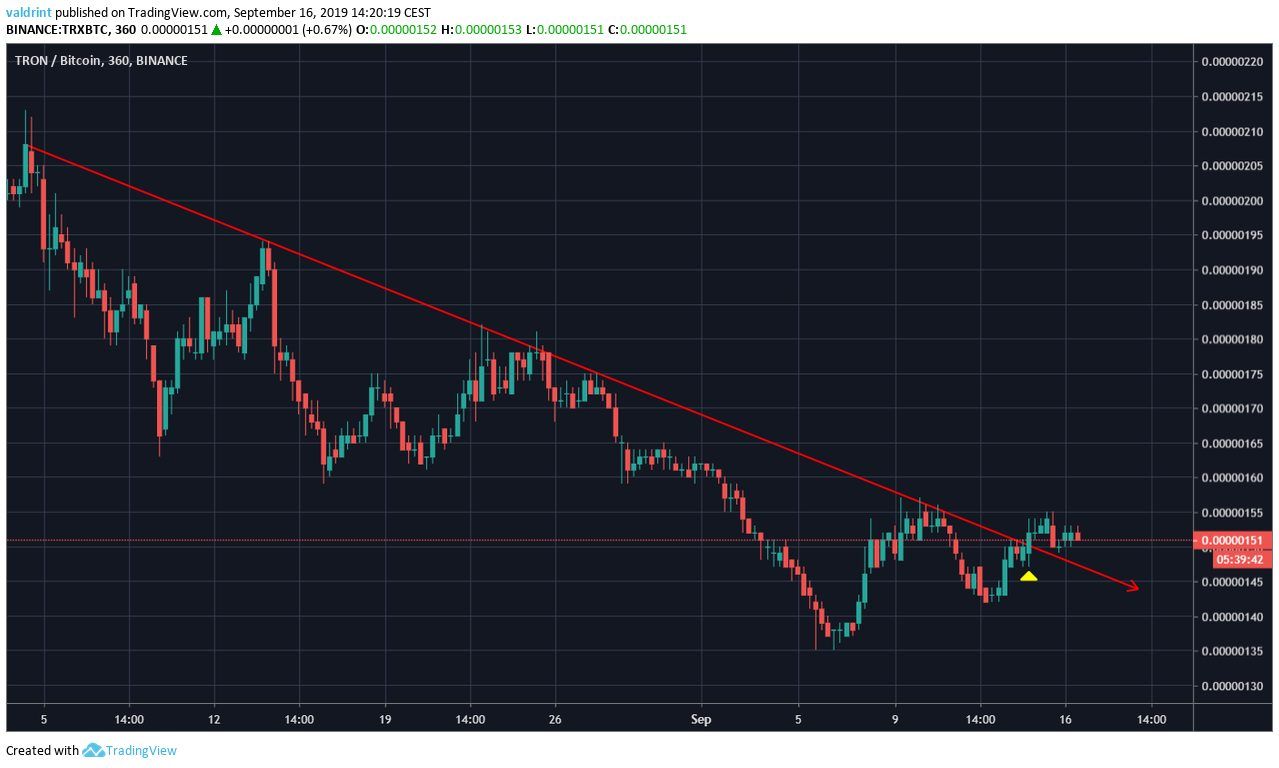
On September 15, the price broke out above this descending resistance line before validating it as support.
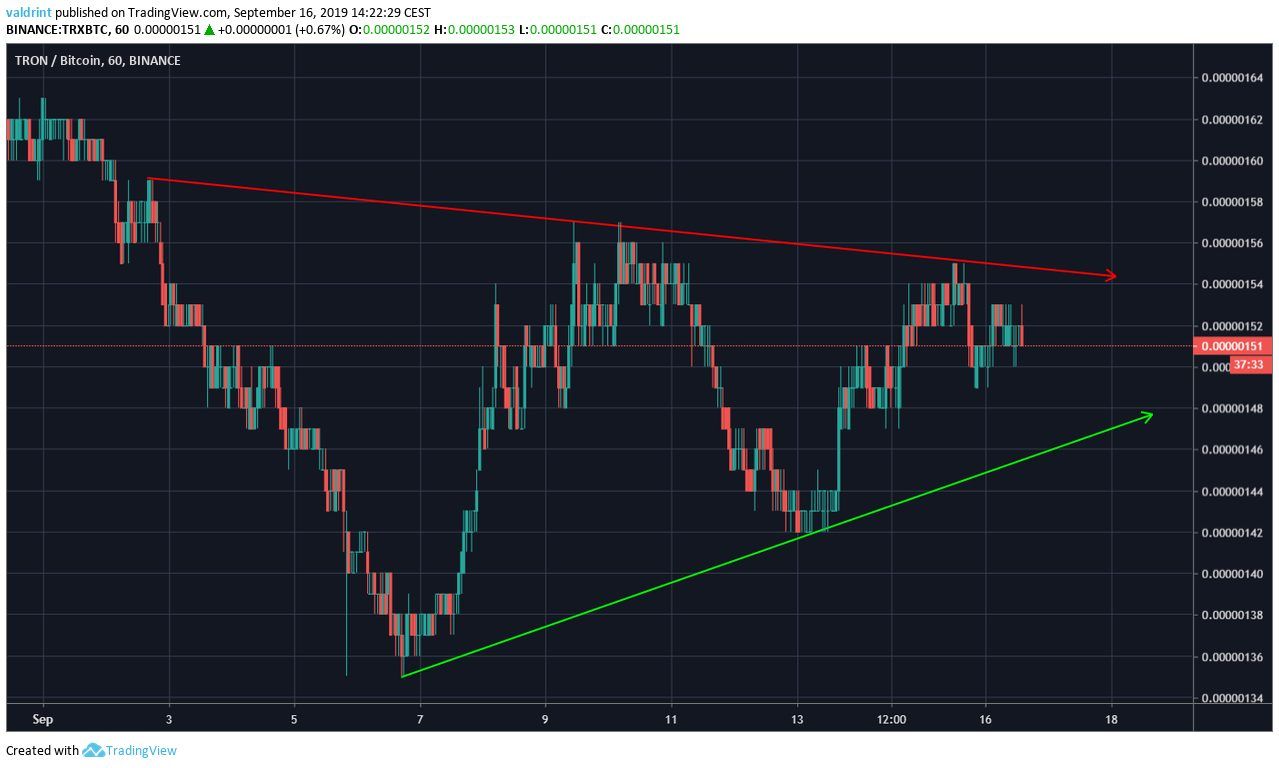
Afterward, it looks as if the price has been trading inside a symmetrical triangle.
While the resistance line has been validated three times, the support line has only been touched twice.
This allows for the possibility that the price will follow a support line with a different slope.
The symmetrical triangle is considered a neutral pattern, making a price breakout and breakdown equally likely.
Let’s take a look at technical indicators to see which one will occur.
Possible Breakout
A look at the daily RSI and MACD suggests that the Tron price is preparing to initiate an upward move.
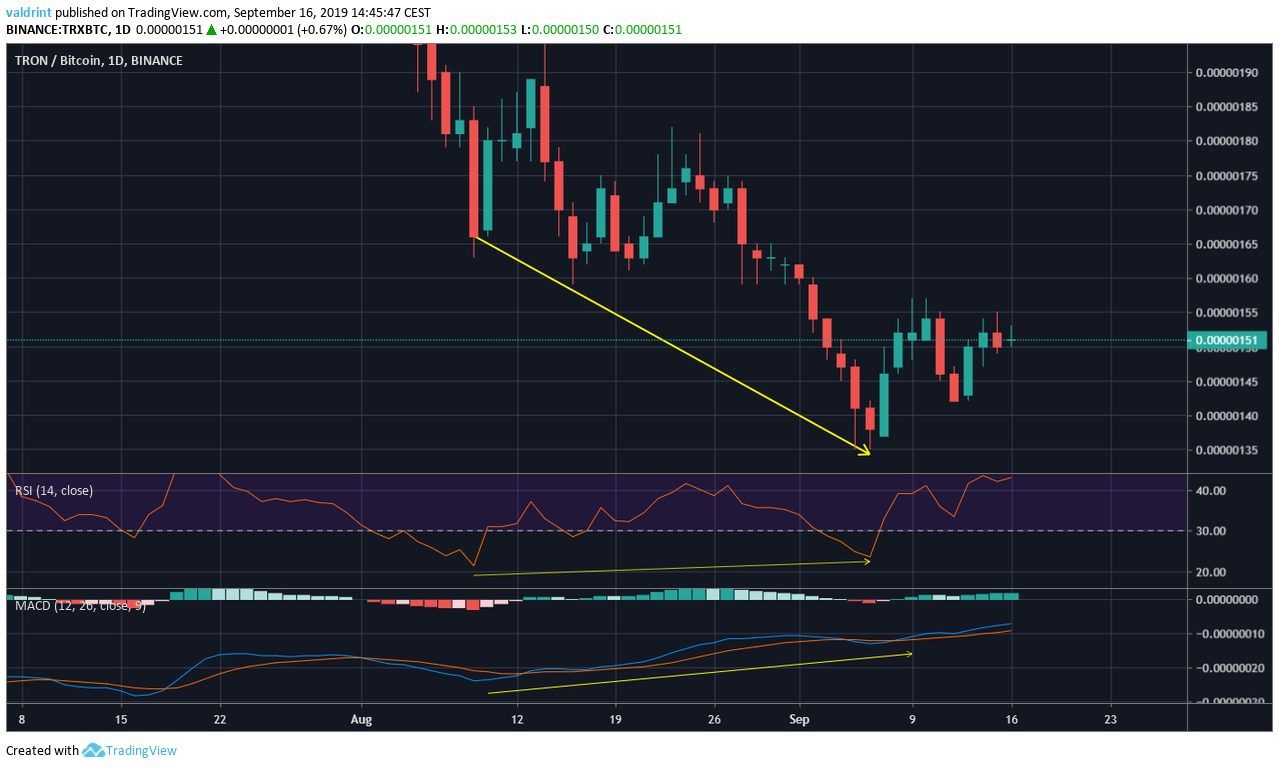
Both have been generating bullish divergence since the beginning of August.
Additionally, an upward move has yet to be initiated as a result of the divergence.
This makes us believe that TRX will soon initiate an upward move and break out from the symmetrical triangle.
After The Breakout
If the price breaks out from the triangle, two resistance areas are outlined below.
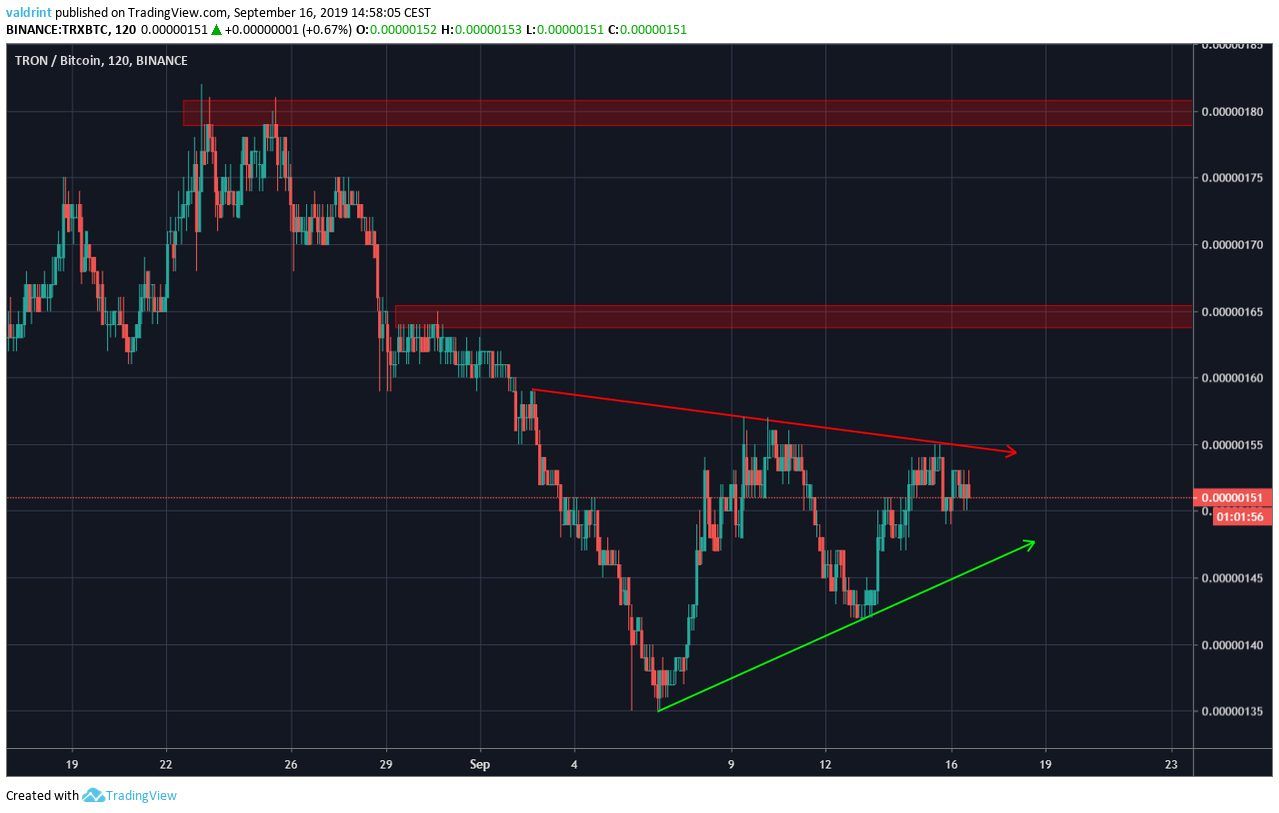
They are found at 165 and 180 satoshis respectively.
We believe that the price will reach at least one of these areas.
Tron Price Summary
The TRX price is trading inside a symmetrical triangle.
According to our analysis, it is likely to break out and reach the resistance area outlined above.
For hypothetical trading purposes, we consider TRX a buy close to 147 satoshis.
We recommend a stop loss below 140 satoshis.
Do you think TRX will break out from the triangle? Let us know in the comments below.
Disclaimer: This article is not trading advice and should not be construed as such. Always consult a trained financial professional before investing in cryptocurrencies, as the market is particularly volatile.
Images are courtesy of Shutterstock, TradingView.


