


Since the beginning of 2018, the price of Tron (TRX) has been fluctuating wildly. Highs of 2000, 1000 and 850 satoshis were reached on January, May and December 2018.
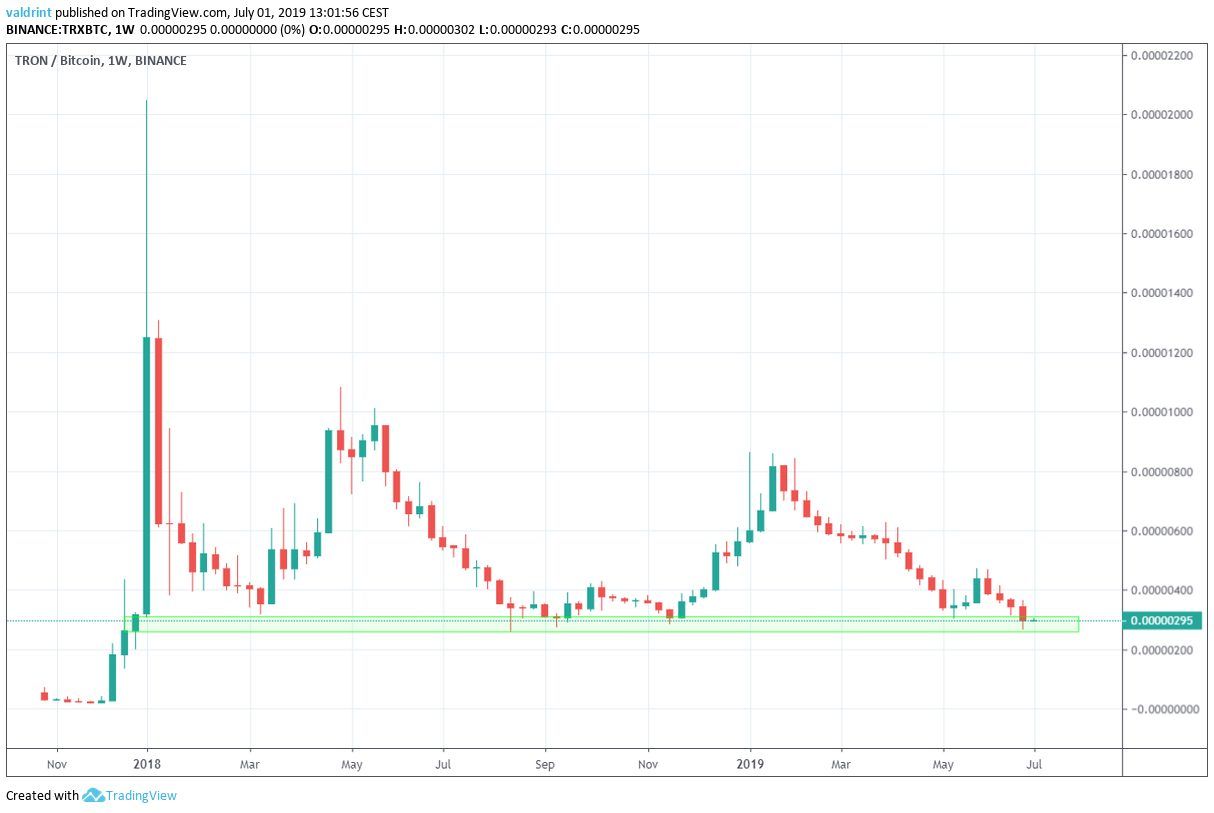
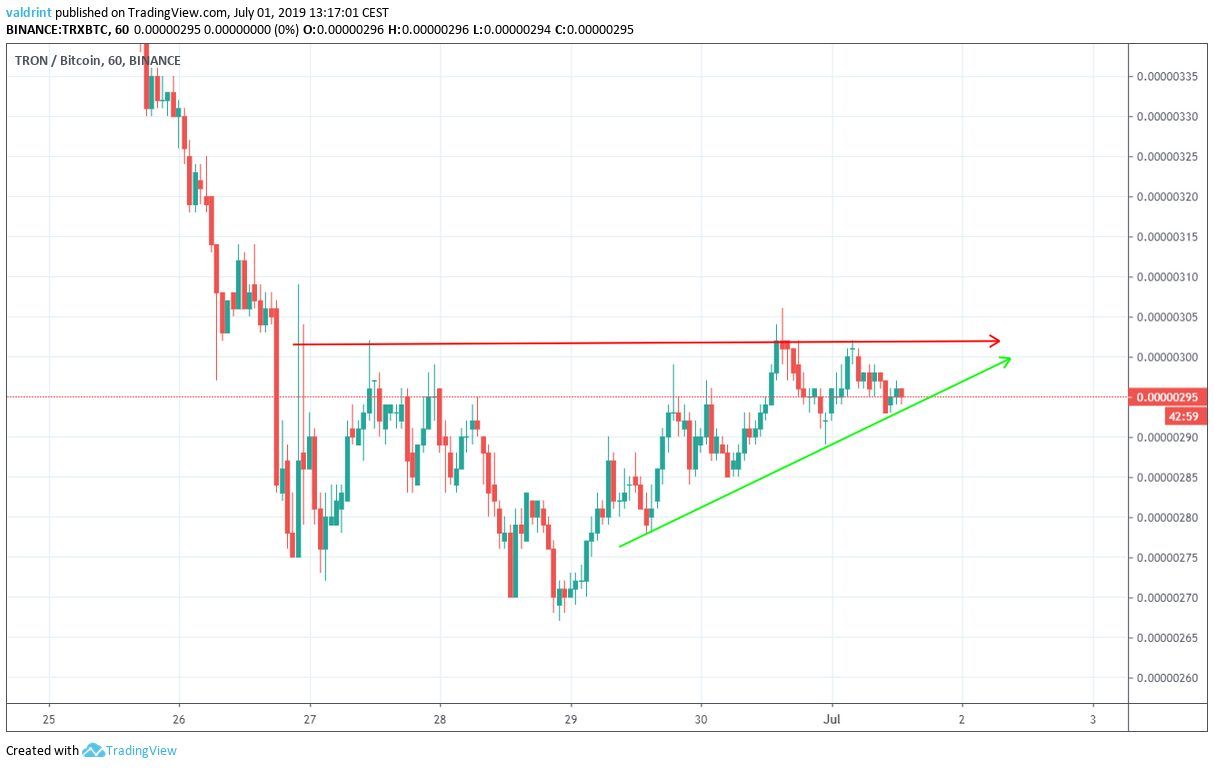
After every high, however, decreases have ensued. The TRX price has made a low between 290 and 300 satoshis each time.
At the time of writing, it was currently trading at the same level.
Will it again begin an upward move? Let’s find out.
TRON Price: Trends and Highlights for June 1
- The price is following a descending resistance line.
- There is support between 290 and 300 satoshis.
- There is bullish divergence developing in both the RSI and the MACD.
- The moving averages have made several bearish crosses.
- The price is trading inside a short-term ascending triangle.
TRON Price: Descending Resistance Line
A gradual decrease has ensued since and the price has been following the descending resistance line outlined below.
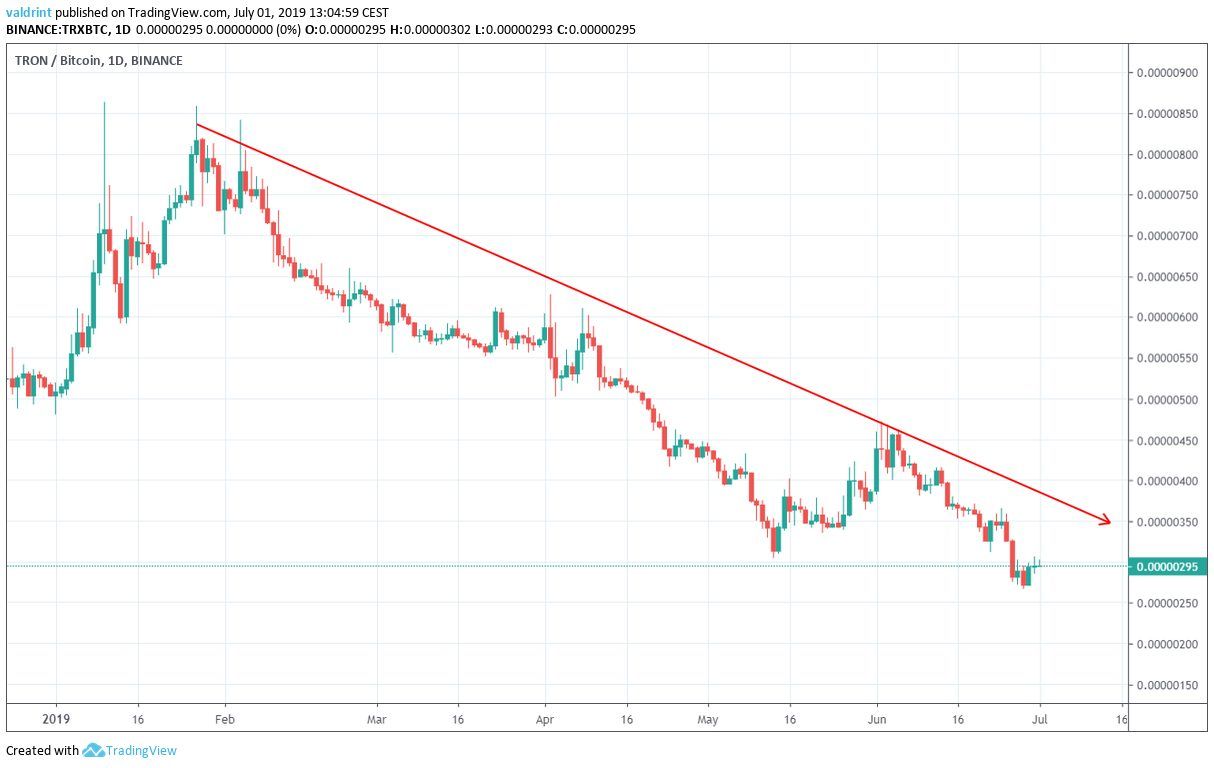
So far, it has made three unsuccessful attempts at a breakout.
While it is not following any support line, the price is trading inside the long-term support area between 290 and 300 satoshis.
Technical Indicators
On May 13, the TRON price made a low close to 300 satoshis. It made a lower low of 280 satoshis on July 30.
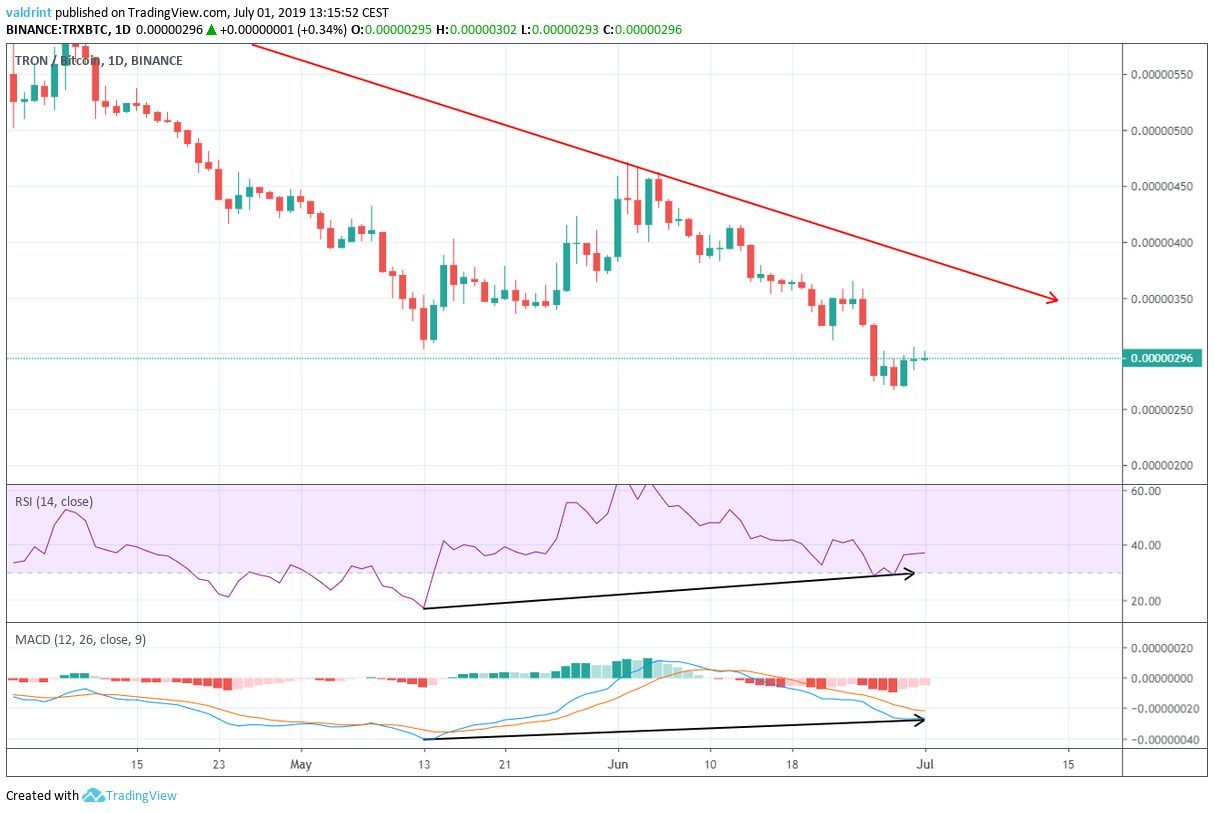
During this period, the RSI and the MACD generated higher lows. This is known as bullish divergence and often precedes price increases.
The divergence is significant and occurring in both indicators. Furthermore, it is occurring inside a long-term support area.
But, as stated above, the TRX price is not following a long-term support line, making the use of this divergence trickier — especially if looking to initiate a trade.
While the RSI and the MACD indicate that an upward move may soon begin, the moving averages (MA) show that the price is still in a downtrend.
The 100- and 200-period MAs made a bearish cross on May 17. The short term 10- and 20- period MAs did the same on June 16.
This means that the TRON price is still in a downtrend, both in the long- and short-term.
While the momentum indicators show that the price could soon begin an uptrend, the MAs indicate that we still have not broken out of the previous downtrend.
Short-Term
In the short-term, we can see that the TRON price is trading inside of an ascending triangle.
The ascending triangle is a bullish pattern.
Combined with our previous analysis, we can come to the conclusion that it is likely that the price will break out from this triangle.
If it does, it is likely to find resistance near 325 satoshis — a resistance found by the 0.618 fib level of the entire drop.
A similar target is also given by projecting the height of the triangle to its breakout point.
Combining the analysis from these different time-frames, we can come to the conclusion that the TRON price is not likely to decrease below the significant support area between 290 and 300 satoshis.
To the contrary, it may soon begin a short-term upward move.
Summary
The price of TRX has fallen to a major support area. We have not seen lower prices since the beginning of 2018.
The technical indicators give conflicting readings on whether to be bullish or bearish. In the short-term, however, due to the creation of a bullish pattern, it is likely that the price will begin an upward move.
What do you think will happen to the price of TRX? Let us know in the comments below!
And if you’re interested in trading Bitcoin (BTC), Ethereum (ETH), Litecoin (LTC), Bitcoin Cash (BCH) or XRP on our partner exchange, check out this link to get all set up at XCOEX.
Disclaimer: This article is not trading advice and should not be construed as such. Always consult a trained financial professional before investing in cryptocurrencies, as the market is particularly volatile.
Images are courtesy of Shutterstock, TradingView.


