


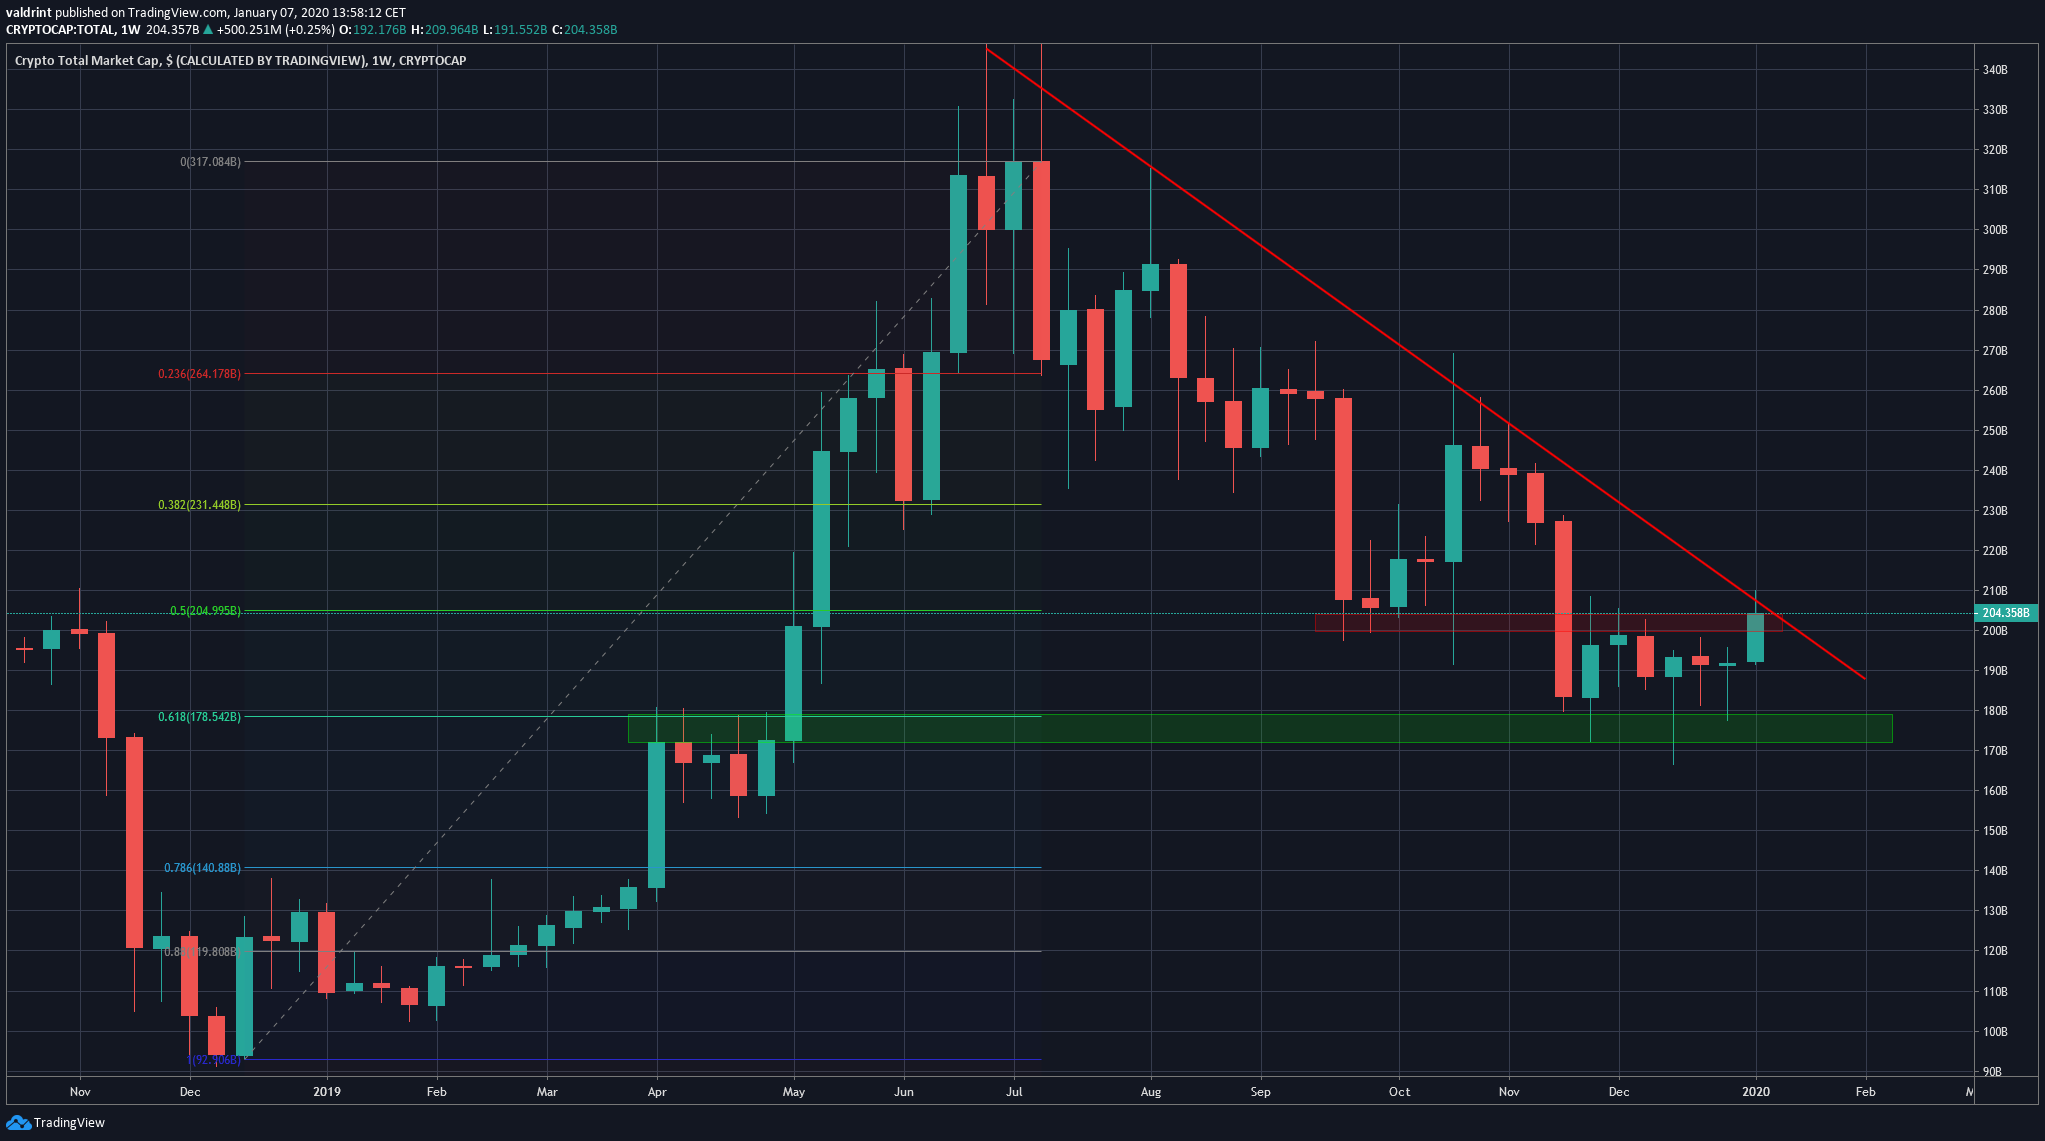
The total cryptocurrency market cap bounced at the $175 billion support area before beginning an upward move that is still ongoing.
The price has reached the descending resistance line in place since June 24. Cryptocurrency analyst and trader @cryptobombshell outlined this resistance line and stated that the total cryptocurrency market cap has reached a resistance area, and she believes the price will continue downward.
https://twitter.com/cryptobombshell/status/1213978648224645126?s=19
Will the market cap break out above this resistance area, or will it continue downward, as stated in the tweet? Keep reading below if you are interested in finding out.
Cryptocurrency Market Cap Long-Term Movement
The total market cap has been decreasing since June 24. Once it reached the $175 billion support area, which coincides with the 0.618 fib level, it began to increase. This is an important area for the price since it acted as resistance in April/May 2019, and the price created several long lower wicks once it got there the second time, a sign of buying pressure.
It is currently at the descending resistance line, which is also the 0.5 fib level and the previous breakdown level at $223 bn. A breakout above this descending resistance line would likely indicate that the correction is over. There are two main reasons for that :
- A breakout above a long-term descending resistance line indicates that the downward trend is over.
- Failure to sustain lower price levels after a breakdown often indicates a reversal.
RSI
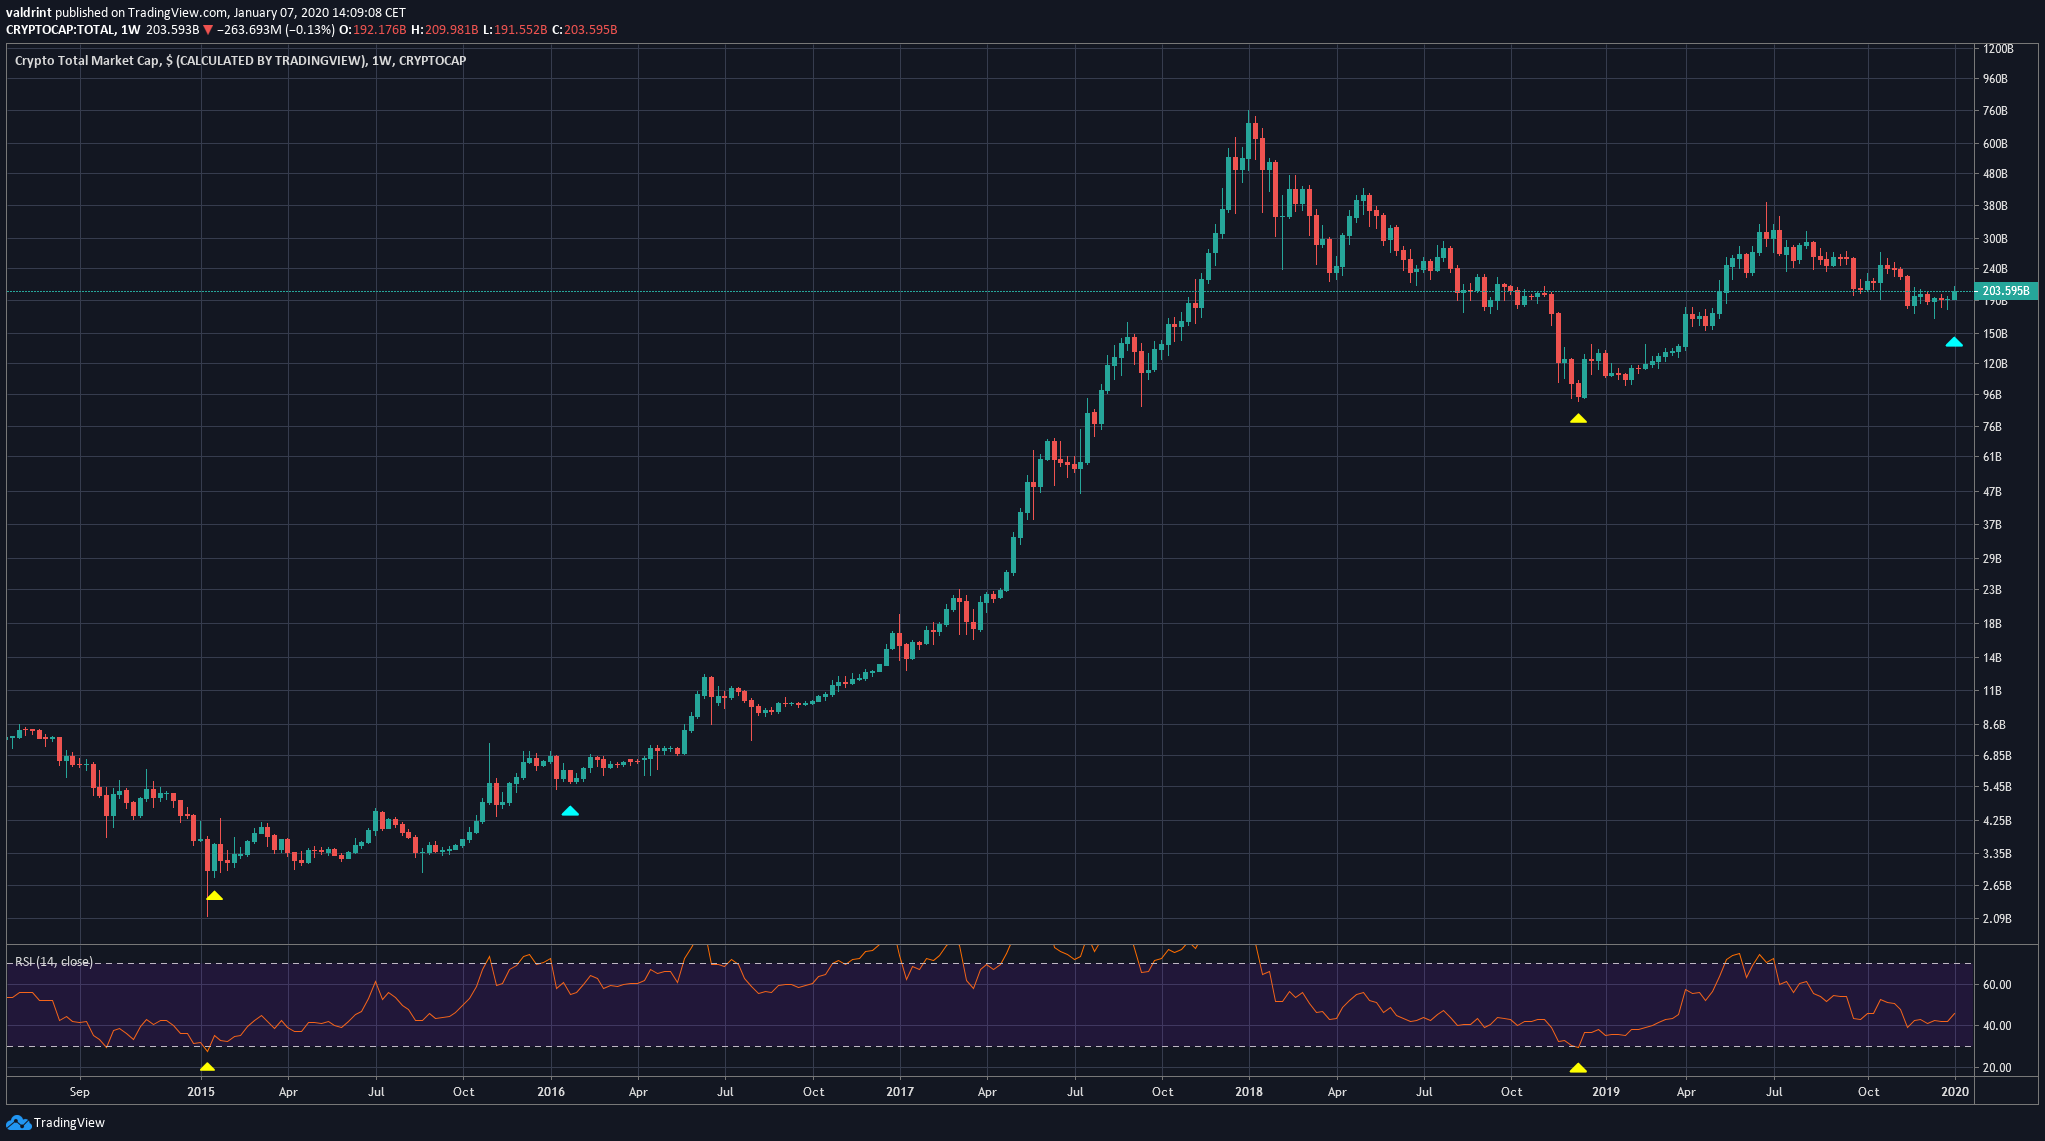
The weekly RSI reveals that the total cryptocurrency market cap in December 2018 could be in a similar position to January 2015, right before the price began a three-year upward trend.
December 2018 and January 2015 are the only two times that the weekly RSI has been oversold. If so, the current price movement should be similar to that after January 2016, meaning that the price is finishing a retracement before beginning a bull market at an accelerated rate of increase.
Short-Term
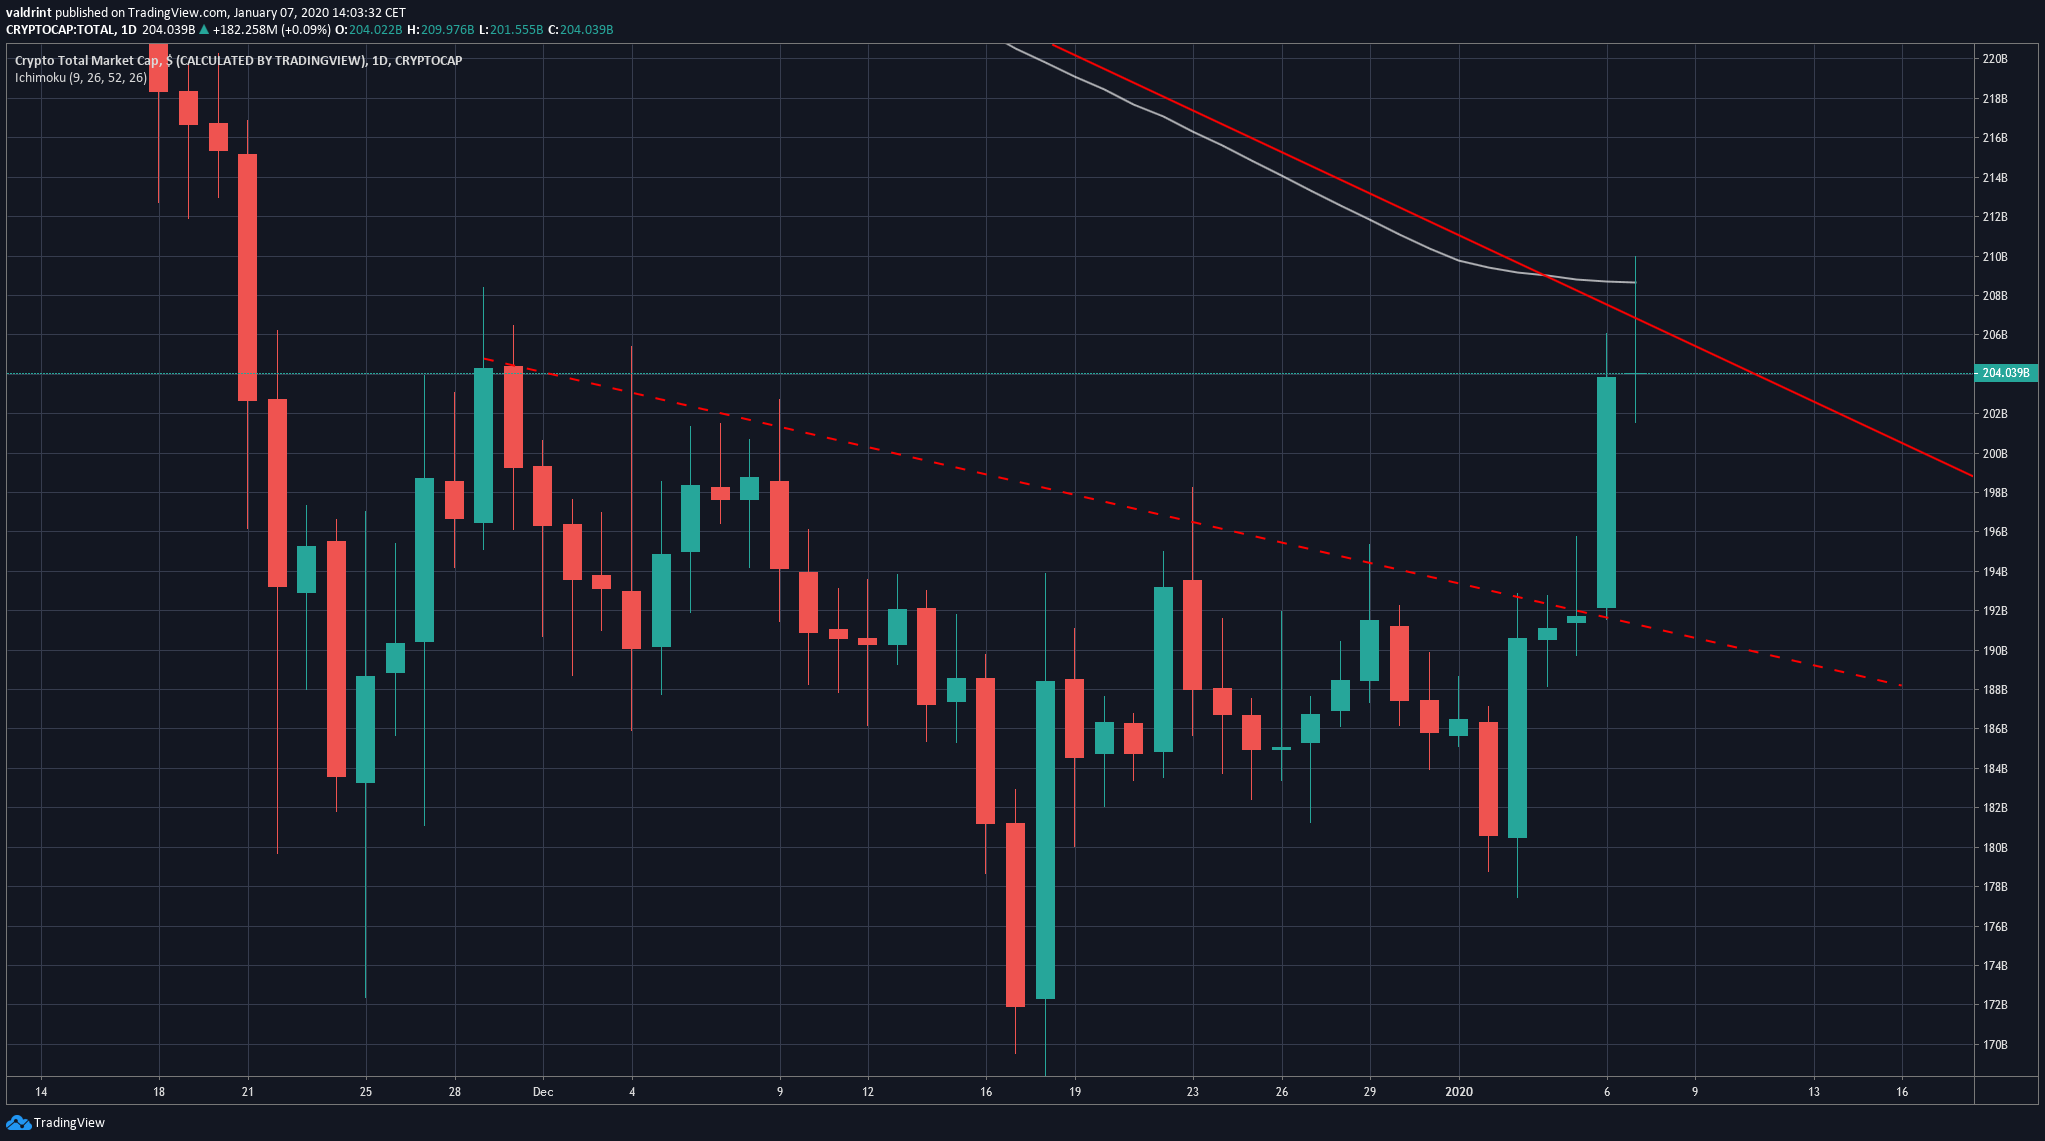
In the short-term, clean break above a descending resistance line, which led to the longer-term one. Additionally, the resistance is strengthened by the 100-day moving average.
So, we could definitely see the market cap returning to validate the short-term descending resistance line before making another attempt at a breakout.
A breakdown below the support at $175 bn would invalidate the possibility that the downtrend has ended and indicate that the cap will make lower lows.
To conclude, the total market cap has bounced at a significant area and is attempting to reclaim the previous breakdown level. If it is successful in doing so, it would indicate that the downtrend is over and a new bullish trend has begun.


