
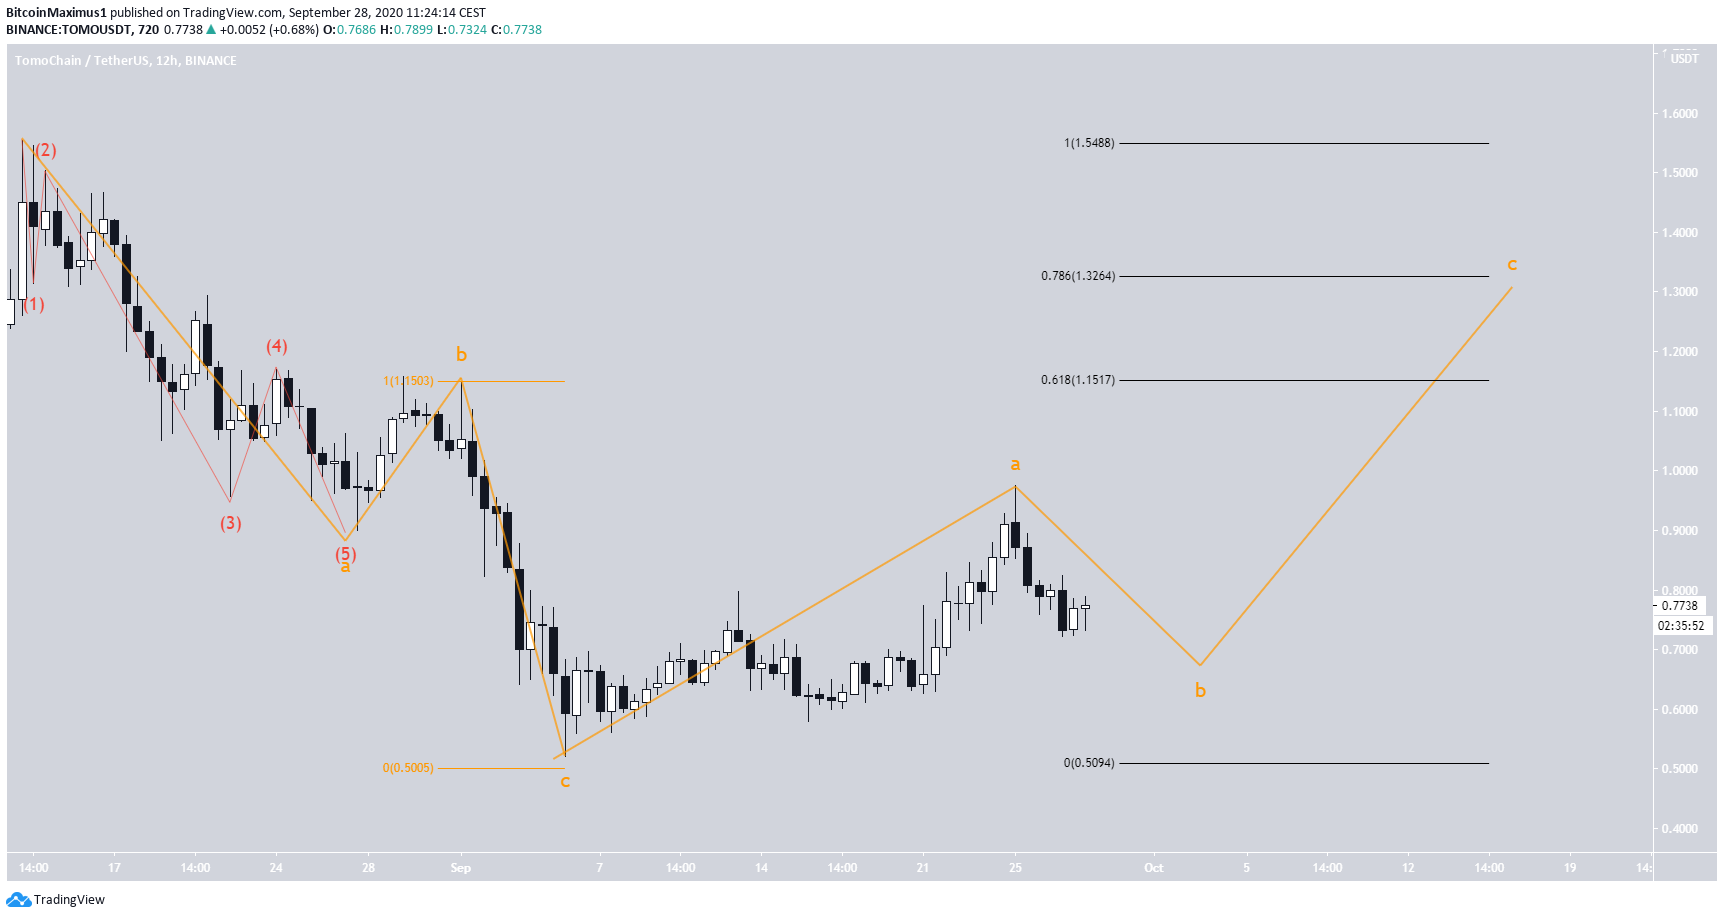
The Tomochain (TOMO) price began a bounce on Sept 5 which is still ongoing. While the price is expected to move upwards in the short and medium-term, the direction of the longer-term trend still seems to be bearish.
The TOMO price has been decreasing since reaching a high of $1.55 on Aug 13. The decrease that followed has been swift, and the price reached a new local low of $0.52 on Sept 5. TOMO has since recovered from this low and is currently trading at $0.78.
TOMO Returns to Average Long-Term Levels
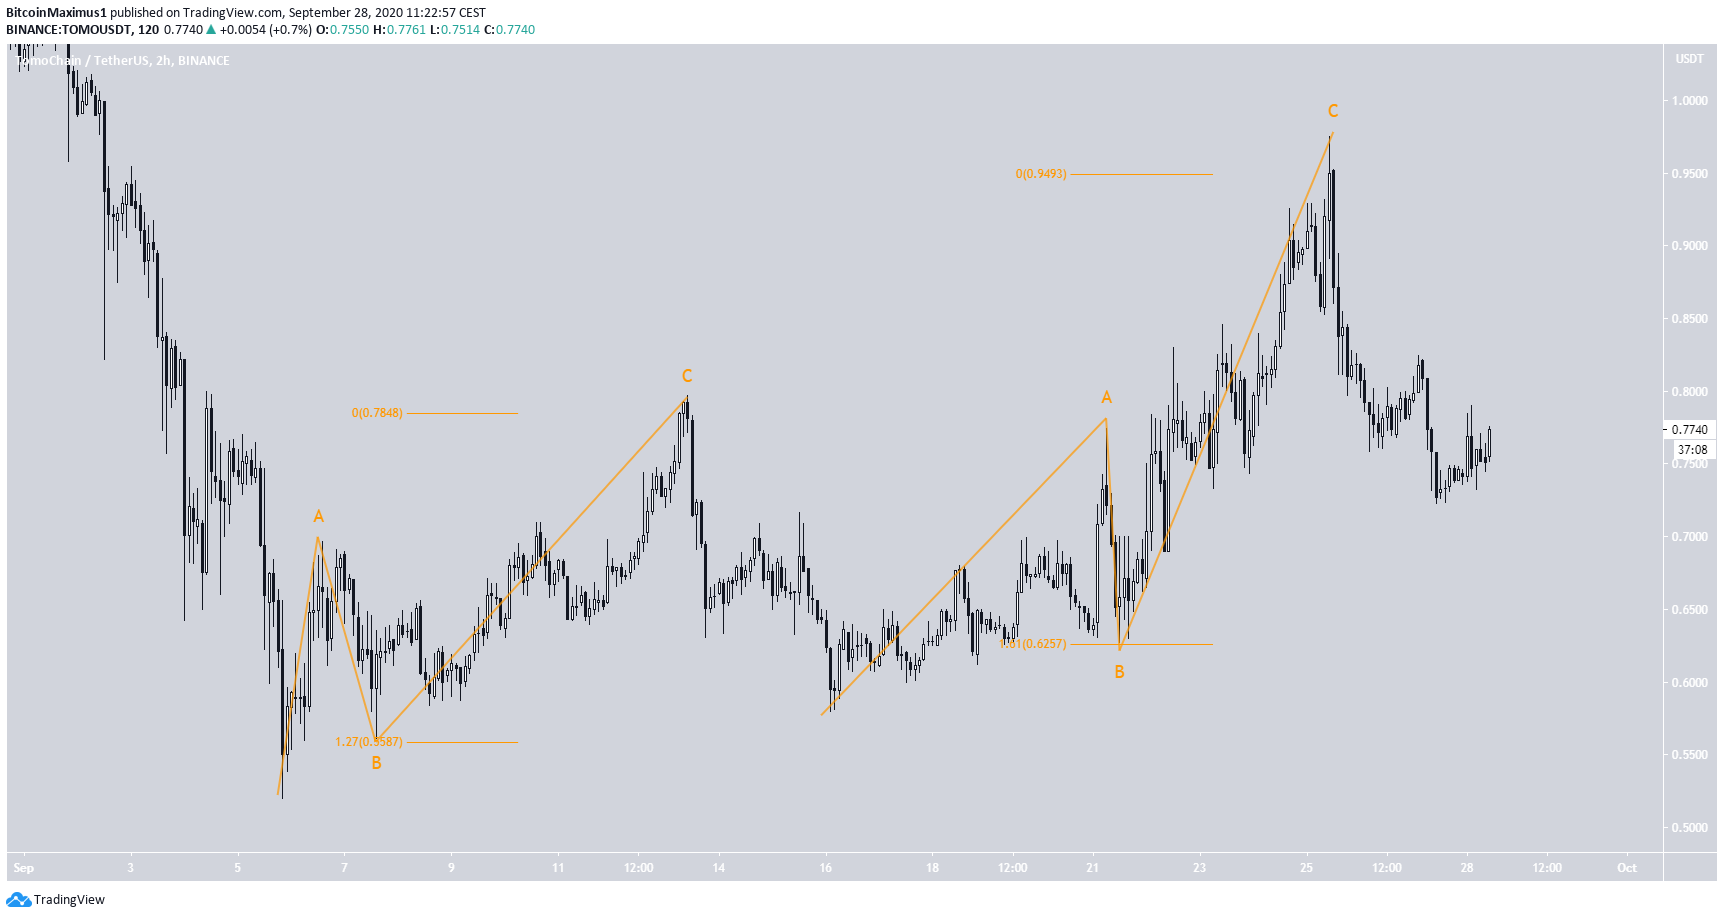
The low validated both the $0.62 support area and the ascending support line that has been in place since the March 13 bottom. On Sept 25, TOMO was able to briefly reach $0.975 before being rejected. Therefore, the price is currently trading in a range between the support line near $0.62 and the resistance area of $0.96.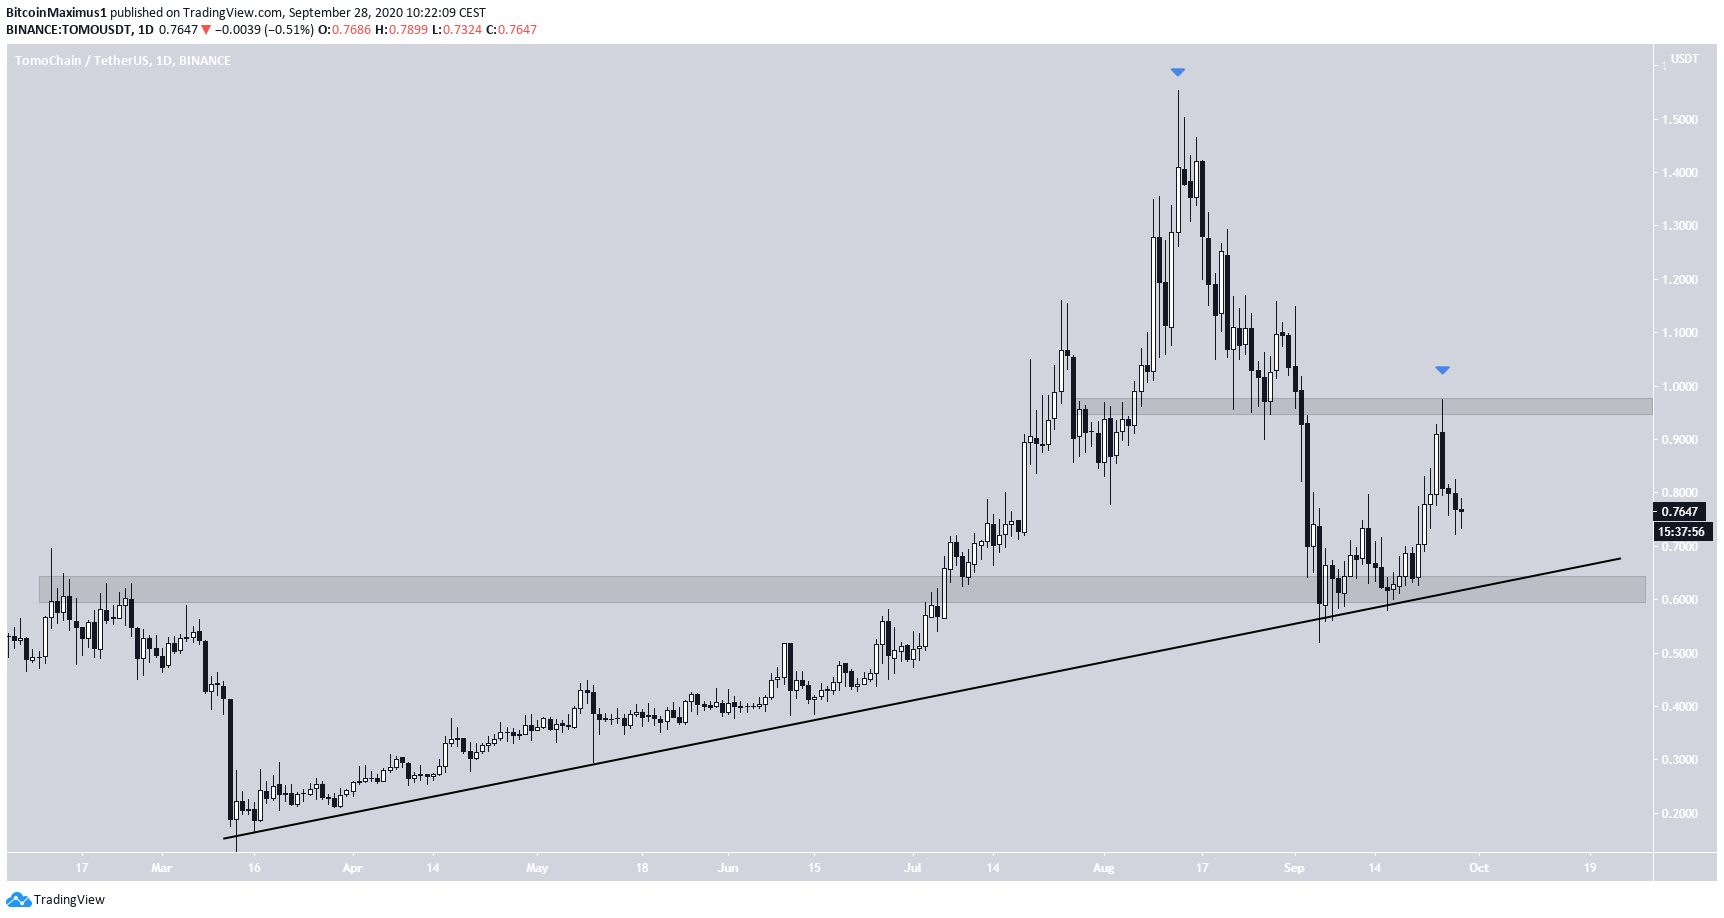
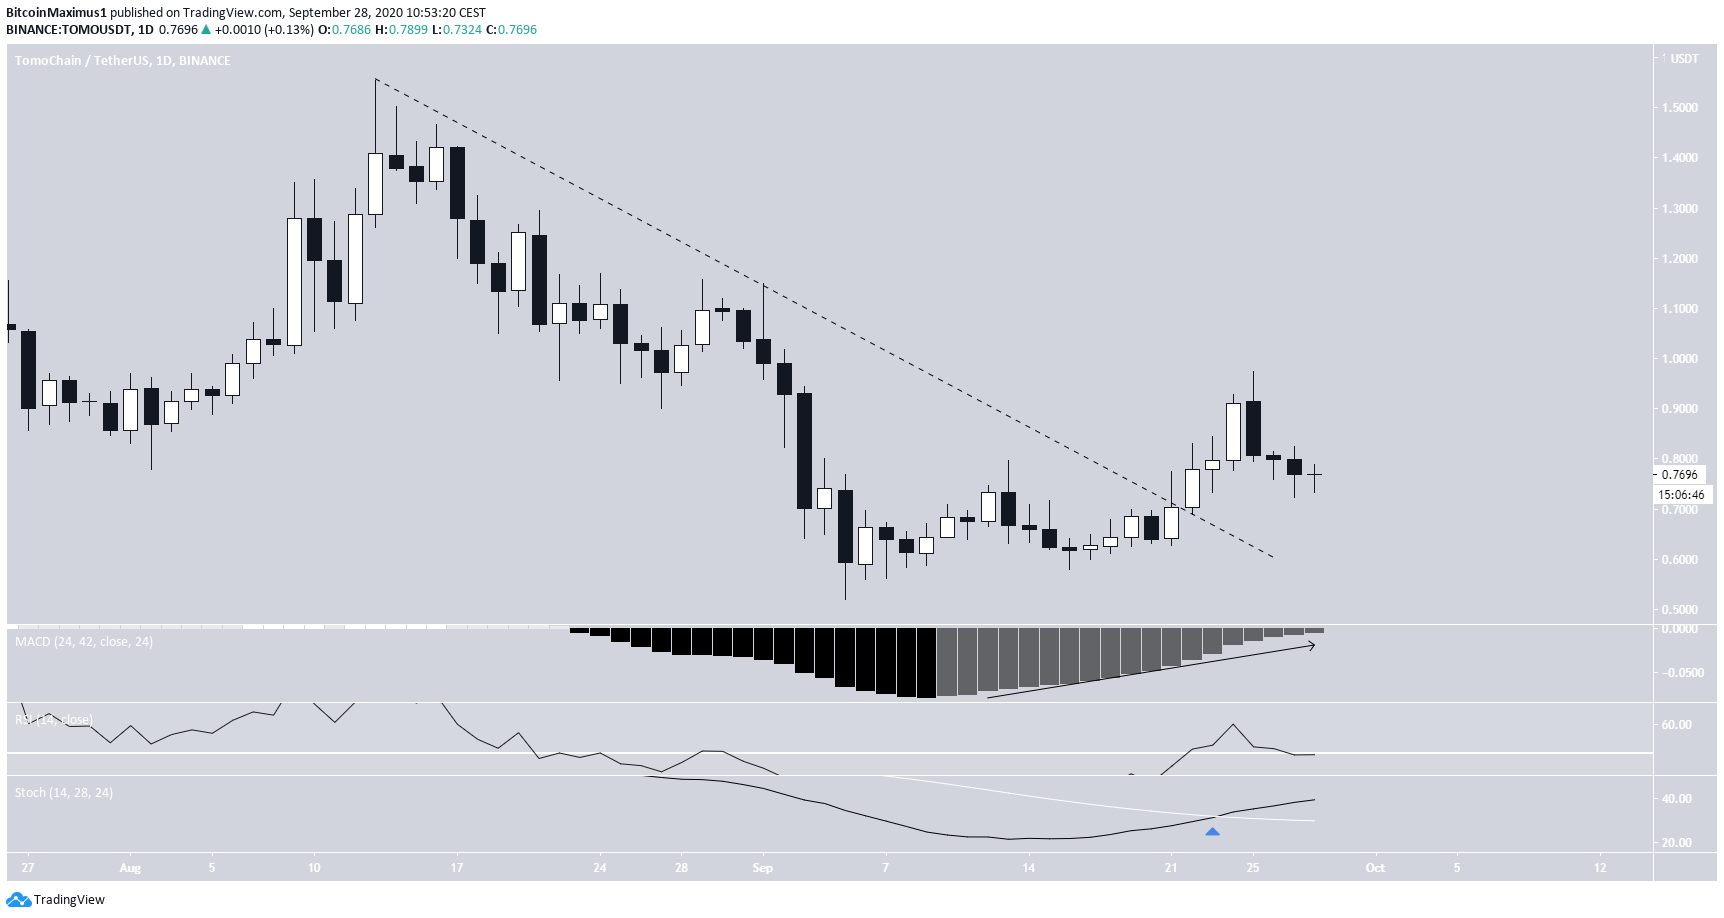
Upward Trend
Technical indicators on the daily time-frame are bullish:- The MACD is moving upwards and has almost crossed into positive territory.
- The Stochastic Oscillator has made a bullish cross and is moving upwards.
- The RSI is above 50.
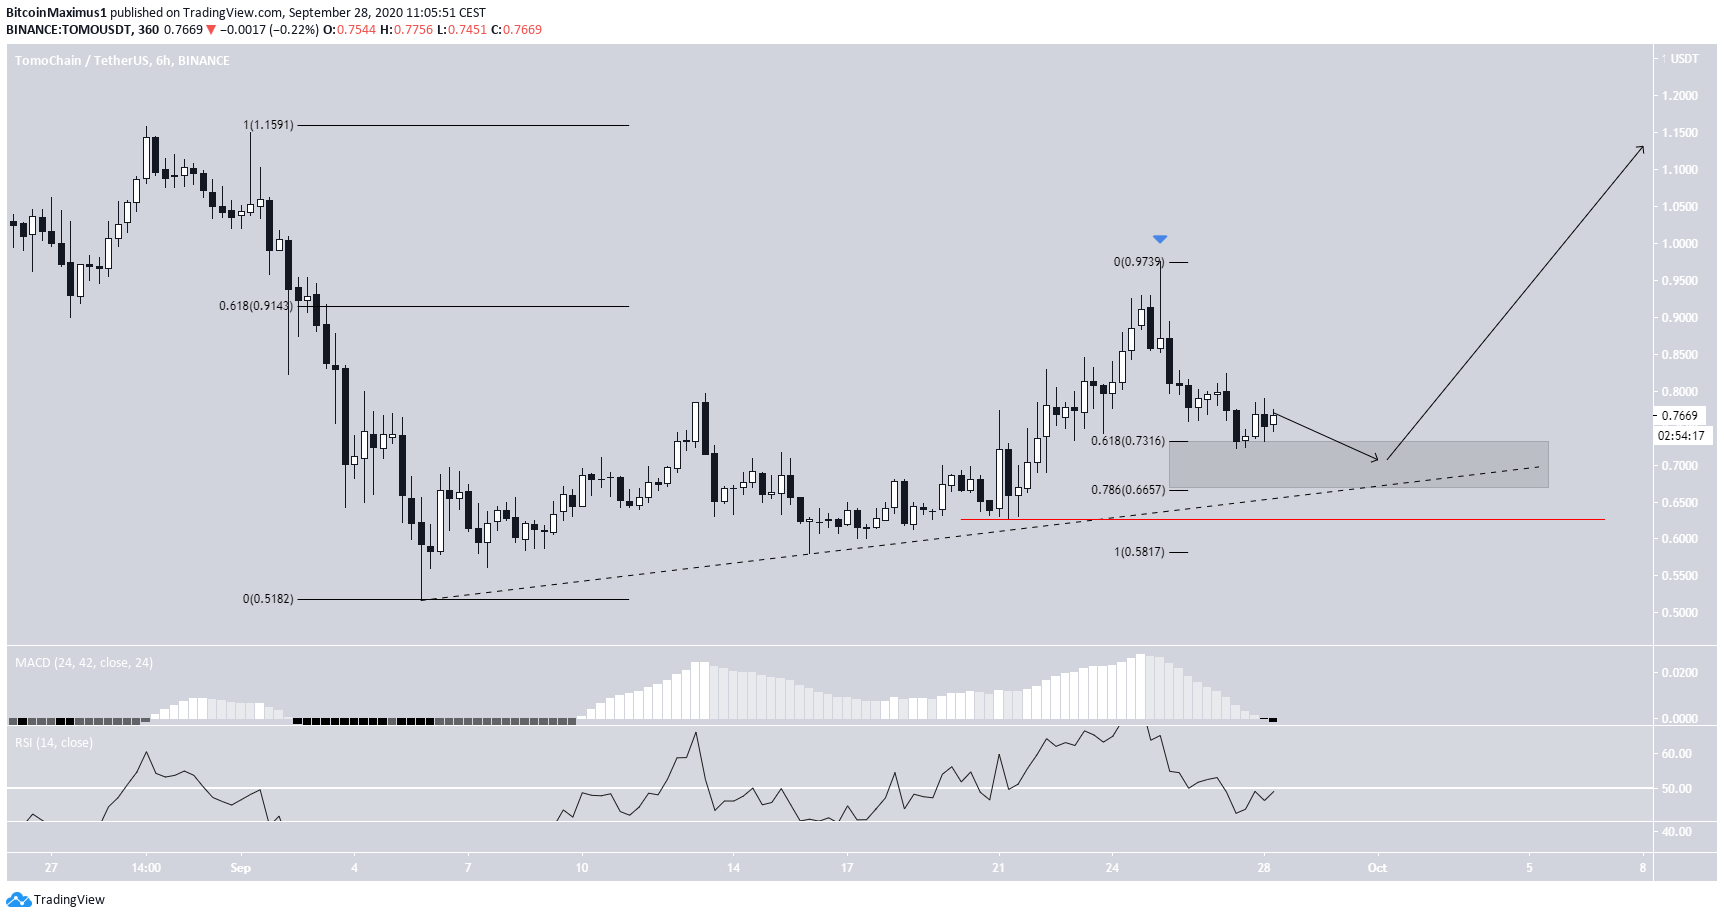
Wave Count
Beginning on Aug 13, it is possible that TOMO has begun a corrective A-B-C formation (shown in orange below). The fact that we can outline five sub-waves (red) for both A and C waves and that their ratio is 1:1 makes this likely to be the correct count.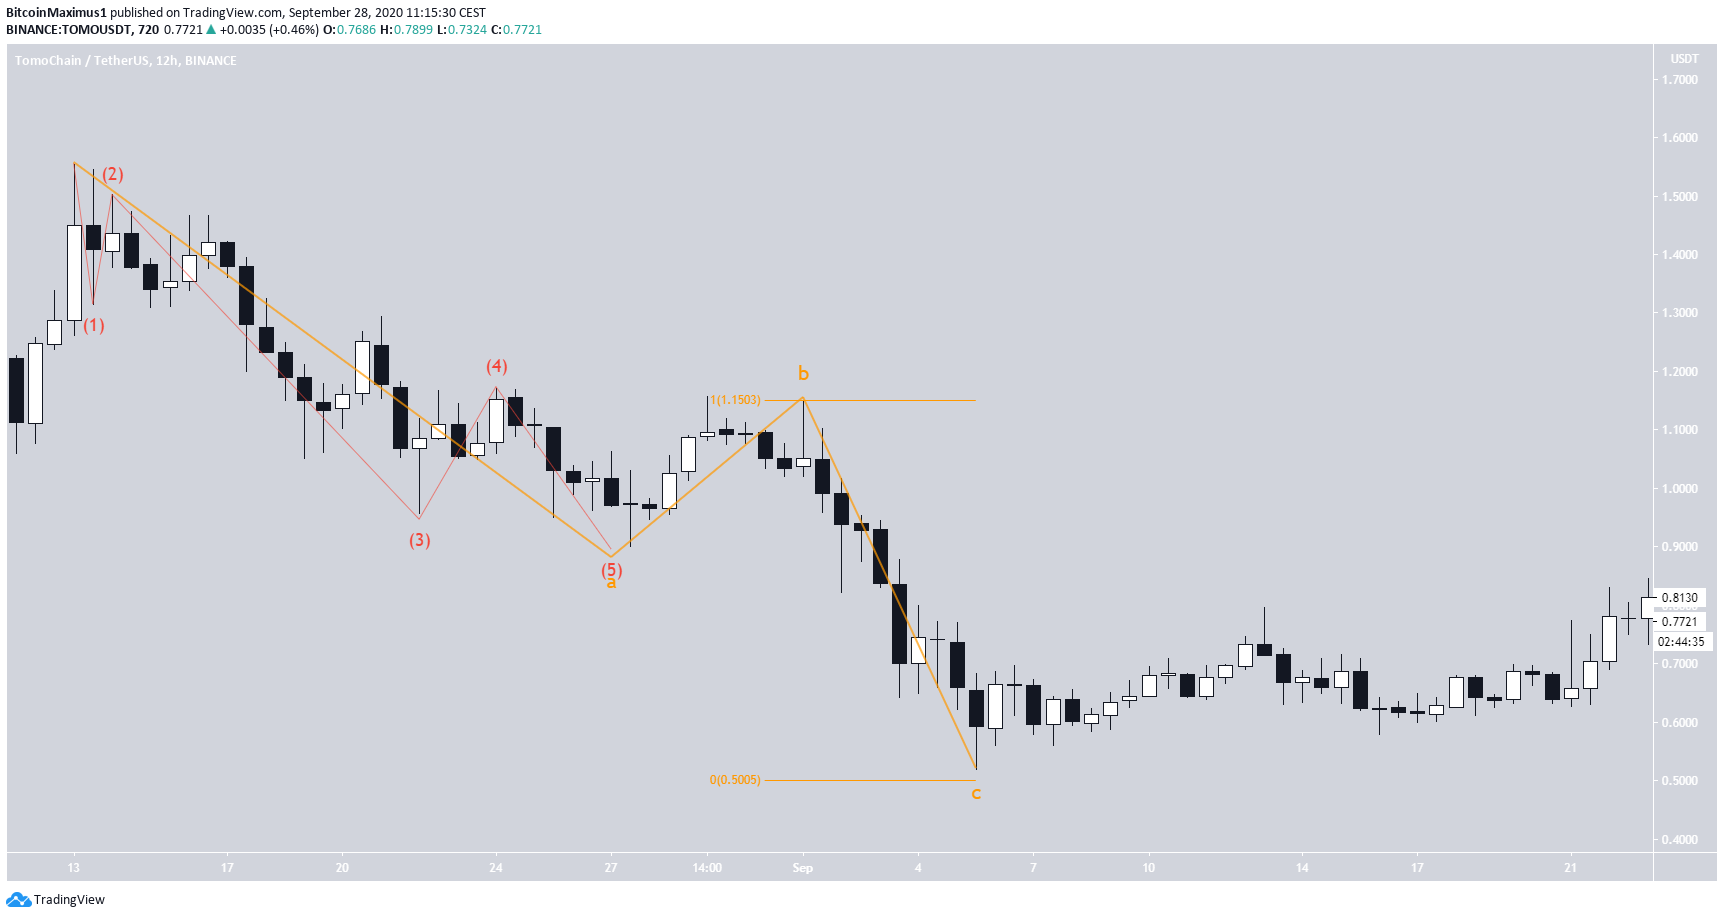
Top crypto platforms in the US
Disclaimer
In line with the Trust Project guidelines, this price analysis article is for informational purposes only and should not be considered financial or investment advice. BeInCrypto is committed to accurate, unbiased reporting, but market conditions are subject to change without notice. Always conduct your own research and consult with a professional before making any financial decisions. Please note that our Terms and Conditions, Privacy Policy, and Disclaimers have been updated.

Valdrin Tahiri
Valdrin discovered cryptocurrencies while he was getting his MSc in Financial Markets from the Barcelona School of Economics. Shortly after graduating, he began writing for several different cryptocurrency related websites as a freelancer before eventually taking on the role of BeInCrypto's Senior Analyst.
(I do not have a discord and will not contact you first there. Beware of scammers)
READ FULL BIO
Sponsored
Sponsored